
Formation of the Figge Maar Seafloor Crater During the 1964 B1 Blowout in the German North Sea
 Jens Karstens1*,
  Jens Schneider von Deimling2, Christian Berndt1, Christoph Böttner1,2, Michel Kühn1,
  Benedict T. I. Reinardy3,
  Axel Ehrhardt4, Jonas Gros1, Bettina Schramm1,4, Dirk Klaeschen1, Judith Elger1, Matthias Haeckel1, Mark Schmidt1, Sven Heinrich2, Philipp Müller5 and Frithjof Bense4
- 1GEOMAR Helmholtz Centre for Ocean Research Kiel, Kiel, Germany
- 2Institute of Geoscience, Kiel University, Kiel, Germany
- 3Department of Physical Geography, Stockholm University, Stockholm, Sweden
- 4Federal Institute for Geosciences and Natural Resources, Hannover, Germany
- 5Department of Earth Science, University of Bergen, Bergen, Norway
In 1964, exploration drilling in the German Sector of the North Sea hit a gas pocket at ∼2900 m depth below the seafloor and triggered a blowout, which formed a 550 m-wide and up to 38 m deep seafloor crater now known as Figge Maar. Although seafloor craters formed by fluid flow are very common structures, little is known about their formation dynamics. Here, we present 2D reflection seismic, sediment echosounder, and multibeam echosounder data from three geoscientific surveys of the Figge Maar blowout crater, which are used to reconstruct its formation. Reflection seismic data support a scenario in which overpressured gas ascended first through the lower part of the borehole and then migrated along steeply inclined strata and faults towards the seafloor. The focused discharge of gas at the seafloor removed up to 4.8 Mt of sediments in the following weeks of vigorous venting. Eyewitness accounts document that the initial phase of crater formation was characterized by the eruptive expulsion of fluids and sediments cutting deep into the substrate. This was followed by a prolonged phase of sediment fluidization and redistribution widening the crater. After fluid discharge ceased, the Figge Maar acted as a sediment trap reducing the crater depth to ∼12 m relative to the surrounding seafloor in 2018, which corresponds to an average sedimentation rate of ∼22,000 m3/yr between 1995 and 2018. Hydroacoustic and geochemical data indicate that the Figge Maar nowadays emits primarily biogenic methane, predominantly during low tide. The formation of Figge Maar illustrates hazards related to the formation of secondary fluid pathways, which can bypass safety measures at the wellhead and are thus difficult to control.
Introduction
Drilling-induced blowouts have the potential to cause devastating environmental catastrophes like the 2010 Deepwater Horizon oil spill in the Gulf of Mexico (McNutt et al., 2012; Reddy et al., 2012). Blowout events are related to the uncontrolled upward flow of formation fluids in a well caused by the uncontrolled pressurization of the borehole by formation fluids entering the drill string due to too low mud weight or to mud loss (Holland, 1997). Blowout preventers represent a second blowout barrier (in addition to the drill mud), which allow mechanical closing of the well and ultimately stopping fluid flow from below (Holland, 1997). However, at time of activation of a blowout preventer, shallow parts of the well may already be pressured sufficiently to cause a breakout of fluids from the well along weak points of the well’s casing or along faults or permeable layers in the non-cased interval of the well (Holland, 1997). This process may result in underground blowouts, which may connect a deep reservoir with a shallower subsurface reservoir like the 2/4-14 underground blowout in the Norwegian Sector of the North Sea (Landrø et al., 2019) or the formation of secondary pathways reaching the seafloor (e.g., B1 blowout, this study; Lusi mud volcano; Davies et al., 2007).
The North Sea Basin and the Norwegian Margin are Europe’s most prolific hydrocarbon provinces, where several minor and three major blowout events took place in 1964, 1985, and 1990 (Judd and Hovland, 2009). The 1985 West Vanguard blowout occurred on the Haltenbanken on the Norwegian Margin, when an exploration well (6407/6-2) encountered gas-charged glaciomarine sand layers about 240 m below the seafloor in 243 m water depth (NOU, 1986; Ottesen et al., 2012). An uncontrolled gas discharge caused a fire onboard, leading to the abandonment of the rig and one casualty (NOU, 1986; Ottesen et al., 2012). The uncontrolled gas discharge continued for months (Ottesen et al., 2012), but there is no information regarding the formation of a seafloor crater. The 22/4b blowout occurred in the British Sector of the North Sea during exploration in 1990, when the drill string hit a shallow gas pocket at 360 m below the seafloor at a water depth of 95 m (Leifer, 2015). The blowout created a 23 m-deep crater on the seafloor with a diameter of 70 m and resulted in long-lived vigorous methane release, which continues until today albeit with reduced flux (Leifer and Judd, 2015; Schneider von Deimling et al., 2015). However, this blowout is dwarfed by the B1 blowout event in 1964 presented here, which occurred in the German sector of the North Sea during drilling of one of the first-ever offshore wells in the North Sea (Figure 1A; Kornfeld, 1964). The sparsely available information about this accident suggests that the drilling operation halted after the drill string hit an overpressured gas pocket in a dolomite layer ∼2900 m below the seafloor in water depth of 35 m (Kornfeld, 1964). The borehole became overpressured and was closed by blowout preventers. Pressurized gas escaped the borehole sideways and migrated to the seafloor forming a crater ∼400 m northeast of the platform, called “Figge Maar” (Figure 1C). There are no eyewitness accounts for the initiation of the blowout, but gas and sediment gushes at the sea surface were observed off the drill rig the next morning (Kornfeld, 1964). Attempts to stop the uncontrolled gas release were unsuccessful, but gas emissions ceased in the following weeks, and the drill site was abandoned.
FIGURE 1

FIGURE 1. (A) Map of the North Sea with rectangular indicating study area. (B) Map showing the location of the Figge Maar in the southeastern North Sea. (C) Bathymetric map of the Figge Maar referenced to mean sea level with seismic profiles (black lines).
The Figge Maar received little attention in the following decades and was only surveyed for the abundance of benthic species as well as sedimentological analysis (Thatje and Gerdes, 1997; Thatje et al., 1999). In 2017, 2018, and 2020, we revisited the Figge Maar crater during three research cruises and collected various data sets, including reflection seismic, sediment echosounder, and multibeam echosounder data, as well as gas samples and sediment probes from the crater floor using an ROV (Karstens et al., 2018; Linke and Haeckel, 2018; Ehrhardt et al., 2021). Based on these datasets, we provide the first integrated geoscientific analysis of the Figge Maar seafloor crater to determine its morphological evolution and the fluid pathways from the gas reservoir to the seafloor during the blowout. Our first objective is to reconstruct the processes leading to the blowout of exploration well B1. We analyze reflection seismic data to constrain the fluid pathway in the subsurface and compare these data with the available information about the events in 1964. Our second objective is to constrain the formation of the Figge Maar seafloor crater during the B1 blowout. Finally, we compare the Figge Maar with other seafloor depressions formed by natural processes (known as pockmarks; Judd and Hovland, 2009) and the 22/4b blowout crater to assess the processes controlling sediment removal and redistribution during crater formation.
Geological Background
The Figge Maar is located in the southeastern part of the North Sea and it is part of the Southern Permian Basin, which is a hydrocarbon province extending from the United Kingdom to the central Baltic Sea (e.g., Glennie and Provan, 1990; Ziegler, 1990; Breunese et al., 2010). Halokinesis of Upper Permian Zechstein evaporites was key for the creation of most hydrocarbon reservoirs by forming traps in post-Permian strata or directly sealing Lower Permian Rotliegend reservoirs (Glennie and Provan, 1990; Grassmann et al., 2005; Breunese et al., 2010; Harding and Huuse, 2015; Müller et al., 2020). In the study area, the transition from the Upper Permian Zechstein to the Lower Triassic Buntsandstein is associated with a marked change in sedimentary facies. Zechstein clay- and siltstones with anhydrite intercalations are overlain by small-scale fining-upward cycles of fine-grained sandstones, carbonate sandstones (containing oolites) carbonates and anhydrite layers of the Lower Buntsandstein (i.e., Bernburg and Calvörde Folge). This marks a transition from the evaporitic sabkha facies of the Upper Permian Zechstein to a facies characterised by mainly playa lake and fluvial to lacustrine or alluvial sediments of the Lower Triassic Buntsandstein (Figure 2; Geluk and Röhling 1997; Lepper et al., 2013). Triassic salt tectonics resulted in the formation of peripheral sinks. At the Figge Maar, this sink has been filled by up to 1.8 km of sediments (Bachmann et al., 2010). Regional tectonic subsidence resulted in marine conditions leading to the accumulation of argillaceous marly deposits and sandstone beds in the Early Cretaceous and marine carbonates and limestones of the Chalk Group in the Late Cretaceous (Van Dalfsen et al., 2006; Harding and Huuse, 2015). Salt tectonics continued during the Cenozoic forming complex salt structures and faults (Harding and Huuse, 2015). Since the Middle Paleocene, eustatic sea-level variations controlled the deposition of silicic sediments (Clemmensen and Thomsen, 2005) and led to the deposition of marine muds during the Late Paleocene to the Miocene and marine sands in the Early Pliocene (Figure 2; Knox et al., 2010).
FIGURE 2
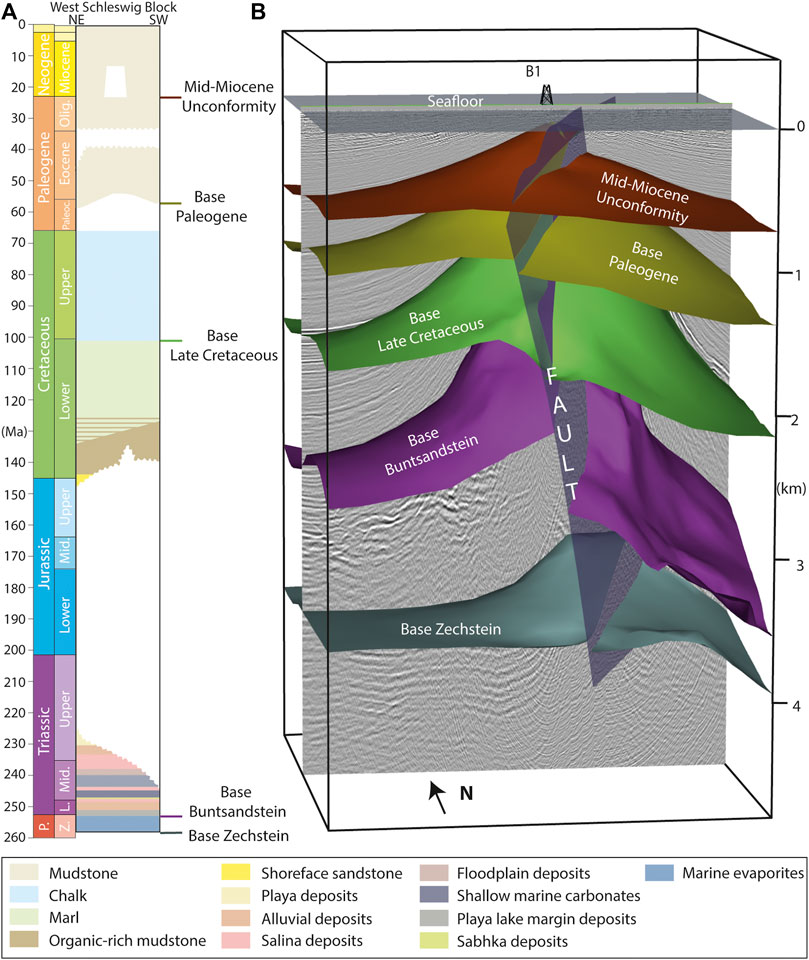
FIGURE 2. (A) Tectono-stratigraphy of the West Schleswig Block based on Jakobsen et al. (2020). Salt-tectonic controlled Quaternary erosion above the salt diapir is not included. (B) 3D view on key stratigraphic horizons above the Helga salt diapir with seismic profile (Figure 4) and well head position of borehole B1. Stratigraphic horizons are from the TUNB 3D model (gst.bgr.de).
The Quaternary in the southern North Sea was dominated by the change between marine, glaciomarine, and terrestrial conditions. Ice advances during Marine Isotope Stage 6 (MIS6; ∼200 ka) and MIS12 (∼500 ka; Coughlan et al., 2018) affected the study area. Subglacial erosion and salt tectonics caused localized uplift, which formed a pronounced unconformity between MIS 6 and 12 till layers (Coughlan et al., 2018) and older strata which are most likely Miocene age at the location of the Figge Maar. The over-consolidated, fine-grained tills deposited by grounded ice are covered by tens-of-meter-thick fluvial sand and gravel layers, as well as interglacial clay and silt deposits (Coughlan et al., 2018). At the end of the last glaciation, glaciofluvial or glaciomarine muddy sands and glaciolacustrine clay layers were deposited in the study area (Coughlan et al., 2018). During the Holocene, fine sands and silts were deposited (Unnithan and Rossi, 2018) on top of subaerial peat layers (Hepp et al., 2012). The North Sea Basin hosts several natural gas seep sites (Judd and Hovland, 2009), which either emit deep thermogenic hydrocarbons (e.g., Tommeliten seep; Niemann et al., 2005; Schneider von Deimling et al., 2011) or methane formed by the microbial degradation of organic matter in shallow sediments (Floodgate and Judd, 1992; Römer et al., 2017; Böttner et al., 2019).
Materials and Methods
We surveyed the Figge Maar blowout crater in 2017 with RV Poseidon, in 2018 with RV Alkor, and in 2020 with RV Maria S. Merian. During an ROV dive in 2017, we collected gas bubbles released from the seabed at Figge Maar using a dedicated gas sampler (Linke and Haeckel, 2018). Gas composition was analysed by gas chromatography and methane was analysed for its stable carbon-isotope signature with a Thermo MAT253 isotope ratio mass spectrometer (Vielstädte et al., 2015). In 2018, we acquired bathymetric data with a horizontal resolution of 0.5 m using a 400 kHz NORBIT iWBMSe chirp multibeam system. In addition, the area was surveyed with a 8 kHz Innomar SES-2000 medium parametric echosounder and a 2D multi-channel reflection seismic system consisting of a GI-airgun (15 in³ generator and 15 in³ injector) and a 212.5 m-long streamer with 136 hydrophone groups with a group spacing of 1.56 m (Karstens et al., 2018). Seismic data processing included normal-move-out-correction, trace interpolation, bandpass filtering (corner frequencies: 50, 92, 680, and 800 Hz), multiple attenuation, and Stolt migration with a constant velocity of 1500 m/s (Kühn, 2020). The resulting seismic data have a horizontal resolution of about 1.56 m (common midpoint spacing) and a vertical resolution of ∼6 m at the seafloor (λ/2 criterion with dominant frequency of 125 Hz), decreasing downwards.
In 2020, additional seismic profiles were acquired by the German Federal Institute for Geosciences and Natural Resources (BGR) using two GI-Guns with 45 in³ generator and 105 in³ injector volume and a 1200 m-long streamer (192 channels with a channel spacing of 6.25 m), allowing much deeper penetration compared to the 2018 survey (Ehrhardt et al., 2021). Seismic data processing included normal-move-out-correction, trace-editing, velocity analysis, bandpass filtering, post-stack predictive deconvolution, and post-stack Kirchhoff time migration. The resulting seismic data have a horizontal resolution of about 3 m (common midpoint spacing) and a vertical resolution of ∼12 m at the seafloor (λ/2 criterion with dominant frequency of 60 Hz), decreasing downwards.
In addition, we compared the bathymetric grid of the Figge Maar with results from Thatje et al. (1999) and with bathymetric grids from the 22/4b blowout (Schneider von Deimling et al., 2015) and the Scanner Pockmark (Böttner et al., 2019). For each of these, we estimated crater volumes by calculating the crater depth compared to the surrounding seafloor by summing the grid values within the crater and multiplying these with the grid cell size in the geophysical interpretation software Petrel.
Results
Morphological Evolution of the Figge Maar and Present-Day Gas Escape
The first survey showed a crater depth of 31 m relative to the surrounding seafloor and was measured shortly after the blowout in 1964 (Thatje et al., 1999). Bathymetric mapping in 1995 indicated that the crater depth had shoaled significantly with a maximum depth of only 15 m (Figure 3A; Thatje et al., 1999). Our measurements in 2018 revealed a crater depth of 12 m and an elliptical shape with a major axis of ∼550 m and a minor axis of ∼450 m (Figures 1C, 3A). The present-day crater has a maximum slope of 3–7° (Figure 1C), while sediment echosounder profiles reveal buried reflectors with a slope of 10°, most likely representing the buried crater wall before slumping and sediment deposition began infilling the crater (Figure 3C). Extrapolating the reflections in echosounder profiles allows constraining a maximum crater depth of 33–38 m, assuming a seismic velocity of 1,500–1,750 m/s. Based on this, the initial crater had a volume of 2.0–2.3 × 10⁶ m3, which was reduced to 1.2 × 10⁶ m3 in 1995 (Thatje et al., 1999) and 0.7 × 10⁶ m3 in 2018 due to the entrapment of sediments. This corresponds to an average sedimentation rate of ∼22,000 m3/yr between 1995 and 2018. The Figge Maar is surrounded by up to 2 m-thick sediment lobes (Figures 1C, 3B), which have been deposited by the blowout itself or by sediment redistribution due to strong (tidal) bottom currents. Assuming a sediment density (ρ) of 1,600—2,100 kg/m³ for glacial sediments (Clarke et al., 2008) and based on the crater volume (V) calculation (2.0–2.3 × 10⁶ m3), the Figge Maar blowout removed a total mass (m) of 3.2–4.8 Mt of material (m = V *ρ).
FIGURE 3
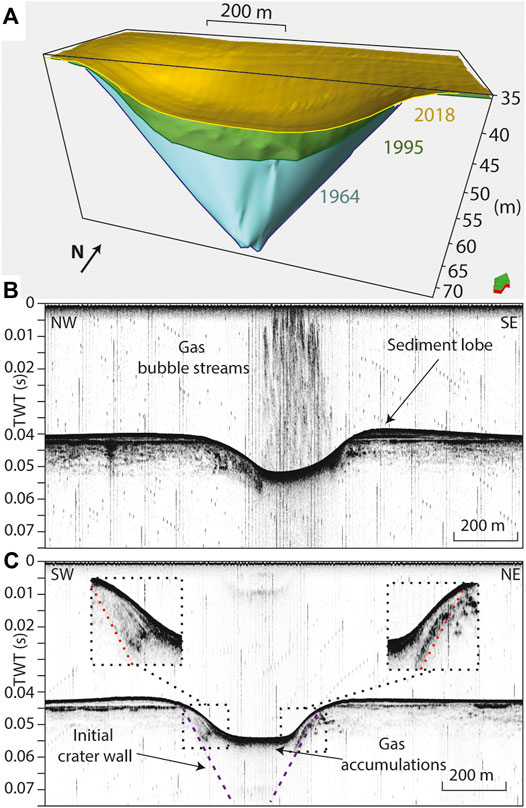
FIGURE 3. (A) 3D view of three bathymetric grids from the Figge Maar illustrating the temporal evolution of the northern half of the crater. The 1964 grid is based on sediment echosounder interpretations using a seismic velocity of 1750 m/s, the 1995 grid is based on bathymetric measurements in Thatje et al., 1999 and the 2018 grid is based on bathymetric measurements in 2018. (B) Sediment echosounder profile showing gas bubble streams above the crater during low tide. (C) Sediment echosounder profile with reflections indicating the initial crater geometry (dashed purple line) and no gas emissions (high tide). Profile locations are shown in Figure 1C.
Hydroacoustic surveying over a tidal cycle revealed that gas bubbles are released from the Figge Maar preferentially during low tide (Figure 3B), indicating a gas reservoir which is sensitive to pressure variations (e.g., Schneider von Deimling et al., 2010). No release of free gas was observed outside the crater during the surveying. Gas sampling with an ROV during the 2017 Poseidon cruise revealed that present-day seepage is dominated by methane with a δ13C value of −64‰ compared to the Vienna Pee Dee Belemnite (VPDB) standard (Jürchott, 2018; Linke and Haeckel, 2018). Sediments in the crater contain free gas, which causes a phase-reversal of the crater floor reflection in the seismic data (Figures 4, 5A).
FIGURE 4
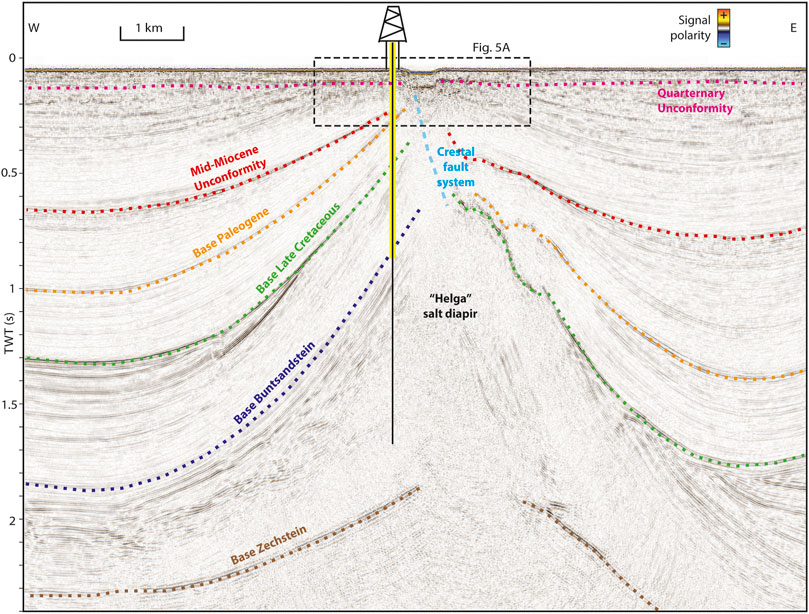
FIGURE 4. Long-streamer (2020 BGR survey) profile showing the drilling location of B1 with approximate drill path (black line) and the extent of casing (thick yellow line) through steeply inclined strata above a Zechstein salt diapir, prominent stratigraphic boundaries (dotted lines) and the crestal fault system (blue line). Profile location is shown in Figure 1C.
FIGURE 5
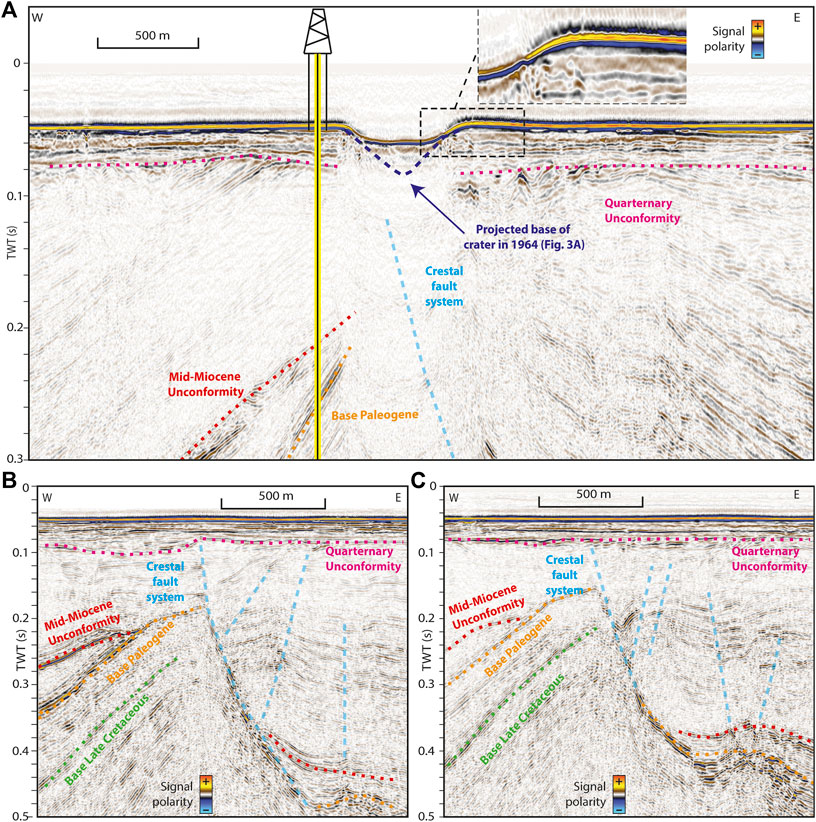
FIGURE 5. (A) High-resolution (2018 GEOMAR survey) 2D reflection seismic profiles showing the Figge Maar blowout crater drilling location of B1 with approximate drill path (black line). High-resolution (2018 GEOMAR survey) 2D reflection seismic profiles north (B) and south (C) of the Figge Maar blowout crater revealing prominent stratigraphic boundaries (dotted lines) and the crestal fault system (blue line). Profile locations are shown in Figure 1C.
Reflection Seismic Interpretation
The seismic stratigraphy of the study site is characterised by the interaction of a Zechstein salt diapir and the overlying well-stratified sediments (Figure 4). In areas not affected by salt tectonics, the Zechstein interval is located between 1.9 and 2.3 s two-way travel time (TWT), and it is covered by a ∼1.8 ms TWT interval of well-stratified sediments. Layers of this interval (key stratigraphic horizons are marked with dashed lines in Figure 4) are shoaling towards the salt dome with subunits showing different inclinations, indicating repeated phases of salt tectonic deformation. As a result, Miocene sediments are present as shallow as 50 m below the seafloor, assuming a seismic velocity of 1,750 m/s for shallow sediments. These uplifted sediments are truncated by the Quaternary unconformity, which represents repeated fluvial and glacial erosion (Figure 5A; Coughlan et al., 2018). The unconformity forms a nearly horizontal boundary between the well-stratified sediments and the overlying Quaternary deposits, which show a more complex internal seismic structure with less continuous reflections (Figure 5). The well was cased down to ∼1140 m below seafloor (Kornfeld, 1964), i.e., within the steeply inclined layers of the Upper Zechstein, and it terminated within the salt diapir (Figure 4).
The strong, reversed polarity amplitude of the seafloor reflection strongly suggests the presence of significant amounts of free gas and hinders imaging of underlying geological structures (Figure 5A). Furthermore, the shallow water depth combined with the high-amplitude seafloor reflection causes strong multiples, which overprint reflections from deeper geological structures. Although multiple attenuation during processing was generally successful for both seismic datasets, it further decreased the imaging capacities directly beneath the Figge Maar crater. Consequently, neither the long streamer (Figure 4) nor the short streamer (Figure 5A) configuration allowed direct imaging of the fluid pathway and the interpretation that the fault controlled the fluid ascent is based on the spatial relationship between the seafloor crater and the crestal faults.
The seismic data reveal that deformation of strata overlying the N-S striking salt diapir is asymmetric with an east-dipping main fault controlling crestal extension at the top of the salt diapir (Figures 2B, 4, 5). Similar structural deformation has been observed in many salt provinces and has been attributed to strain focus to accommodate for sag in the sedimentary basins adjacent to the salt diapirs and bending of competent strata at the crest of a diapir (e.g., Judd and Hovland, 2009; Harding and Huuse, 2015; Müller et al., 2018). The Figge Maar crater is located, where the projected path of the main fault intersects the Quaternary unconformity. Crestal fault systems above salt diapirs have been shown to provide pathways for deep fluids to shallower stratigraphic layers or even the seafloor, where they control fluid seepage (Schneider von Deimling et al., 2011; Müller et al., 2018). While free gas blanks the seismic data directly beneath Figge Maar, the seismic data north and south of Figge Maar document the presence of a complex fault system consisting of a primary, eastward-dipping detachment fault and minor antithetic and synthetic faults that connect to the detachment fault (Figures 5B,C).
Discussion
Reconstruction of the B1 Blowout
Due to legal restrictions in Germany, the official reports of the B1 blowout are only available for personal inspection at the BGR archive. The following account of the events draws on reading these documents and the brief summary published by Kornfeld (1964). Drilling operation by the American self-elevating drill rig “Mr. Louie” began on May 23rd, 1964, about 50 km north of the island of Juist and ∼55 km west of the island of Heligoland and represented the first exploration well in the German North Sea. The well was drilled to a total depth of ∼2900 m beneath seafloor and cased down to ∼1140 m depth. When the well passed from an anhydrite formation into a porous dolomite layer, overpressured gas entered and pressurized the borehole. Subsequently, the blowout preventers shut off the well (Kornfeld, 1964). Pressure had built up to 25 MPa (measured at the choke manifold), and the B1 blowout released the pressure in the night from June 22nd to 23rd, 1964. There are reports of two blowout sites; one ∼425 m northwest of the borehole and a second ∼365 m southeast of the drill site (Kornfeld, 1964). However, none of these directions correspond to the actual position of the Figge Maar located northeast of the drill site and there are no indications for a second release point in our datasets (i.e., neither a bathymetric expression in Figure 1C nor in seismic profiles crossing this area). The drill rig was then moved off-site for safety reasons and specialized companies tried to kill the blowout by pumping heavy drilling mud into the borehole. While Thatje et al. (1999) stated that the released gas mainly consisted of carbon dioxide, the contemporary newspaper reports and internal reports noted that the released gas was nitrogen, which is typical for many reservoirs in the North German Basin (Mingram et al., 2003), but the 1964 gas composition cannot be confirmed any longer for lack of samples.
Noteworthy is that the B1 blowout did not occur at the wellhead but several hundred meters away. This clearly indicates that the pressurized gas deviated from the borehole and migrated along the pathway shown in Figure 6. Seismic imaging below the rig site shows continuous reflections below the base of the Buntsandstein (Figure 4), which consists of alternating layers of mud rocks, anhydrite and salt according to well reports from nearby wells B2 and H15-2. There is no seismic evidence indicating whether the breakout occurred in uncased Zechstein evaporates or in the cased segment of the well further up (yellow line in Figure 4). There are no direct seismic indications of remnant gas accumulations along the pathway within the Zechstein evaporates, such as bright or dimmed spots (Løseth et al., 2009). Regardless, the location of the Figge Maar with respect to the borehole makes it likely that the gas has migrated up-dip along permeable layers within the Lower Buntsandstein or Upper Zechstein towards the main fault that bounds the salt diapir in the east (Figures 4, 6). Upon reaching the bounding fault, the gas likely has migrated upward to and through the crestal faults above the salt diapir as it formed the Figge Maar at the location, where the main crestal fault intersects the Quaternary unconformity (Figures 5, 6). This final part of the fluid pathway is characterized by dimming of seismic reflection amplitudes, which we attribute to the presence of remnant gas in the surface sediments impeding seismic imaging immediately below the Figge Maar. The reconstruction of fluid pathways during the B1 blowout highlight the complexity of the formation or reactivation of secondary fluid pathways during blowout events, which have the potential to partly or entirely bypass technical safety measures.
FIGURE 6

FIGURE 6. Reconstruction of fluid pathway during the B1 blowout. Overpressured gas escaped the closed well along steeply inclined layers, reached the crestal fault system of the neighbouring salt diapir and ascended to the seafloor.
Reconstruction of Crater Formation During the B1 Blowout
Seafloor craters formed by natural fluid discharge have been studied in various geological settings around the world and are the result of prolonged seepage or focused release of pulses of liquids or gases (Judd and Hovland, 2009). While the dynamics and controlling factors of pockmark formation are still a matter of debate, it is likely that fluid type and overpressure, the discharge rate and duration, as well as the structural integrity and type of sediments are important factors (Judd and Hovland, 2009; Løseth et al., 2011; Hoffmann et al., 2020). Seafloor crater formation by prolonged fluid flow is controlled by mobilization of poorly consolidated sediments, which become suspended by the upward flow of fluids and then removed by currents (Rocha et al., 1993; Nichols et al., 1994). Sediment fluidization occurs when the dragging force of a moving fluid becomes more significant than the weight of the particles affected by the flow (Nichols et al., 1994). This process depends on grain size, shape and density, fluid density, and porosity. It becomes more effective with increasing flow rate and with decreasing degree of sediment cohesion and consolidation (Rocha et al., 1993; Nichols et al., 1994). Prolonged sediment fluidization may be the dominant process during the formation of craters as for example reported for the SLN-02 blowout, onshore Netherlands (Schout et al., 2018). Crater formation by focused fluid pulses is less understood, but the rapid expansion of gas close to the seafloor causing the eruptive expulsion of fluids and sediments is considered the dominant process for seafloor craters formed in substrate with high resistance against fluidization. Examples are pockmarks in the Barents Sea (Andreassen et al., 2017; Waage et al., 2020) or the 22/4b blowout in the British North Sea (Figure 7B; Leifer and Judd, 2015; Schneider von Deimling et al., 2015).
FIGURE 7
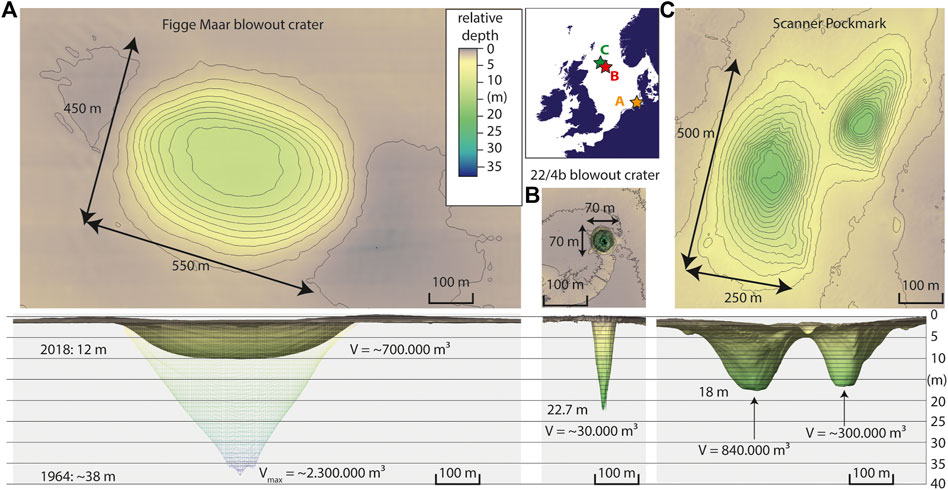
FIGURE 7. Morphological and depth comparison between (A) the Figge Maar (this study, see Figure 1C). (B) the 22/4B blowout (Schneider von Deimling et al., 2015), and (C) the Scanner Pockmark (Böttner et al., 2019) showing relative depth with respect to the surrounding seafloor. All models have the same scale. Vertical profiles are 10 times exaggerated.
The formation of the 500 m-wide and 18 m-deep Scanner Pockmark in the British North Sea is characterized by an initial expulsion of overpressured gas from a gas pocket ∼50 m below seafloor (Figure 7C; Böttner et al., 2019; Callow et al., 2021). This was followed by prolonged moderately intense, capillary-dominated seepage over a long period from at least 13 to 26.6 ka and tidally controlled bubble release at present-day (Böttner et al., 2019; Callow et al., 2021). The depth of the Scanner Pockmark base coincides with the boundary between consolidated glacial tills and the overlying unconsolidated, glaciomarine sediments (Böttner et al., 2019). The Figge Maar and the Scanner Pockmark morphologies are strikingly similar, with diameters of ∼500 m and crater slopes of ∼6° (Böttner et al., 2019). Comparable to the Scanner Pockmark, we propose a hybrid model for the Figge Maar crater formation that fits the observed dimensions and the crater’s shape (Figure 7).
The blowout caused the rapid release of highly overpressured fluids along secondary fluid pathways towards the seafloor. We expect that violent gas expansion caused an explosive removal of sediments forming an initial crater (Figure 8B) which is consistent with eyewitness reports of sediment gushes on the sea surface (Kornfeld, 1964). This initial release was followed by vigorous fluid discharge from the crater floor, fluidizing the sand-rich Quaternary sediments (Figure 8C). Upward flux and strong tidal currents transported suspended sediments outside the crater depositing the sediment lobes. The initial explosive expulsion, subsequent fluidization, and mobilization removed the top 38 of sediments from the 500 m-wide crater. It mobilized up to 3.2–4.8 Mt of sediments, which requires a substantial energy release during the B1 blowout.
FIGURE 8
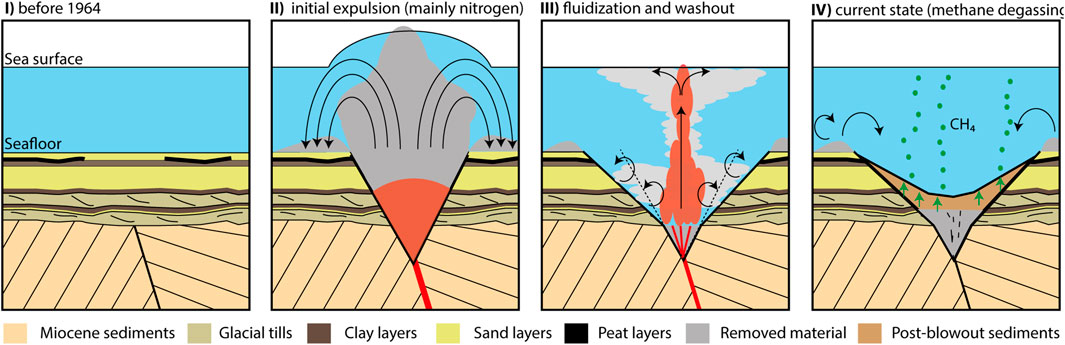
FIGURE 8. Conceptual reconstruction of the formation of the Figge Maar blowout crater, with Quaternary stratigraphy after Coughlan et al. (2018).
After the vigorous fluid discharge ceased, the Figge Maar became a sediment trap (Figure 8D). About 22,000 m3 of sediments accumulate in the Figge Maar every year. The material is mainly transported by the strong tidal currents. About 3 m of sediments were deposited in the Figge Maar between 1995 and 2018, resulting in an average sedimentation rate of 13 cm per year. This is significantly less than the sedimentation rate of 50 cm per year reported for the time interval between 1964 and 1995 by Thatje et al. (1999) but corresponds to a similar yearly deposited mass within the conical crater geometry.
Present-Day Gas Emissions From the Figge Maar
While it is likely that the primary B1 blowout released mainly nitrogen, our 2017 Figge Maar ROV survey showed that present-day gas emission consists primarily of microbial methane (>98% vol.) with a δ13C isotope ratio of −64‰ (VPDB; Jürchott, 2018). We attribute the high methane content and low stable carbon isotope ratio to rapid post-blowout sedimentation of organic material and its in-situ degradation by methanogens. Together with potential contributions from biogenic methane trapped in the sediments below, they likely fuel the present-day lower-intensity gas emissions (Figures 3B, 8D). Some of the gas may be formed in the crater, while some may migrate from the surrounding shallow subsurface through secondary fluid pathways caused by the blowout. The released gas may also include carbon dioxide or methane sourced from e.g., Holocene peat deposits surrounding the blowout (McGinnis et al., 2011; Hepp et al., 2012; Coughlan et al., 2018). The present-day lower-intensity gas emissions occur predominantly during low tide, indicating the gas reservoir’s sensitivity to hydrostatic pressure variations induced by tides and storms (Schneider von Deimling et al., 2010; Abegunrin et al., 2020). These low-intensity present-day emissions are unlikely to contribute significantly to greenhouse gas budgets.
Conclusion
The first geophysical analysis of the B1 blowout reveals that an underground blowout formed or reactivated existing secondary pathways to the seafloor and the associated Figge Maar seafloor crater. Overpressured gas (likely nitrogen) from a ∼2900 m-deep reservoir must have escaped the well likely beneath the cased section and probably migrated along inclined layers towards the crestal fault system of the salt diapir. The underground blowout initiated after the blowout preventers shut the well, and overpressure resulted in the opening of secondary fluid pathways. The blowout created a ∼550 m-wide and up to 38 m deep crater removing up to 4.8 Mt of sediments. The large dimensions of the Figge Maar crater can be explained by a combination of an initial eruptive expulsion followed by prolonged fluidization of mainly sand-rich sediments in the Quaternary succession transported away through currents.
Unlike blowouts involving the discharge of oil like the 2010 Deepwater Horizon and the 1979 Ixtoc 1 in the Gulf of Mexico (Jernelöv and Linden, 1981; McNutt et al., 2012; Reddy et al., 2012), the environmental pollution caused by the B1 blowout was minimal. However, gas blowouts like the B1 blowout represent a major threat to the drilling rig and its personnel, as seen for the 1988 Piper Alpha accident in the North Sea or the 1985 West Vanguard blowout (NOU, 1986; Drysdale and Sylvester-Evans, 1998; Ottesen et al., 2012). In addition, gas blowouts can result in decade-long vigorous gas discharge affecting the regional carbon budget (Leifer and Judd, 2015; Schneider von Deimling et al., 2015). Although not closely monitored in the past decades, it seems unlikely that the B1 blowout caused a similar long-lived gas discharge as the Figge Maar crater was filled in significantly during the 30 years after the blowout (Thatje et al., 1999), and there were no reports about sea surface disturbances in the decades after the blowout. As the blowout was charged most likely by nitrogen and present day lower-intensity gas emissions are unlikely to contribute significantly to greenhouse gas budgets, the overall environmental impact of the B1 blowout and its crater may be considered insignificant.
The B1 blowout offers the unique opportunity to study the processes governing evolution of a seafloor crater in fast motion. The formation of the Figge Maar resembles that of the Scanner Pockmark, resulting in comparable dimensions and morphologies, while strong bottoms currents filling up the depression with more than 22,000 m3 per year define a unique laboratory to study sedimentological, biological, and geochemical processes under highly dynamic conditions.
Data Availability Statement
The raw data supporting the conclusion of this article will be made available by the authors, without undue reservation.
Author Contributions
JK, JSvD, and CBe planned and organized the project. JK, JSvD, CBo, MK, JE, BS, PM, BR, and DK were in charge for geophysical surveying, processing and interpretation during the research cruise on RV Alkor in 2018. MH, MS, and JG conducted the geochemical sampling during the research cruise on RV Poseidon in 2017 and analysed the geochemical samples. JK, PM, and FB integrated the local into the regional stratigraphy and analysed historic records of the drilling accident. JSvD and SH processed and interpreted the multibeam echosounder data. AE was in charge for geophysical surveying, processing and interpretation of seismic data during research cruise on RV Maria S. Merian in 2020. BR was in charge for the analysis of the Quaternary sediments and integrating the local stetting into the regional framework. JK, JSvD, CBo, CBe, JG, and BR drafted and wrote the manuscript, while MK, BS, DK, JE, MH, MS, AE, SH, PM, and FS corrected the manuscript and improved it with their comments.
Funding
This research was funded by European Commission’s Horizon 2020 research and innovation program under grant agreement No. 654462 (project STEMM-CCS).
Conflict of Interest
The authors declare that the research was conducted in the absence of any commercial or financial relationships that could be construed as a potential conflict of interest.
Publisher’s Note
All claims expressed in this article are solely those of the authors and do not necessarily represent those of their affiliated organizations, or those of the publisher, the editors and the reviewers. Any product that may be evaluated in this article, or claim that may be made by its manufacturer, is not guaranteed or endorsed by the publisher.
Acknowledgments
We thank the European Commission’s Horizon 2020 research and innovation program for funding under grant agreement No. 654462 (project STEMM-CCS). We thank the masters and the crews of the RV Maria S. Merian, RV Alkor and RV Poseidon for their support. Furthermore, we thank two reviewers for improving the quality of this study with their helpful and constructive comments. We thank the EMODnet initiative for providing regional bathymetric data. We are grateful for the use of tide model data to correct bathymetry kindly provided by Bundesamt für Seeschifffahrt und Hydrographie (BSH). We would like to thank Schlumberger and IHS for granting educational licenses to their software. We also thank Peter Feldens, Christian Weidle and Thomas Meier for their support.
References
Abegunrin, A., Hepp, D. A., and Mörz, T. (2020). Correction of Water Column Height Variation on 2D Grid High-Resolution Seismic Data Using dGPS Based Methodology. Sci. Rep. 10, 18760. doi:10.1038/s41598-020-75740-z
Andreassen, K., Hubbard, A., Winsborrow, M., Patton, H., Vadakkepuliyambatta, S., Plaza-Faverola, A., et al. (2017). Massive Blow-Out Craters Formed by Hydrate-Controlled Methane Expulsion from the Arctic Seafloor. Science 356 (6341), 948–953. doi:10.1126/science.aal4500
Böttner, C., Berndt, C., Reinardy, B. T. I., Geersen, J., Karstens, J., Bull, J. M., et al. (2019). Pockmarks in the Witch Ground Basin, Central North Sea. Geochem. Geophys. Geosystems 20 (4), 1698–1719.
Breunese, J. N., Andersen, J. H., Brinkman, S., Jagosiak, P., Karnin, W-D., Karnkowski, P. H., et al. (2010). “Reserves and Production History,” in Petroleum Geological Atlas of the Southern Permian Basin Area (Houten, Netherlands: European Association of Geoscientists and Engineers EAGE), 271–281.
Callow, B., Bull, J. M., Provenzano, G., Böttner, C., Birinci, H., Robinson, A. H., et al. (2021). Seismic Chimney Characterisation in the North Sea - Implications for Pockmark Formation and Shallow Gas Migration. Mar. Petroleum Geol. 133, 105301. doi:10.1016/j.marpetgeo.2021.105301
Clarke, B. G., Hughes, D. B., and Hashemi, S. (2008). Physical Characteristics of Subglacial Tills. Géotechnique 58 (1), 67–76. doi:10.1680/geot.2008.58.1.67
Clemmensen, A., and Thomsen, E. (2005). Palaeoenvironmental Changes across the Danian–Selandian Boundary in the North Sea Basin. Palaeogeogr. Palaeoclimatol. Palaeoecol. 219 (3-4), 351–394. doi:10.1016/j.palaeo.2005.01.005
Coughlan, M., Fleischer, M., Wheeler, A. J., Hepp, D. A., Hebbeln, D., and Mörz, T. (2018). A Revised Stratigraphical Framework for the Quaternary Deposits of the German North Sea Sector: a Geological-Geotechnical Approach. Boreas 47 (1), 80–105. doi:10.1111/bor.12253
Davies, R. J., Swarbrick, R. E., Evans, R. J., and Huuse, M. (2007). Birth of a Mud Volcano: East Java, 29 May 2006. GSA Today 17 (2), 4–9. doi:10.1130/gsat01702a.1
Drysdale, D. D., and Sylvester-Evans, R. (1998). The Explosion and Fire on the Piper Alpha Platform, 6 July 1988. A Case Study. Philosophical Trans. R. Soc. Lond. Ser. A Math. Phys. Eng. Sci. 356 (1748), 2929–2951. doi:10.1098/rsta.1998.0304
Ehrhardt, A., Barckhausen, U., Behrens, T., Demir, Ü., Ebert, T., Engels, M., et al. (2021). Structures of the West-Schleswig Block and the Fluid Migration System of the Blowout Structure 'Figge Maar', Cruise No. MSM 97 (GPF 20-3_085), 13.11.2020-25.11.2020, Emden (Germany) - Emden (Germany). doi:10.48433/cr_msm97
Floodgate, G. D., and Judd, A. G. (1992). The Origins of Shallow Gas. Cont. Shelf Res. 12 (10), 1145–1156. doi:10.1016/0278-4343(92)90075-u
Geluk, M. C., and Röhling, H.-G. (1997). High-resolution Sequence Stratigraphy of the Lower Triassic ‘Buntsandstein’ in the Netherlands and Northwestern Germany. Geol. Mijnb. 76 (3), 227–246. doi:10.1023/A:1003062521373
Glennie, K. W., and Provan, D. M. J. (1990). Lower Permian Rotliegend Reservoir of the Southern North Sea Gas Province. Geol. Soc. Lond. Spec. Publ. 50 (1), 399–416. doi:10.1144/gsl.sp.1990.050.01.25
Grassmann, S., Cramer, B., Delisle, G., Messner, J., and Winsemann, J. (2005). Geological History and Petroleum System of the Mittelplate Oil Field, Northern Germany. Int. J. Earth Sci. 94 (5-6), 979–989. doi:10.1007/s00531-005-0018-x
Harding, R., and Huuse, M. (2015). Salt on the Move: Multi Stage Evolution of Salt Diapirs in the Netherlands North Sea. Mar. Petroleum Geol. 61, 39–55. doi:10.1016/j.marpetgeo.2014.12.003
Hepp, D. A., Hebbeln, D., Kreiter, S., Keil, H., Bathmann, C., Ehlers, J., et al. (2012). An East-West-Trending Quaternary Tunnel Valley in the South-Eastern North Sea and its Seismic-Sedimentological Interpretation. J. Quat. Sci. 27 (8), 844–853. doi:10.1002/jqs.2599
Hoffmann, J. J. L., Schneider von Deimling, J., Schröder, J. F., Schmidt, M., Held, P., Crutchley, G. J., et al. (2020). Complex Eyed Pockmarks and Submarine Groundwater Discharge Revealed by Acoustic Data and Sediment Cores in Eckernförde Bay, SW Baltic Sea. Geochem. Geophys. Geosystems 21 (4), e2019GC008825. doi:10.1029/2019gc008825
Jakobsen, F., Britze, P., Thöle, H., Jähne-Klingberg, F., Doornenbal, H., and Vis, G.-J. (2020). “Deliverable 3.3 Harmonized Stratigraphic Chart for the North Sea Area NL-DE-DK,” in Establishing the European Geological Surveys Research Area to Deliver a Geological Service for Europe (GeoERA), Project 3D Geomodeling for Europe (3DGEO-EU). (GeoERA). Project Number GeoE.171.005.
Jernelöv, A., and Lindén, O. (1981). Ixtoc I: a Case Study of the World's Largest Oil Spill. Ambio 10, 299–306.
Judd, A., and Hovland, M. (2009). Seabed Fluid Flow: The Impact on Geology, Biology and the Marine Environment. Cambridge, UK: Cambridge University Press.
Jürchott, M. (2018). Figge Maar” ein vergessener Blowout-Krater in der deutschen Nordsee – Eine geochemische Charakterisierung der aktuell austretenden Gase. [Bachelor’s thesis]. Kiel, Germany: Christian-Albrechts-Universität zu Kiel.
Karstens, J., Schneider von Deimling, J., Böttner, C., Elger, J., Hilbert, H. S., Kühn, M., et al. (2018). R/V ALKOR Cruise. Report 512 [AL512]. Available from: https://www.geomar.de/en/wasser.
Knox, R. W. O. B., Bosch, J. H. A., Rasmussen, E. S., Heilmann-Clausen, C., Hiss, M., De Lugt, I. R., et al. (2010). “Cenozoic,” in Petroleum Geological Atlas of the Southern Permian Basin Area (Houten, Netherlands: European Association of Geoscientists and Engineers EAGE), 211, 223.
Kühn, M. (2020). Multiple Attenuation in Shallow Marine 2D Short Multichannel Seismic Data from the North Sea. [Master’s thesis]. Kiel, Germany: Christian-Albrechts-Universität zu Kiel.
Landrø, M., Wehner, D., Vedvik, N., Ringrose, P., Løhre, N. L., and Berteussen, K. (2019). Gas Flow through Shallow Sediments—A Case Study Using Passive and Active Seismic Field Data. Int. J. Greenh. Gas Control 87, 121–133.
Leifer, I., and Judd, A. (2015). The UK22/4b Blowout 20 Years on: Investigations of Continuing Methane Emissions from Sub-seabed to the Atmosphere in a North Sea Context. Mar. Petroleum Geol. 68, 706–717. doi:10.1016/j.marpetgeo.2015.11.012
Leifer, I. (2015). Seabed Bubble Flux Estimation by Calibrated Video Survey for a Large Blowout Seep in the North Sea. Mar. Petroleum Geol. 68, 743–752. doi:10.1016/j.marpetgeo.2015.08.032
Lepper, J., Rambow, D., and Röhling, H. G. (2013). “Lithostratigraphie des Buntsandstein in Deutschland. Deutsche Stratigraphische Kommission,” in Stratigraphie von Deutschland, XI. Buntsandstein.–Schriftenr. Editors Koordination und Redaktion, J. Lepper, and H.-G. Röhling für die Subkommission Perm-Trias (German: Deutsche Gesellschaft für Geowissenschaften), 69, 69–149.
Linke, P., and Haeckel, M. (2018). RV POSEIDON Fahrtbericht/Cruise Report POS518: Baseline Study for the Environmental Monitoring of Subseafloor CO2 Storage Operations, Leg 1: Bremerhaven–Bremerhaven (Germany) 25.09.-11.10. 2017, Leg 2: Bremerhaven–Kiel (Germany) 12.10.-28.10. 2017.
Løseth, H., Gading, M., and Wensaas, L. (2009). Hydrocarbon Leakage Interpreted on Seismic Data. Mar. Petroleum Geol. 26 (7), 1304–1319.
Løseth, H., Wensaas, L., Arntsen, B., Hanken, N. M., Basire, C., and Graue, K. (2011). 1000 M Long Gas Blow-Out Pipes. Mar. Petroleum Geol. 28 (5), 1047–1060.
McGinnis, D. F., Schmidt, M., DelSontro, T., Themann, S., Rovelli, L., Reitz, A., et al. (2011). Discovery of a Natural CO2 Seep in the German North Sea: Implications for Shallow Dissolved Gas and Seep Detection. J. Geophys. Res. Oceans 116 (C3). doi:10.1029/2010jc006557
McNutt, M. K., Camilli, R., Crone, T. J., Guthrie, G. D., Hsieh, P. A., Ryerson, T. B., Savas, O., and Shaffer, F. (2012). Review of Flow Rate Estimates of the Deepwater Horizon Oil Spill. Proc. Natl. Acad. Sci. U.S.A. 109 (50), 20260–20267. doi:10.1073/pnas.1112139108
Mingram, B., Hoth, P., and Harlov, D. E. (2003). Nitrogen Potential of Namurian Shales in the North German Basin. J. Geochem. Explor. 78-79, 405–408. doi:10.1016/s0375-6742(03)00044-x
Müller, S., Arfai, J., Jähne-Klingberg, F., Bense, F., and Weniger, P. (2020). Source Rocks of the German Central Graben. Mar. Petroleum Geol. 113, 104120. doi:10.1016/j.marpetgeo.2019.104120
Müller, S., Reinhardt, L., Franke, D., Gaedicke, C., and Winsemann, J. (2018). Shallow Gas Accumulations in the German North Sea. Mar. Petroleum Geol. 91, 139–151.
Nichols, R. J., Sparks, R. S. J., and Wilson, C. J. N. (1994). Experimental Studies of the Fluidization of Layered Sediments and the Formation of Fluid Escape Structures. Sedimentology 41 (2), 233–253. doi:10.1111/j.1365-3091.1994.tb01403.x
Niemann, H., Elvert, M., Hovland, M., Orcutt, B., Judd, A., Suck, I., Gutt, J., Joye, S., Damm, E., Finster, K., and Boetius, A. (2005). Methane Emission and Consumption at a North Sea Gas Seep (Tommeliten Area). Biogeosciences 2 (4), 335–351. doi:10.5194/bg-2-335-2005
NOU (NORGES OFFENTLIGE UTREDNINGER) (1986). Ukontrollert utblåsing på boreplattformen West Vanguard 6. Oktober 1985: Rapport fra granskningskommisjonen.
Ottesen, D., Dowdeswell, J. A., Rise, L., and Bugge, T. (2012). Large-scale Development of the Mid-Norwegian Shelf over the Last Three Million Years and Potential for Hydrocarbon Reservoirs in Glacial Sediments. Geol. Soc. Lond. Spec. Publ. 368 (1), 53–73. doi:10.1144/sp368.6
Reddy, C. M., Arey, J. S., Seewald, J. S., Sylva, S. P., Lemkau, K. L., Nelson, R. K., Carmichael, C. A., McIntyre, C. P., Fenwick, J., Ventura, G. T., Van Mooy, B. A. S., and Camilli, R. (2012). Composition and Fate of Gas and Oil Released to the Water Column during the Deepwater Horizon Oil Spill. Proc. Natl. Acad. Sci. U.S.A. 109 (50), 20229–20234. doi:10.1073/pnas.1101242108
Rocha, L. A. S. (1993). Mechanisms of Crater Formation while Drilling a Well. Doctoral dissertation. Baton Rouge, LA: Louisiana State University and Agricultural & Mechanical College.
Römer, M., Wenau, S., Mau, S., Veloso, M., Greinert, J., Schlüter, M., et al. (2017). Assessing Marine Gas Emission Activity and Contribution to the Atmospheric Methane Inventory: A Multidisciplinary Approach from the Dutch Dogger Bank Seep Area (North Sea). Geochem. Geophys. Geosystems 18 (7), 2617–2633. doi:10.1002/2017GC006995
Schneider von Deimling, J., Linke, P., Schmidt, M., and Rehder, G. (2015). Ongoing Methane Discharge at Well Site 22/4b (North Sea) and Discovery of a Spiral Vortex Bubble Plume Motion. Mar. Petroleum Geol. 68, 718–730. doi:10.1016/j.marpetgeo.2015.07.026
Schneider von Deimling, J. S., Greinert, J., Chapman, N. R., Rabbel, W., and Linke, P. (2010). Acoustic Imaging of Natural Gas Seepage in the North Sea: Sensing Bubbles Controlled by Variable Currents. Limnol. Oceanogr. Methods 8 (5), 155–171.
Schneider von Deimling, J. S., Rehder, G., Greinert, J., McGinnnis, D. F., Boetius, A., and Linke, P. (2011). Quantification of Seep-Related Methane Gas Emissions at Tommeliten, North Sea. Cont. Shelf Res. 31 (7-8), 867–878. doi:10.1016/j.csr.2011.02.012
Schout, G., Hartog, N., Hassanizadeh, S. M., and Griffioen, J. (2018). Impact of an Historic Underground Gas Well Blowout on the Current Methane Chemistry in a Shallow Groundwater System. Proc. Natl. Acad. Sci. U.S.A. 115 (2), 296–301. doi:10.1073/pnas.1711472115
Thatje, S., Gerdes, D., and Rachor, E. (1999). A Seafloor Crater in the German Bight and its Effects on the Benthos. Helgol Mar. Res. 53 (1), 36–44. doi:10.1007/pl00012136
Thatje, S., and Gerdes, D. (1997). The Benthic Macrofauna of the Inner German Bight: Present and Past. Archives Fish. Mar. Res. 45 (2), 93–112.
Unnithan, V., and Rossi, A. P. (2018). Enigmatic Holocene Sand Ridges: Complex Meandering to Anastomosing Bedforms in the North Sea (German Seabight). Geo-Mar Lett. 38 (5), 417–428. doi:10.1007/s00367-018-0543-9
Van Dalfsen, W., Doornenbal, J. C., Dortland, S., and Gunnink, J. L. (2006). A Comprehensive Seismic Velocity Model for the Netherlands Based on Lithostratigraphic Layers. Neth. J. Geosciences 85 (4), 277–292. doi:10.1017/s0016774600023076
Vielstädte, L., Karstens, J., Haeckel, M., Schmidt, M., Linke, P., Reimann, S., et al. (2015). Quantification of Methane Emissions at Abandoned Gas Wells in the Central North Sea. Mar. Petroleum Geol. 68, 848–860. doi:10.1016/j.marpetgeo.2015.07.030
Waage, M., Serov, P., Andreassen, K., Waghorn, K. A., and Bünz, S. (2020). Geological Controls of Giant Crater Development on the Arctic Seafloor. Sci. Rep. 10 (1), 8450–8512. doi:10.1038/s41598-020-65018-9
Keywords: blowout, figge maar, seafloor crater, focused fluid flow, drilling accident, sediment trap
Citation: Karstens J, Schneider von Deimling J, Berndt C, Böttner C, Kühn M, Reinardy BTI, Ehrhardt A, Gros J, Schramm B, Klaeschen D, Elger J, Haeckel M, Schmidt M, Heinrich S, Müller P and Bense F (2022) Formation of the Figge Maar Seafloor Crater During the 1964 B1 Blowout in the German North Sea. Earth Sci. Syst. Soc. 2:10053. doi: 10.3389/esss.2022.10053
Received: 31 January 2022; Accepted: 12 May 2022;
Published: 23 June 2022.
Edited by:
Folarin Kolawole, BP America, United StatesReviewed by:
Craig Magee, University of Leeds, United KingdomKevin Meazell, Independent Researcher, New York City, NY, United States
Copyright © 2022 Karstens, Schneider von Deimling, Berndt, Böttner, Kühn, Reinardy, Ehrhardt, Gros, Schramm, Klaeschen, Elger, Haeckel, Schmidt, Heinrich, Müller and Bense. This is an open-access article distributed under the terms of the Creative Commons Attribution License (CC BY). The use, distribution or reproduction in other forums is permitted, provided the original author(s) and the copyright owner(s) are credited and that the original publication in this journal is cited, in accordance with accepted academic practice. No use, distribution or reproduction is permitted which does not comply with these terms.
*Correspondence: Jens Karstens, jkarstens@geomar.de