
How Earth System Models Can Inform Key Dimensions of Marine Food Security in the Alaskan Arctic
 Georgina A. Gibson1*,
  Hajo Eicken1, Henry P. Huntington2, Clara J. Deal1, Olivia Lee1, Katherine M. Smith3, Nicole Jeffery3 and Josephine-Mary Sam1,4
- 1International Arctic Research Center, University of Alaska Fairbanks, Fairbanks, AK, United States
- 2Huntington Consulting, Eagle River, AK, United States
- 3Los Alamos National Laboratory, Los Alamos, NM, United States
- 4College of Rural and Community Development, University of Alaska Fairbanks, Fairbanks, Alaska
The Arctic is home to several groups of Indigenous Peoples, each with distinct ways of interacting with their environment and ways of life. Arctic, Indigenous Peoples’ food sovereignty is tightly linked with food security. Subsistence harvesting activities provide nutritious and culturally vital foods for Alaska Native households and communities. Climate change is causing rapid and more unpredictable shifts in environmental conditions that impact three of the key aspects of food security, availability, stability, and accessibility. While communities monitor the abundance and health of food webs and environments as part of subsistence harvest practices, anticipating major transformations and changes in these systems is challenging. We explored the potential of Earth System Model output in helping anticipate or project physical or ecosystem changes relevant to Alaska Indigenous peoples’ food security needs. Through examples of model products, that provide measures of accessibility and availability of marine resources, we show that modern models, such as the Energy Exascale Earth System Model presented here, can provide estimates of a broad suite of variables relevant to food security. We investigate how Earth System Model output could contribute to exploring questions related to aspects of Arctic food security such as accessibility and availability and highlight present model shortcomings that, if addressed, would move Earth System Models closer to being a useful tool for understanding environmentally driven changes to the availability and accessibility of harvestable food resources. Our example model-derived food security indicators illustrate how Earth System Model output could be combined with relevant, non-model, information sources; These model products are meant only as a starting point and a tool for engaging community members and to present, in an accessible way, the model’s potential utility, or current lack thereof, to rights holders and stakeholders concerned about food security. We are hopeful that with example products in hand, additional model development efforts will have a higher likelihood of success in achieving an iterative discussion with stakeholders regarding feasible and desired products.
Introduction
Arctic and sub-Arctic marine ecosystems provide essential services to Indigenous Peoples and communities in the region (Inuit Circumpolar Council-Alaska (ICCA, 2015; Nuttall, 2007), and support some of the richest commercial fisheries in the northern hemisphere (Hoel, 2018). With the Arctic experiencing some of the greatest rates of environmental change anywhere (Smith et al., 2015; Moon et al., 2019; Rantanen et al., 2022), the impact of marine ecosystem changes on food security, defined as having physical, social, and economic access to sufficient, safe, and nutritious food that meets an individual’s and community’s food preferences and dietary needs for an active and healthy life (CFS, 2009), is receiving increasing attention. In the Arctic, Indigenous Peoples’ food sovereignty is tightly linked with food security (ICCA, 2020). As one example of an international response to this situation, with reduced sea-ice cover and ocean warming driving a northward shift in fish species and fisheries (Fauchald et al., 2021), sustainability concerns have prompted the ratification of a Central Arctic Ocean Fisheries Agreement (CAOFA) by the Arctic coastal states, Japan, Republic of South Korea, China and the European Union. The CAOFA, in effect for 16 years with the option for renewal, takes a precautionary approach with a moratorium on commercial fishing in the Arctic (Vylegzhanin et al., 2020).
The CAOFA, consistent with many national, regional, and local efforts, also calls for studies to help predict longer-range changes and inform future management regimes. The processes relevant to food security associated with changing marine ecosystems are coupled in nature, and various ecosystem and climate models attempt to capture these processes and the Arctic system more generally. This contribution explores the potential utility of Earth System Models (ESMs) in informing long-range planning and broader assessments in support of sustaining or even enhancing Arctic food security, including assessments such as those being called for by the CAOFA. Of particular interest is the ability of models to capture physical and biological processes and changes that affect the functioning of Arctic social-environmental systems, and the services they provide to Indigenous Peoples and communities in the region.
Arctic Indigenous Peoples and Food Security
The Arctic is home to several groups of Indigenous Peoples, each with distinct ways of interacting with their environment and ways of life (Huntington et al., 2005). Subsistence harvesting activities provide nutritious and culturally vital foods for Alaska Native households and communities. Many communities have a mixed subsistence and cash-based economy with residents undertaking both paid and unpaid employment, such as participating in a community-based commercial fishery as well as harvesting food through hunting, fishing, herding, and gathering (Poppel and Kruse, 2009). Traditional foods, including salmon, arctic char, seal, whales, walrus, shellfish, birds, eggs, polar bear, muskox, caribou, seaweed, roots, and berries are widely consumed and are a highly valued component of the diet—not only for nutrition, but for cultural, economic, and spiritual sustenance (Goldhar et al., 2010). Food security has long been a concern in the Arctic (ICCA, 2015). However, the Indigenous communities that make up the Arctic Indigenous homeland span several countries (Canada, Russia, United States, Finland, Sweden, and Norway) and have different economic and policy positions so not all communities will be affected equally by external pressures and changes to the food supply chain. For example, 61% of Inupiat Inuit in Alaska perceive that they harvest half or more of their meat and fish while only 36% of communities in Greenland do (Poppel and Kruse, 2009). 13% of Alaskan households face food insecurity; the most affected are in rural communities among Alaska’s Native Peoples (Fall, 2018). Regardless of the community differences, the rapidly increasing fuel prices, extreme weather events, pollution by contaminants, and a reduction in the global level of cereal stocks that have increased the risk of food insecurity globally (United Nations Environment Programme (UNEP, 2007) are exacerbated in the Arctic, and ramifications will require responses at the local, regional and pan-Arctic scale.
Alaskan Arctic communities are reliant on marine resources from the relatively shallow, productive continental shelves for a significant portion of their diet. During the summer, the formation of a near-shore band of brackish water provides an important feeding area for both anadromous and marine species of fish (Craig, 1984). In winter, the formation of landfast sea ice provides important habitat for marine animals and extends community access from the shore. Although Indigenous community members may travel up to ∼146 km (90 miles) out to sea in small boats to reach traditional fishing or hunting grounds (Kapsch et al., 2010), travel out beyond the coastal zone (by small boat in open water or by foot or snow machine over ice) can be dangerous and logistically challenging. Thus, community members in the marine Arctic primarily interact with the Arctic coastal zone, the interface between the terrestrial and marine environments, typically averaging 50 km (∼30 miles) from their home base, for marine resource harvests (Druckenmiller et al., 2013; Galginaitis, 2013).
People’s lives depend on an accurate sense of when and where it is safe to hunt and fish. Indigenous knowledge relevant to survival has been refined and passed down through generations (Huntington et al., 2005) for just this purpose. However, climate change is causing rapid and more unpredictable shifts in environmental conditions that impact key aspects of food security. The Alaska Inuit food security conceptual framework (ICCA, 2015) provides a platform for understanding the factors that contribute to Indigenous food security and direction for the information needed to assess food security. The framework’s guiding principle is that food security is dependent on the stability of six dimensions; Availability, Inuit Culture, Decision-Making Power and Management, Health and Wellness, Stability and Accessibility. Of these six dimensions, three are directly tied to climate change: availability, stability, and accessibility. More erratic weather, including stronger winds and more frequent storms, make travel and hunting more difficult and dangerous by boat in summer; and the later ice freeze-ups, earlier ice break-ups, and thinner ice make it harder and more dangerous to secure traditional ice-associated harvests (Meakin and Kurvits, 2009; Papatsie et al., 2013; Ford et al., 2023). In addition to changing ice and ocean conditions, shifts in the timing, location, or productiveness of harvestable resources compound the problem (Huntington et al., 2005). The impacts of climate change are felt in small communities throughout the circumpolar north (UNEP, 2007). Formerly safe travel routes have become insecure (Inuit Circumpolar Council-Canada, ICCC (2008) and Indigenous hunters speak of thinning sea ice that makes hunting much more difficult and dangerous (Brown and McDavid, 2022), In 2014, two sequential years of low sea ice and failed walrus hunts meant emergency food assistance had to be shipped to the communities of Gambell, Savoonga, Diomede, and Wales (Struzik, 2016). Community members have also started catching species considered new to an area, e.g., salmon instead of Arctic char (Ashford and Castleden, 2001; Brubaker et al., 2010), and additional changes to subsistence catch are predicted (Steiner et al., 2019). Of particular importance are major, ecosystem-wide transformations that impact communities in a specific region, and have the potential to substantially disrupt food security and livelihoods. The recent displacement of pelagic fish stocks with the loss of winter Bering Sea ice and failures of subsistence salmon fisheries along the Yukon River highlights the need for proactive management of resources important from a food security perspective (Prewitt and McFarland, 2021).
Earth-System Modeling and Long-Range Projections
In light of rapid environmental change, Arctic communities need to develop adaptation strategies based on their current understanding of food and water security and cultural factors (Rautio and Natcher, 2016; Kettle et al., 2018). Local and traditional knowledge has been relied on by communities for centuries to millennia to understand the location, timing, and seasonal variability of food availability throughout the Arctic (ICCA, 2015). This wealth of knowledge has evolved and is actionable in the sense that it is directly tied to harvest practices and benefits derived from environmental systems. At the same time, Indigenous knowledge holders have recognized that upcoming seasons are becoming more likely to look different than previous years, with Inuit experts commenting, for example, on changes in the persistence of weather patterns (Weatherhead et al., 2010). Even in the context of rapid climate change, Arctic communities have demonstrated a significant ability to adapt; however, research integrating projections of future climatic and socio-economic change is needed to help overcome drivers of vulnerability and barriers to adaptation (Ford et al., 2015). For communities to make informed decisions they need access to information on likely changes and pressures to their food supply. Lack of decision-support and long-term planning tools could limit resource managers’ and Indigenous resource users’ ability to make changes to regulatory regimes or make infrastructure improvements responsive to future needs. Quantitative indicators of food security in the Arctic over time could be a valuable contribution to the decision-making toolbox of rightsholders and resource managers, and help inform policy change in response to rapid climate change. However, it is logistically challenging to consistently monitor and measure useful environmental and biological properties and these methods only provide rough estimates for short-term predictions. For these reasons, it is worth exploring the potential utility of ESMs, which explicitly simulate the atmosphere, ocean, sea, ice, and land surface and the movement of carbon through the Earth system, in contributing to assessments of food security.
The tight coupling between different components in the Earth system (i.e., terrestrial, marine, and cryosphere) makes understanding the key drivers of the marine ecosystem and its resources a challenge; ESMs can be useful in this regard. Within the last decade, ESM development has been moving forward at a rapid pace (i.e., Kawamiya et al., 2020), and such models have been demonstrated to be useful in understanding ocean-ecosystem-climate connections (Gibson et al., 2020; Jeffery et al., 2020; Gibson G. A. et al., 2022) and providing medium and long-range projections. While models can provide all sorts of output on a wide range of time and space scales, they have historically been used to provide simple predictions of the environment (i.e., temperature, salinity, or ice cover) and of the ecosystem (i.e., chl-a concentration) within each model grid cell. Model output from ESMs is also usually provided in the form of notoriously large, relatively inaccessible files. While it is useful for researchers to understand the ecosystem dynamics of a region, and how they change on a daily to multi-decadal timescale, this type of generic model output is not usually conveyed to community members and if it were, while potentially interesting, it likely would not be considered useful or actionable for making decisions about their food security. Indigenous and local knowledge, on the other hand, may comprise an intrinsic understanding of connections between different components of Arctic environmental systems. Unlike narrowly focused process studies or domain-specific models, ESMs have the potential to quantify the broader connections between the different Arctic ecosystem components.
Models cannot provide output relating in any way to the cultural and spiritual aspects of food security. As expressed clearly in the series of reports compiled by Indigenous experts by ICC-Alaska (ICCA, 2015; 2020) multiple dimensions of Indigenous food security and food sovereignty are outside the purview of scientific research. At the same time, the availability or accessibility of food resources are dimensions of food security for which ESMs may be able to provide related metrics. If they prove useful, information from model predictions or projections could be considered by Indigenous community members when planning for their future food security, or when developing annual Federal subsistence fishing regulations, i.e., 36 CFR 242 and 50 CFR 100 (FSMP, 2021) and State statutes and administrative regulations (ADFG, 2022a) that control the harvest policies which impact local communities. Current regulatory frameworks are not designed to address unprecedented rates of environmental change and their contributions to Indigenous food insecurity. ESM output may provide policy-relevant insights into drivers and consequences of transformational change across different Earth system domains. As part of the Interdisciplinary Research for Arctic Coastal Environments (InteRFACE; DOE, 2021) project, here we examine the ability of ESM model output to contribute information useful for understanding the broader food security landscape important to Alaska’s Indigenous people. Examples of model products that capture measures of accessibility and availability of marine resources in the Alaskan Arctic are developed and methods of communicating model predictions of environmental variables that could impact food security in ways that could be meaningful to Alaska Arctic community stakeholders are presented. The potential utility of such metrics for Indigenous or northern communities would need to be evaluated by decision-makers and community members but these examples illustrate the current model’s utility and could be used to initiate and bolster the success of discussions with Alaskan Arctic rights holders and stakeholders.
Methods
The E3SM Model
To explore an ESM-derived understanding of Arctic system processes to food security, we use the output from the Energy Exascale Earth System Model (E3SM v1) which was introduced and described by Golaz et al. (2019). Details of the biogeochemistry configuration of the model, E3SMv1.1-BGC, can be found in Jeffery et al. (2020) and Burrows et al. (2020). Here we use output from the fully-coupled, global, historical simulation (referred to as HIST-forcing in Jeffery et al. (2020) and BDRD-hist in Burrows et al. (2020) with active land, sea ice, ocean, river, and atmosphere components. Atmospheric greenhouse gases and aerosols follow prescribed historical pathways detailed in Golaz et al. (2019). The sea ice-ocean models are run on the MPAS (Model for Prediction Across Scales) unstructured mesh with grid spacing ranging from 60 km in the midlatitudes to 30 km in the equatorial and polar regions. In brief, the ocean biogeochemistry is modified from the Biogeochemical Elemental Cycling (BEC) model (Moore et al., 2001; Moore et al., 2004) and adapted to fully integrate with the physical ocean model (MPAS-O, Ringler et al., 2013) and includes four key phytoplankton functional groups (diatoms, diazotrophs, Phaeocystis sp., and small phytoplankton), a single zooplankton group, and two detrital pools. The zooplankton “grazes” on each of the phytoplankton groups, as well as the large particulate detritus, and has been parameterized to encompass the actions of both the microzooplankton and larger zooplankton. The explicitly simulated nutrients include carbon, nitrogen, phosphorous, iron, and silica. The sea ice biogeochemistry module includes three types of ice algae (diatoms, small algae, and Phaeocystis sp.), nitrate, ammonium, silicate, dissolved iron, and dissolved organic matter. The exchange between the marine and sea ice BGC modules occurs at every timestep.
Variables With Potential Links to Food Security
In assessing the value of E3SM output for quantifying drivers and threats to food security, we recognize two fundamental challenges. First, food security is best defined by the constituents, i.e., the individuals, communities, and groups that seek to achieve food security. Linking such community-defined concepts to externally applied approaches to support food security requires a collaborative framework and a good fit between information needs and assessment tools. For example, the ICCA recognizes six dimensions of food security, with 58 associated drivers of food insecurity (ICCA, 2015). Community collaboration and guidance will be required to link specific model parameters to such drivers and tie into broader Indigenous food security frameworks. Here we seek to support these broader efforts by providing a perspective on the type of information that can be obtained from ESMs. Such information is also relevant as Arctic research and data/information user communities identify core variables, e.g., “essential ocean variables” or “shared Arctic variables” (Bradley et al., 2021; Starkweather et al., 2021; Biermann et al., 2022) for observing systems to track.
The second fundamental challenge is that the E3SM model, and probably any other model, does not presently have the capability of simulating all of the variables that could be of use in assessing different processes or phenomena relevant to food security. For example, the model does not produce a measure of higher trophic level biomass (i.e., mammals, fish), let alone provide measures of the success of individual groups (i.e., ringed seals, white fish, etc.). However, the model does simulate variables that may serve as useful proxies for key processes or indicators. For example, primary production and zooplankton biomass could be a proxy for the likely success of higher trophic levels and the harvest potential if the harvest were resource-limited. Environmental variables, i.e., sea surface temperatures or salinity, could be proxies to delineate fish spawning areas, and the timing of spawning relative to phytoplankton blooms (Asch et al., 2019). Likewise, while we cannot yet simulate the presence of invasive species we can simulate the water temperature which is increasing the northward range of invasive species into the Arctic. Further, environmental stressors such as marine heat waves could be a proxy for the health of fish and marine mammal populations (Boveng et al., 2020; Suryan et al., 2021). To arrive at potentially useful model products, we first developed a short list of environmental and biological factors that have the potential to impact food access, availability, and stability in the Arctic (Table 1), guided in part by the ICCA food security framework. Not all of the food security assessment criteria (ICCA, 2015) can be addressed by examining single model variables; some of the more complex criteria will require the development of compound indices/maps that provide a broader picture of the food security environment. The specific metrics that will be of most value will likely vary by community. Thus, discussion with individual communities would be required in order to develop model products that reflect community-specific food security interests.
TABLE 1
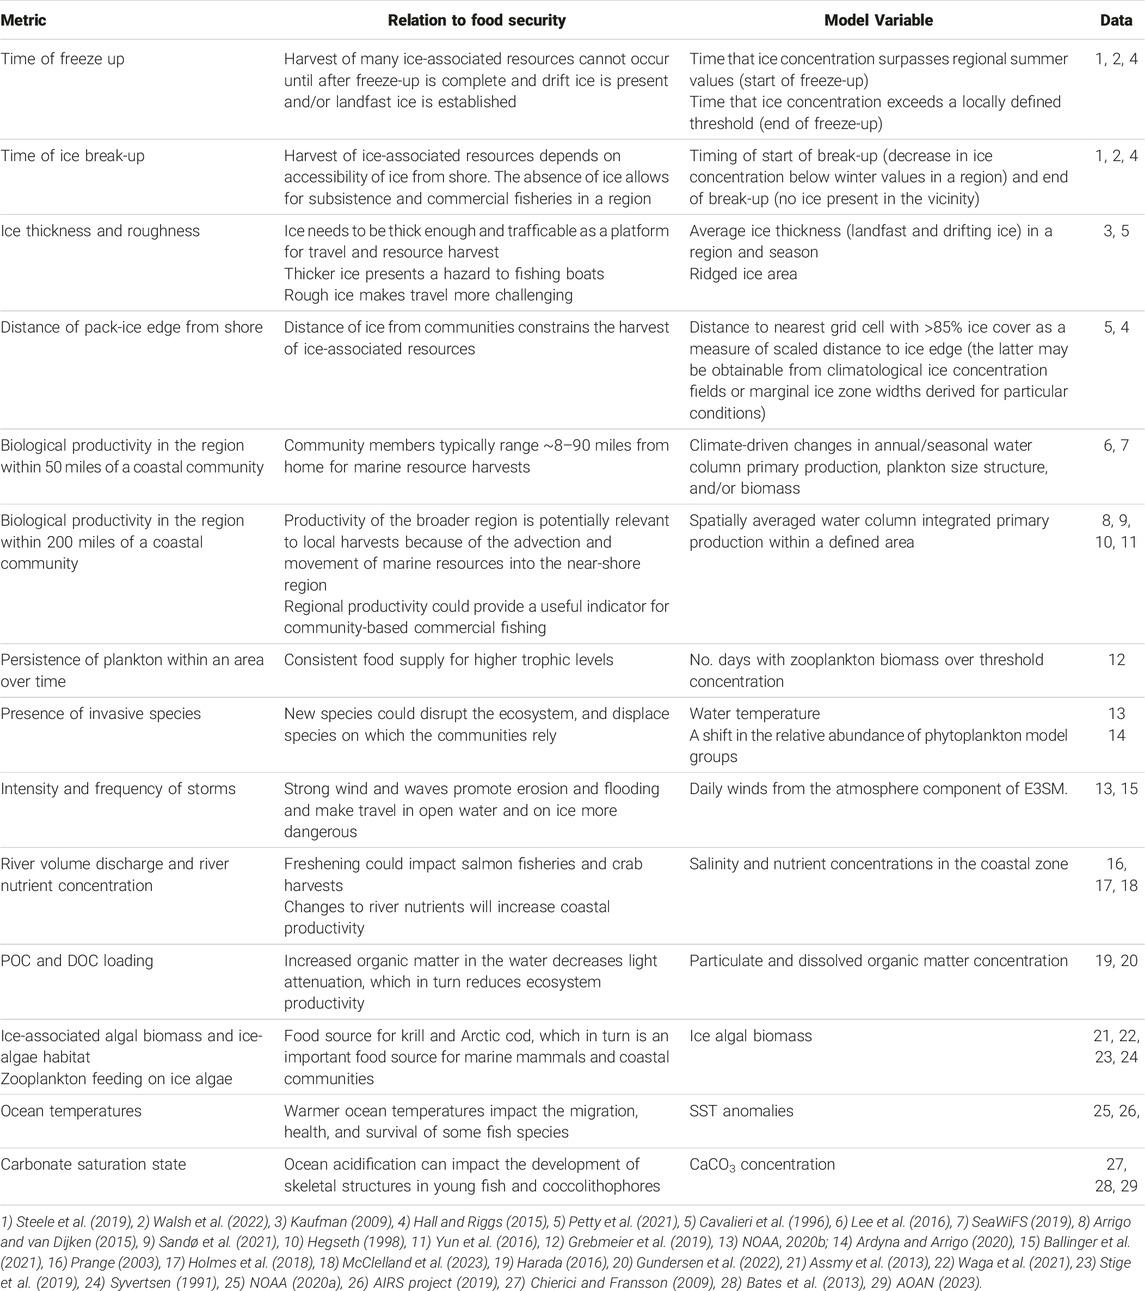
TABLE 1. Metrics of physical and biological properties that could impact accessibility and availability dimensions of food security in the marine Arctic, the candidate model variable, and identification of relevant observational data-sets.
Analysis
Community Level Analysis
Food, energy, and water security are complex and vary among communities in rural Alaska – reflecting local circumstances (Schmidt et al., 2022). For our exploration of model utility in assessing environmental factors relevant in a food security context we focus on two Alaskan Arctic communities—Utqiaġvik and Point Hope—which are approximately 313 miles (∼500 km) apart, and not connected by road. While both of these communities lie on the Northern Alaskan coast and have a relatively high percentage of marine harvest in their diets, the diets of community members are known to differ, as is the local marine environment adjacent to the villages which is fundamentally controlled by transport in the Alaska Coastal Current (ACC).
The ACC is identified as low salinity, warmer water in the upper layer (Woodgate and Aagaard, 2005) that originates in the Gulf of Alaska. After flowing through the Bering Strait, the ACC flows northwards through the Chukchi Sea before branching. The northerly branch flows through Kotzebue Sound continuing along the coast of Alaska past Point Hope, and Icy Cape to Point Barrow (Kindle, 1909; Weingartner et al., 2005; Lin et al., 2019) —See Grebmeier et al., 2006 cf. Figure 1 for the location of the ACC and key landmarks. The northerly flow varies in strength but has speeds of ∼40 cm/sec past Point Hope (Gong and Pickart, 2015). When the ACC reaches Barrow Canyon it becomes swift (>80 cm s−1, Gong and Pickart (2015)) and narrow (∼40 km, Itoh et al. (2013), Winsor and Chapman (2004)) and has a strong easterly component as it flows past Utqiaġvik (Weingartner et al., 2005). Although the ACC tends to be relatively nutrient-poor (Mordy et al., 2005), upwelling in Barrow Canyon, driven by strong northeasterly winds (Pickart et al., 2013), brings warm nutrient-rich Atlantic water onto the shelf near Utqiaġvik (Beaird et al., 2020; Li et al., 2022).
Point Hope, located at 68.3°N 166.8°W at the northwestern end of the Lisburne Peninsula, on the Chukchi Sea coast, has no road or rail connections to the outside world and must be accessed by sea or by air. Point Hope is surrounded by the Chukchi Sea on three sides but the near-shore waters are relatively shallow, reaching depths of only 60 feet up to five miles from the shore (Brubaker et al., 2010). Sea ice can be present from October to early July (Brubaker et al., 2010). The Point Hope population was estimated to be 893 (USCB, 2022) as of the 2022 census. Life in Point Hope revolves around the harvest of marine mammals including walrus (Huntington and Quakenbush, 2013), seal, and, most importantly, whale (Brubaker et al., 2010), but char, grayling, chum salmon, and caribou are also important components of the community’s diet (ADFG, 2017; Braem et al., 2017).
Located further north at 71.3°N, 156.8°W, between the Chukchi Sea and the Beaufort Sea, Utqiaġvik is the largest city in Alaska’s North Slope Borough. At the 2020 census (USCB, 2022) Utqiaġvik’s population was estimated to be 5212 with village residents primarily identifying as Iñupiat. Community members rely on bowhead whales, caribou, broad whitefish, bearded seals, Arctic cisco, and sockeye salmon for their diet (Brown et al., 2014; ADFG, 2017). Seal and whale hunting take place in the highly dynamic open lead region beyond the shorefast ice zone, where ice fragments move loosely (George et al., 2004). Beyond the lead is the outer realm of the ice pack, a region of variable, high-velocity currents and constantly shifting sea ice that is not considered stable enough as a platform for marine mammal hunting camps. In the northern Chukchi Sea, hunters regard this zone as particularly dangerous and rarely venture here to hunt while off of Little Diomede Island in the Bering Strait hunters are skilled at hunting and traveling in this zone (George et al., 2004).
Accessibility and Availability Indices Potentially Relevant to Food Security
Drawing on the broader framework of key dimensions of food security for Inuit in Arctic Alaska, developed by ICCA (2015), we explore indices related to the accessibility and availability of marine food sources. Because community members are logistically restricted in the distance they can travel from the shore out into the marine environment, we initially developed a set of localized analysis regions. Our indices include model output from grid cells that are within 50 miles of the village center of Utqiaġvik and Point Hope (Figure 1). Because the Arctic is dynamic the environment close to the community centers will also be impacted by advective processes as well as fish and mammal movement into the inshore areas. Thus, we additionally computed indices for slightly broader regions, 100 and 200 miles from the community centers. Finally, our analysis was extended to the more expansive Beaufort and Chukchi Sea regions to provide context for our community-level analysis.
FIGURE 1
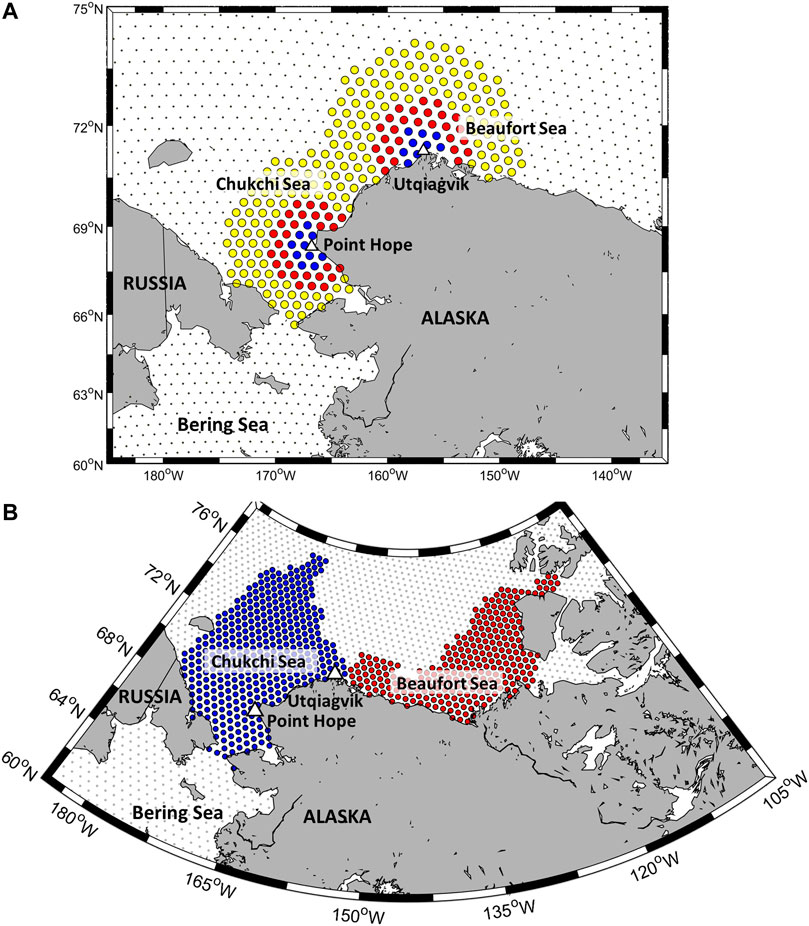
FIGURE 1. (A) Location of ocean model grid cells in E3SM-v1 (colored dots) and location of Point Hope and Utqiaġvik native villages on the Alaskan Arctic coast. The color of the grid cells indicates their distance from the community centers, i.e., ≤50 miles (blue), 50–100 miles (red), 100–200 miles (yellow), and ≥200 miles (grey). (B) Grid cells utilized in the development of Beaufort Sea indices are shown in red and grid cells utilized in the development of Chukchi Sea indices are in blue.
Monthly model output for 1900–2006, a 107 year period, was used in this analysis. For each community-centered and regional index, model output (i.e., surface temperature, integrated primary production, ice area, ice volume, and ice roughness) was extracted from grid cells corresponding to each region.
Ice area in each grid cell was determined as:
And ice thickness was computed as:
For each year of the times series, ice variables were averaged over the region and for the 3 month period March-May, while SST and primary production were averaged over the summer months (June-August).
To further qualify the ice environment surrounding the Arctic communities we developed two additional variables. IceMeltTime, defined as the first month that regionally averaged IceFraction falls below 0.5 each year, to provide a measure of breakup timing. IceEdgeDist, defined as the minimum distance to a grid cell with an IceFraction>0.3, provides a measure of the distance from the village center to the ice edge. Preliminary analysis found this variable to have its largest deviation in distance from Point Hope in June, while the distance to the ice edge from Utqiaġvik had the largest deviation in August. As such, we use these site-specific time periods in our analysis.
Once the monthly and spatially averaged time series for each variable had been developed (i.e., Figure 2), assuming a normal distribution, we calculated the 25, 50, and 75 percentiles for the 107 year time series and determined if the variable quantity each year was below the 25 percentile (i.e., a below average year), above the 75 percentile (i.e., an above average year), or within the 25–75 percentile range (an average year) i.e.,
FIGURE 2
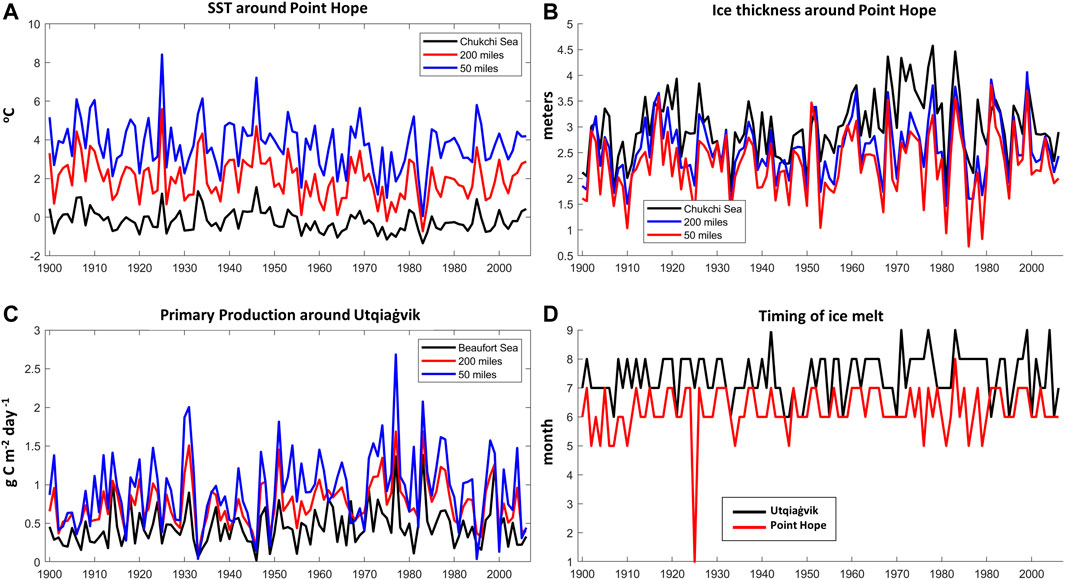
FIGURE 2. Examples of regional environmental indices developed from E3SM-v1. (A) Regionally averaged SST at various distances from the community of Point Hope, (B) Regionally averaged ice thickness at various distances from the community of Point Hope, (C) Regionally averaged primary production at various distances from the community of Utqiaġvik, and (D) timing of ice breakup around Point Hope and Utqiaġvik.
Model Products
The value of ESM approaches derives from their ability to account for interconnected processes across different Earth system domains and the potential role of such linkages in amplifying the magnitude and rate of change. Such insights are distinct from the prediction of a given variable for a specific time period. Below we illustrate sample model products developed from the raw coupled E3SM model output. These products are meant as a starting point and a tool for engaging community members in discussions on further product development and not as real-world predictions. Figure 3 summarizes key environmental indices for the 107 year analysis period. This type of graphic representation makes it easy to see, at a glance, if variables of interest are at, above, or below their averages in any given year. For example, in model year 1946, both Point Hope and Utqiaġvik are predicted to have above-average temperatures, below-average ice area, and early ice melt. Yet, while Point Hope has below-average primary production and ice thickness, these properties are predicted to be of average levels at Utqiaġvik. In 1986, Point Hope is predicted to be colder than average while temperatures at Utqiaġvik are average. Both communities are predicted to experience above-average ice area, later ice melt, and above-average production. The ice around Point Hope is predicted to be thicker yet smoother, while these qualities are average at Utqiaġvik. In 1989, both Point Hope and Utqiaġvik are predicted to have relatively low ice area and primary production even though Point Hope is colder than average with thicker ice and later ice melt while Utqiaġvik has an average temperature, thinner ice, and earlier ice melt. In addition to gaining an understanding of how changes in each variable the model predicts relate to each other, this type of data visualization also allows us to see trends within the model predictions. For example, if we consider the last two decades of the time series (1986–2006) we can see that relative to the 107-year mean, Point Hope was predicted to have 3 years that were cooler than average and 6 years with lower than average production. Over the same time period, twelve of the years could be considered cooler than normal around Utqiaġvik; ten of the years had lower than average production. While many more comparisons can be made, these examples illustrate that we can discern notable differences in the community-centered model projections, even though the community centers are within relatively close proximity. Note also that it would be easy to adjust the percentile ranges, and the years of interest, used to classify the variables as above or below average if community feedback indicates more relevant thresholds.
FIGURE 3
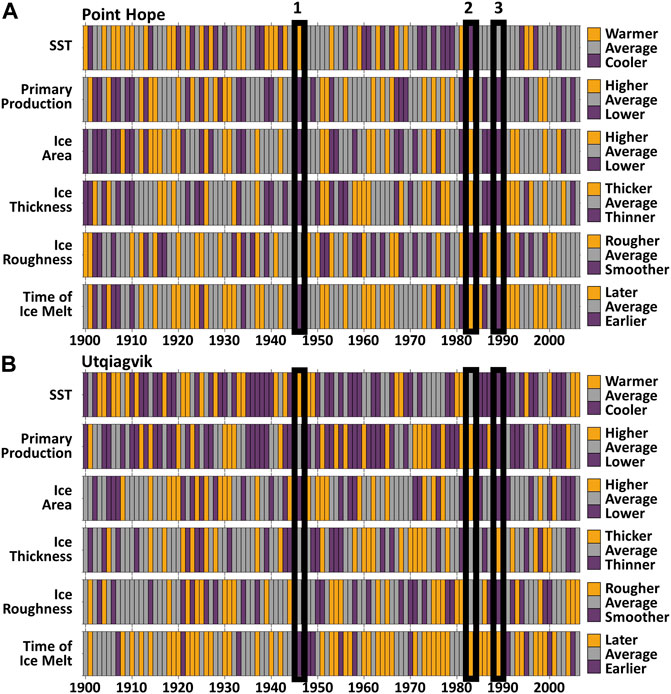
FIGURE 3. Comparison of indices for Point Hope (A) and Utqiaġvik (B), two communities in the Alaskan Arctic. Indices were computed using model data within 50 miles from the community center – see Figure 1. For ease of comparison between communities, 3 years have been highlighted in both sets of indices 1) 1946, 2) 1983, and 3)1989. Metrics were computed for the full 107 year time series (1900–2006).
Comparing indices developed at varying distances from the community centers (i.e. 50 miles from Utqiaġvik, 200 miles from Utqiaġvik, and Beaufort Sea and Chukchi Sea wide) we can see that the different scales of analysis identify similar, but not identical, environmental patterns (Figure 4). For example, in 1992 modeled simulated ice thickness was above average at all scales examined while primary production was simulated to be below average at all but the Chukchi wide scale. For 1998, the simulated sea ice thickness is considered below average at the 50 and 100-mile scale but average at the broader, sea-wide scales. In this year, primary production was above average at the 50 to 200-mile distance scales from the village center and the Chukchi Sea scale, but was below average for the Beaufort Sea. Considering broader trends over the 1985–2006 period, Figure 4 illustrates that Utqiaġvik experienced higher than average production approximately the same number of times (5–6) from nearshore (50-mile radius) out to the 200-mile radius. While this matched with the number of above-average years in the Beaufort Sea it was quite different to the adjacent Chukchi Sea which only had 2 years with above-average production during the same time period.
FIGURE 4
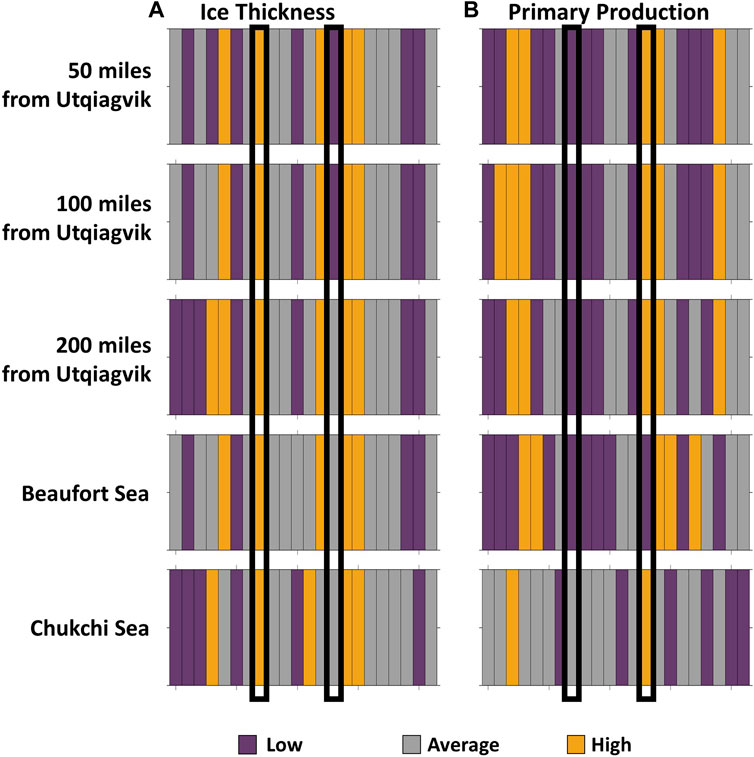
FIGURE 4. Comparison of modeled indices and trends for (A) Sea ice area and (B) Primary production at different distances from Utqiaġvik. 50 miles, 100 miles, and 200 miles from the community center, Beaufort Sea wide, and Chukchi Sea wide. For ease of comparison between varying scales, 2 years (1992 and 1998) have been highlighted in each set of indices. Metrics were computed for the full 107 year time series (1900–2006).
Using ice coverage threshold criteria identified by the Indigenous Knowledge Social Network, SIKU (SIKU. 2019), we can create maps of predicted ice coverage from the model output. This product illustrates the importance of considering both the ice thickness and coverage when quantifying the ice environment surrounding the community centers. For example, considering only modeled ice thickness (Figure 5A), both Point Hope and Utqiaġvik look to be surrounded by solid ice in May 2006. However, once the additional variable ‘fraction of ice coverage in a grid cell’ is considered we get a different picture which indicates that much of the water offshore from Point Hope is water with ice rather than continuous or very dense ice cover (Figure 5Bi). Contrasting this compound variable to another year (May 1983, Figure 5Bii) we see that there are years in which the model predicts Point Hope would be surrounded by continuous or very dense ice cover.
FIGURE 5
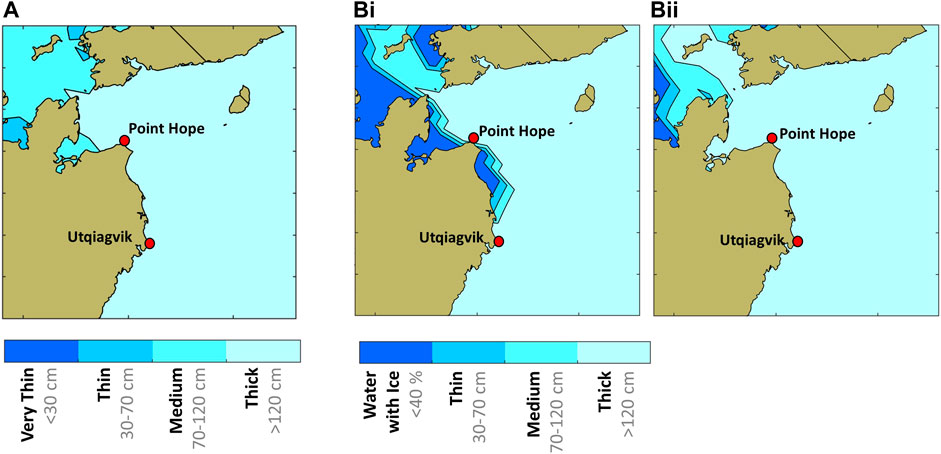
FIGURE 5. Example of modeled ice thickness and coverage simulated by E3SM-v1. (A) Monthly average sea ice thickness in May 2006 (A) and Composite metric showing monthly average sea ice thickness and regions where ice coverage was <40% in May 2006 (Bi) and May 1983 (Bii). The locations of the Point Hope and Utqiaġvik communities are shown for reference.
When examining the shortest distance to the edge of the pack ice we found that there was insufficient variability in predicted distance to be able to develop indices analogous to those presented for the other ice variables. For example, the minimum distance from Point Hope to the ice edge was either 14.0 miles or 33.8 nautical miles (Figure 6A), while the minimum distance to the ice edge from Utqiaġvik was slightly more variable depending on the month and year (Figure 6B) and ranged from 11.6 to 50.8 nautical miles. This illustrates one of the shortcomings of the ESM’s fixed grid cell locations as the distance from land to ice features is likely a lot more nuanced than the model can capture.
FIGURE 6
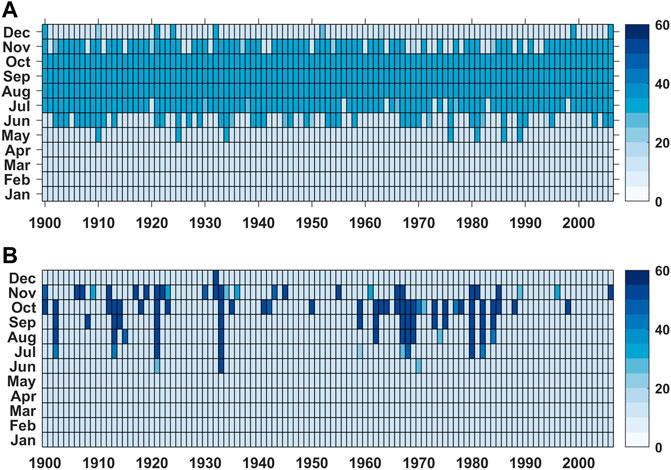
FIGURE 6. Shortest distance to the ice edge from Point Hope (A) and Utqiaġvik (B) with edge presence defined as a grid cell with >30% ice coverage.
We can argue that primary production provides a good proxy for the overall productivity of the environment on a seasonal and annual basis given that it is the base of the food chain that supports higher trophic, harvestable levels. However, there are also many kinds of food resources that the communities may rely on that cannot currently be approximated from ESM output. The state of the physical environment, i.e., ice trafficability and the productivity of the waters accessible to a community are not the only factors that will influence their food security. Another major factor in access to harvestable resources is gas prices, required for transport. To illustrate how model-derived indices could help in assessing community food security we present our model-derived indices with measures derived from external sources (Figure 7). It is important to note that, as this is a fully coupled model, predictions for individual years do not correspond with real years. However, the model can provide information about how possible food security metrics are related, for example, years with high surface temperature anomalies may be correlated with low sea ice concentration anomalies and increases or decreases in productivity. So, the model is used not just for prediction but for understanding. Examining this kind of information in the context of observations that link anomalous years of the same metrics with anomalies in fisheries/whaling data, for example, would make both information sources more useful. Our example, developed for Point Hope, shows that over the 1974–2006 simulation period underlying the interannual variability the model simulates a general warming in SST of approximately 1.3°C. During the same time period, simulated primary production within 50 miles of Point Hope decreased slightly (∼0.6 g C m−2) overall while ice thickness showed no notable trend.
FIGURE 7
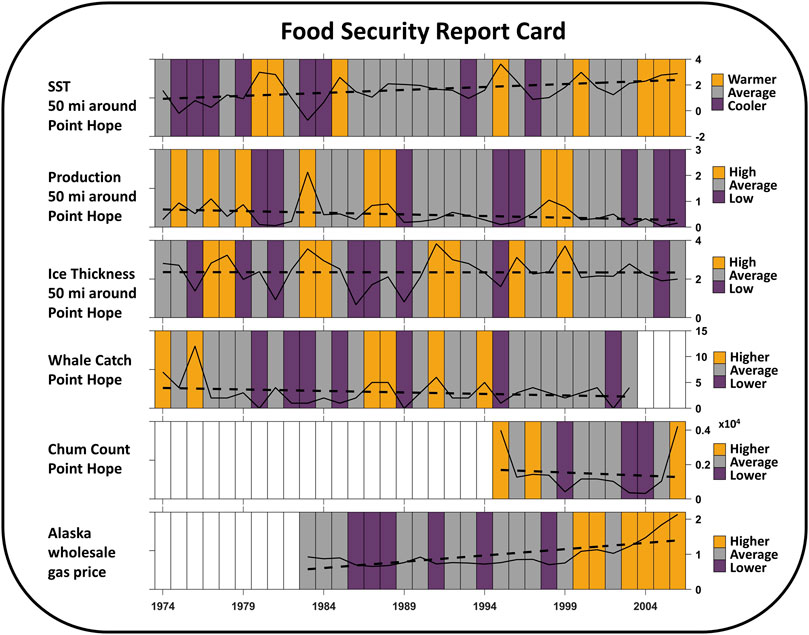
FIGURE 7. Combining simulated ecosystem metrics with other factors of food security to demonstrate the potential utility of model indices for developing a fuller picture of the food security environment. Metrics were computed for the 1974–2006 period. Trendlines and absolute values are also shown.
Observational data indicates that during this time period, whale catch (Suydam and George, 2004.) had a negative trend, although this is primarily due to the two above-average years (1974 and 1976) at the beginning of the time series. Chum counts (ADFG, 2022b) were only available from 1995 onwards and show large interannual variability with very high counts in 1995, 1997 and 2006. Gas prices appeared to have been relatively stationary from 1983 (first available data) until 1999 but then increased throughout the end of the time series (EIA, 2010). Our set of food security indicators makes it easy to collectively examine modeled and observed variables associated with food security and the extent to which broad modeled trends (e.g., decline in sea ice) match outcomes community members may be interested in (e.g., chum counts).
Discussion
The definition of food security is not universal but, at least in the United States, it is often defined through availability (production, distribution, exchange), accessibility (purchasing power), and utilization (nutritional value; ICCA, 2014). Defining food security for Indigenous communities includes additional complexity because tradition and culture often also play an important role, and access is impacted by property rights and allocations (Bennett et al., 2018). 58% of Alaska Natives live in rural areas (Goto et al., 2004) and 13% of Alaskan households are facing food insecurity (Walch et al., 2018). While there is now a broad range of research on climate change in Alaska, there are very few studies that directly measure the environmental impact on Alaskan food security (Walch et al., 2018) or describe how it might change in the future. As part of the InteRFACE project (DOE, 2021), we addressed the challenge of connecting ESM output to Indigenous peoples’ food security needs. Through examples of model products, that provide measures of accessibility and availability of marine resources, we demonstrate how ESMs output could contribute towards addressing Arctic food security and highlight present shortcomings that, if addressed, would move ESMs closer to being a useful tool for understanding environmentally driven changes to the availability and accessibility of harvestable food resources.
The ICCA (2015) conceptual framework on how to assess food security from an Alaska Inuit perspective includes many aspects of food security that ESMs cannot provide output on, i.e., cultural and spiritual. However, ESMs can provide a holistic understanding of Arctic ecosystem dynamics and useful metrics on the availability or accessibility of food resources. Historical observations and traditional environmental knowledge are valuable for putting contemporary observations into context but in general, long, uninterrupted datasets of environmental conditions in the vicinity of Indigenous communities are exceedingly scarce, if they exist at all. Here we have illustrated how multi-decadal time series of environmental model estimates could be used to quantify the relationship between environmental and biological variables and presented a way to visualize trends in the model output. In the absence of reanalysis or data assimilation to constrain model projections (Penny et al., 2019), fully coupled atmosphere-ocean ESMs, such as the E3SM discussed here, can capture observed trends (Flato et al., 2013) but can only be expected to capture observed patterns in environmental variables in a broad statistical sense. While model estimates for a particular year should not be treated as actionable, the increase/decrease in the number of years a variable is projected to be above or below the long-term mean could be valuable. Understanding if current or future years are more or less likely to be similar to conditions in years past will allow rights holders and stakeholders to put current or future years into the context of historical years. Environmental conditions will likely continue to only provide one of the limitations to successful harvests along with a multitude of other factors such as local weather, availability of reliable transport, and time available to participate in a hunt. For example, Huntington et al. (2013) found that while physical environmental factors play a larger role in determining whether the communities of Savoonga and Gambell hunted, the resulting hunting efficiency was more dependent on effort than physical factors, with effort alone explaining 63% and 59% of the harvest in the respective communities. Regardless, community access to information on the present and future environmental conditions, that could be interpreted in the context of past conditions and harvests, could be powerful.
The communities that make up the Arctic Indigenous homeland span several countries (Canada, Russia, United States, Finland, Greenland, Sweden, and Norway) and have different economic and policy positions so will not all be affected equally by external pressures and changes to the food supply chain (Poppel and Kruse, 2009). This means that to be truly useful model outputs need to be tailored to communities’ specific needs. In addition to being long and uninterrupted, model output has the advantage that it can be queried for specific variables and seasons with carefully chosen baseline years. This flexibility allows the tailoring of model products to address individual community needs. Even with the coarse horizontal scale of the global E3SM model, which has a nominal model resolution over the Arctic of ∼25 miles, notable differences were seen between our community-centered metrics, illustrating that the model can capture geographic differences even though the villages examined are only separated by a few hundred miles.
Huntington et al. (2021) have previously suggested that while models may seem unusable in the near term they could be useful in long-term planning. In this vein, we argue that despite the impracticality of using ESM output to make short-term (days-week) decisions our model products could be very useful in understanding and planning for longer-term changes. By enabling environmental observations to be put into a broader context, information from model projections could prove invaluable when developing longer-term policies and regulations, in particular, if impacted communities find them of value to supplement and support their efforts in developing policy and achieving food sovereignty. For example, understanding how observed changes to sea ice are part of a much longer, i.e., decadal, trend that is predicted to continue could support communities in their efforts to achieve food sovereignty that is aligned with past Indigenous stewardship of marine resources. At a more practical level, it remains to be explored whether such information can also help support planning and decision-making on large transport equipment purchases, the location of new permanent structures, the relocation of hunting grounds, the identification of new promising times for hunting or fishing seasons, or identification of times when industrial activity should be avoided to minimize disturbance to a resource and the hunters. Decision-makers and planners will require a measure of model uncertainty (Gibson G. A. et al., 2022). This has been done for the E3SM without active biogeochemistry in Golaz et al. (2019) where a standard set of simulations from the Coupled Model Intercomparison Project was performed and analyzed. The model was found to reproduce global and regional climate features well compared to observations, although with a slight temperature bias. Most ESMs contain biases of varying degrees for one or more variables for both historical and projection runs, and models do not always agree with each other with respect to the direction of projected change (i.e., Vancoppenolle et al., 2013). Thus, individual model representations may not be adequate to make actionable decisions that would impact communities and livelihoods and the development of indices would have to be based on output from multi-model ensembles.
Modern models, such as the E3SM, can provide estimates of a broad suite of variables relevant to food security. In particular, ESMs are relatively skilled in simulating physical variables related to the accessibility of marine resources surrounding a community including ice cover, ice thickness, and ice roughness. An advantage of computer model simulations is the three-dimensional, Arctic-wide picture of the environment they can provide which extends to locations and times when it is dangerous or impractical to take measurements. The spatial maps of ice quantity and quality that we developed here are analogous to those presently in use by SIKU, the Indigenous Knowledge Social Network (SIKU, 2019) utilizing their thresholds identified for ice thickness. If validated, and implemented at an appropriate scale, these relatively inexpensive model products could eventually be used in conjunction with the observational maps provided by SIKU contributors to create a broader picture of the ice environment trends.
Fully-coupled ESMs are valuable tools for understanding and projecting the environmental impacts of climate change in the Arctic, as regional trends and patterns are the result of both local processes and non-local large-scale modes of variability (IPCC, 2021). However, it must be emphasized that though ESMs may well represent the intrinsic spatial patterns, seasonality, and long-term trends of observed modes, the phases of these modes in any given simulation will not necessarily correspond with the historical record. So, while ESMs could be useful for long-term community planners and policymakers real-time use of such model-derived products by Arctic stakeholders, to guide short -term future harvesting activities, would likely only become possible if they were derived from regionally refined, high-resolution, models that assimilated observations. Ideally, ESM simulations of the environment would be of a fine enough resolution and sufficient accuracy that community members could use predictions of ice quality (coverage and thickness), or biological production to decide where/when the ice was safe to travel, and where the most productive areas will be. This is not the current reality as the resolution (∼1°), model-inherent uncertainty, and availability of the model output make it currently unsuitable for real-time decision making, i.e., by a hunter deciding where and when to hunt based on ice conditions. Due to the relatively coarse resolution of the model grid currently used for E3SM simulations, we found that the model is presently not well suited to provide useful measurements of the distance from community centers to the ice edge. Such important and short-term decisions such as if or where to hunt today require quite fine-scale knowledge of conditions that change on an hourly-weekly timescale. ESM outputs can be generated on a user-defined timescale but, due to file size and storage limitations, the standard output of ice conditions is usually at a monthly resolution while predictions of biological production are often daily. With a finer resolution model grid, that had more closely spaced grid cells, ice coverage could become a useful predictive variable. However, for daily decision-making, Arctic stakeholders would need now-cast models that could run a short distance into the future and with a resolution of <1 km. While increased accuracy will likely occur in the future we believe that it is unlikely ESMs will get to a resolution fine enough for location or movement-based decisions.
Representation of BGC variables in E3SM is relatively complex including four phytoplankton variables (small phytoplankton, diatoms, diazotrophs, and phaeocystis), a zooplankton variable, and multiple nutrient variables (iron, calcium carbonate, dissolved organic and inorganic phosphorus, carbon, oxygen, silicate and nitrogen). However, as is the case for other ESMs, E3SM does not currently provide direct estimates of harvestable resources, i.e., fish or mammals that community members would hunt. By simulating primary production and the primary and secondary biomass that support higher trophic levels, E3SM can provide a measure of the overall productivity of the system as well as its spatial variability, both of which are important to the success of higher-trophic levels. While the E3SM model can simulate, with reasonable skill, the daily, seasonal, and annual cycles of phytoplankton production and biomass on a regional sea-wide scale (Gibson et al., 2020), higher trophic-level organisms have more complex behaviors and life cycles that span multiple years so they present a much greater challenge. The success of harvestable resources is often dependent on multiple successful years of access to food (production). Marine resources that are accessible from Arctic villages may only arrive in those locations briefly each year or could move into/out of a system to feed. Thus, while E3SM predictions of productivity can be useful in understanding the timing of productive regions with respect to accessibility from the community center, a more complete understanding of life history dynamics of things that the communities hunt would require providing the lower trophic level information from the ESM model to other types of models, e.g., species distribution and stock assessment models. Three separate models for vegetation and soil layers, permafrost, and vegetation succession and wildfire disturbance were recently combined to make an Integrated Ecosystem Model (IEM) for Alaska and northwest Canada with the goal of providing managers with more accurate projections of future landscape conditions (Euskirchen et al., 2020.). A similar approach, combining models that address various marine resources, i.e., suites of models that link ESMs and regional models through ecosystem models, fish distribution model to economic model (i.e., Punt et al., 2015; Steiner et al., 2019), could also be feasible.
Recently Schmidt et al. (2022) applied the Food–Energy–Water (FEW) assessment framework (Biggs et al., 2015) that examines four components of security – availability, accessibility, quality, and preference to interview community members to gauge their perception of security. Through the development of our model indicators for food security, we have demonstrated that model outputs can be combined with other information relevant to food security – the hope being that this will provide an additional tool for communication. Schmidt et al. (2022) found that the cost of fuel, required for travel to harvest, was the most mentioned external issue impacting community perception of food security thus we included this index in our example set of food security indicators to illustrate how the model output could be combined with relevant non-model information sources. Estimates of a community’s disposable income could also be an informative factor to include as an indicator of their ability to purchase gas, and as a measure of access to external, non-subsistence, food sources. However, demands on income will vary widely by community, and within the community, and the availability of such data is limited. Our indicators were loosely based on the ecosystem report cards used by federal groundfish management in Alaska as an ecosystem approach to fisheries management. In this instance, the report cards help establish an ecosystem context within which deliberations on fisheries quotas can occur (Zador et al., 2017). To be useful, the food security indicators would need to reflect each community’s needs and concerns. Engaging the Arctic indigenous community members in any further development of model-derived food security indicators would be critical in the identification of the most important or limiting factors impacting each village.
Euskirchen et al. (2020) reported difficulty in eliciting input from land and resource managers at the early conceptual stage – without products from the model simulations to demonstrate benefits to managers. Our data products are meant as a starting point and tool for engaging community members and to present, in an accessible way, the potential utility, or current lack thereof, to stakeholders who are working to address their own food security. We have demonstrated ways in which we believe voluminous model output can be communicated in a useful, easy-to-understand manner. By distilling information about multiple metrics, including model predictions, to a set of food security indicators, we believe our approach could eventually provide stakeholders with a tool for informed mid to long-term decision-making. During product development, we discussed developing combined metrics so that we could provide a measure of ‘good/bad’ time periods concerning a community’s food security. However, we ultimately determined that it was not appropriate or helpful for someone external to each community to make these decisions. Thick ice may be considered beneficial by one community (i.e., because of the improved access it provides) but bad by another community – perhaps because of reduced access to fishing grounds. To be useful, food security indicators would have to be personalized for each community and harvest activity and developed in conjunction with community members. At this juncture, comparing what community members remember about the environment in certain years with respect to computed model indices would be interesting. It may be that what people remember does not agree with the model output. This in itself would not necessarily indicate a failure of the model as these two measures of the environment are operating on very different spatiotemporal scales. Such comparisons would still be very valuable in helping define model products and in steering future model development. We are hopeful that with example products in hand future model and information development efforts would be more successful in achieving an iterative discussion with stakeholders concerning feasible and desired products.
Data Availability Statement
Publicly available datasets were analyzed in this study. This data can be found here: E3SM Project, DOE. Energy Exascale Earth System Model v1.0. Computer Software. https://github.com/E3SM-Project/E3SM/releases/tag/v1.0.0. 23 April 2018. Web. doi: 10.11578/E3SM/dc.20180418.36.
Author Contributions
GG: Funding acquisition, Conceptualization, Methodology, Investigation, Formal analysis. Visualization, Writing- Original draft preparation, Project administration. HE: Funding acquisition, Conceptualization, Methodology, Writing- Original draft preparation. HH: Writing- Original draft preparation. CD: Methodology, Writing- Original draft preparation. OL: Methodology, Writing- Original draft preparation. KS: Methodology, Writing- Original draft preparation. NJ: Methodology, Writing- Original draft preparation. J-MS: Methodology, Writing- Original draft preparation. All authors contributed to the article and approved the submitted version.
Funding
This research was funded as part of the Interdisciplinary Research for Arctic Coastal Environments (InteRFACE) project through the Department of Energy, Office of Science, Biological and Environmental Research Earth and Environment Systems Sciences Division’s Regional and Global Model Analysis (RGMA) program. Awarded under contract grant: #89233218CNA000001 to Triad National Security, LLC (Triad). The funder was not involved in the study design, collection, analysis, interpretation of data, the writing of this article, or the decision to submit it for publication.
Conflict of Interest
Author HH was employed by the company Huntington Consulting.
The remaining authors declare that the research was conducted in the absence of any commercial or financial relationships that could be construed as a potential conflict of interest.
Publisher’s Note
All claims expressed in this article are solely those of the authors and do not necessarily represent those of their affiliated organizations, or those of the publisher, the editors and the reviewers. Any product that may be evaluated in this article, or claim that may be made by its manufacturer, is not guaranteed or endorsed by the publisher.
References
ADFG (2017). “Community Subsistence Information System.” Alaska Department of Fish and Game. Available at: http://www.adfg.alaska.gov/sb/CSIS/ (Accessed February 17, 2023).
ADFG (2022a). 2022 – 2023 Statewide Subsistence and Personal Use Fishing Regulations. Anchorage, AK: Alaska Department of Fish and Game.
ADFG (2022b). Eldorado River Historical Cumulative Daily Passage of Chum Salmon. Escapement Monitoring Inseason and Historical Data. Norton Sound & Kotzebue Management Area Commercial Salmon Fisheries. Juneau, AK: Alaska Department of Fish and Game. Available at: https://www.adfg.alaska.gov/index.cfm?adfg=commercialbyareanortonsound.salmon_escapement (Accessed August 3, 2022).
AIRS project (2019). “Aqua/AIRS L3 Daily Support Product (AIRS-Only) 1 Degree X 1 Degree V7.0.”. Greenbelt, MD, USA: Goddard Earth Sciences Data and Information Services Center. doi:10.5067/ENI8HFAJE9CH
AOAN (2023). Alaska OA Data List and Links. Alaska Ocean Acidification Network. Available at: https://aoan.aoos.org/alaska-oa-data-list-and-links/ (Accessed March 3, 2023).
Ardyna, M., and Arrigo, K. R. (2020). Phytoplankton Dynamics in a Changing Arctic Ocean. Nat. Clim. Chang. 10, 892–903. doi:10.1038/s41558-020-0905-y
Arrigo, K. R., and van Dijken, G. L. (2015). Continued Increases in Arctic Ocean Primary Production. Prog. Oceanogr. 136, 60–70. doi:10.1016/j.pocean.2015.05.002
Asch, R. G., Stock, C. A., and Sarmiento, J. L. (2019). Climate Change Impacts on Mismatches Between Phytoplankton Blooms and Fish Spawning Phenology. Glob. Change Biol. 25 (8), 2544–2559. doi:10.1111/gcb.14650
Ashford, G., and Castleden, J. (2001). Inuit Observations on Climate Change Final Report. Sachs Harbour, Northwest Territories: International Institute for Sustainable Development. Available at: https://www.iisd.org/publications/report/inuit-observations-climate-change-final-report (Accessed July 20, 2021).
Assmy, P., Ehn, J. K., Fernández-Méndez, M., Hop, H., Katlein, C., Sundfjord, A., et al. (2013). Floating Ice-Algal Aggregates Below Melting Arctic Sea Ice. PLoS ONE 8 (10), e76599. doi:10.1371/journal.pone.0076599
Ballinger, T. J., Walsh, J. E., Bhatt, U. S., Bieniek, P. A., Tschudi, M. A., Brettschneider, B., et al. (2021). Unusual West Arctic Storm Activity During Winter 2020: Another Collapse of the Beaufort High? Geophys. Res. Lett. 48, e2021GL092518. doi:10.1029/2021GL092518
Bates, N. R., Orchowska, M. I., Garley, R., and Mathis, J. T. (2013). Summertime Calcium Carbonate Undersaturation in Shelf Waters of the Western Arctic Ocean – How Biological Processes Exacerbate the Impact of Ocean Acidification. Biogeosciences 10, 5281–5309. doi:10.5194/bg-10-5281-2013
Beaird, N. L., Shroyer, E. L., Juranek, L. W., Hales, B., and Goñi, M. A. (2020). Nutrient-Rich Gravity Current Formed by Upwelling in Barrow Canyon: High-Resolution Observations. J. Geophys. Res. Oceans 125, e2020JC016160. doi:10.1029/2020JC016160
Bennett, N. J., Kaplan-Hallam, M., Augustine, G., Ban, N., Belhabib, D., Brueckner-Irwin, I., et al. (2018). Coastal and Indigenous Community Access to Marine Resources and the Ocean: A Policy Imperative for Canada. Mar. Policy 87, 186–193. doi:10.1016/j.marpol.2017.10.023
Biermann, M., Rudolf, M., Buschman, V. Q., Chythlook, C., Eicken, H., and Starkweather, S. (2022). Supporting Arctic Food Sovereignty Through Sustained, Coordinated Observations of Arctic Change. Witn. Arct. 30 (August). Available at: https://www.arcus.org/witness-the-arctic/2022/8/highlight/1 (Accessed February 17, 2023).
Biggs, E. M., Bruce, E., Boruff, B., Duncan, J. M. A., Horsley, J., Pauli, N., et al. (2015). Sustainable Development and the Water-Energy-Food Nexus: a Perspective on Livelihoods. Environ. Sci. Policy 54, 389–397. doi:10.1016/j.envsci.2015.08.002
Boveng, P. L., Ziel, H. L., McClintock, B. T., and Cameron, M. F. (2020). Body Condition of Phocid Seals During a Period of Rapid Environmental Change in the Bering Sea and Aleutian Islands, Alaska. Deep Sea Res. Part II Top. Stud. Oceanogr. 181, 104904. doi:10.1016/j.dsr2.2020.104904
Bradley, A., Eicken, H., Lee, O., Gebruk, A., and Pirazzini, R. (2021). Shared Arctic Variable Framework Links Local to Global Observing System Priorities and Requirements. ARCTIC 74 (5), 69–86. doi:10.14430/arctic76429
Braem, N. M., Mikow, E. H., and Kostick, M. L. (2017). “Chukchi Sea and Norton Sound Observation Network: Harvest and Use of Wild Resources in 9 Communities in Arctic Alaska 2012-2014,”. Technical Paper 403 (Fairbanks, AK: Alaska Department of Fish and Game, Division of Subsistence), 763.
Brown, C., and McDavid, B. (2022). The Harvest and Use of Wild Resources by Communities Within or Near Northern Alaska Parklands. Alaska Park Sci. 21 (1), 68–75. Available at: https://www.nps.gov/articles/000/aps-21-1-9.htm (Accessed February 17, 2023).
Brown, C. L., Braem, N. M., Kostick, M. L., Trainor, A., Slayton, L. J., Runfola, D. M., et al. (2014). “Harvests and Uses of Wild Resources in 4 Interior Alaska Communities and 3 Arctic Alaska Communities,”. Technical Paper 426 (Fairbanks, AK: Alaska Department of Fish and Game, Division of Subsistence).
Brubaker, M., Berner, J., Bell, J., Warren, J., and Rolin, A. (2010). Climate Change in Point Hope, Alaska, Strategies for Community Health. ANTHC Center for Climate and Health. Available at: http://www.anthc.org/chs/ces/climate/climateandhealthreports.cfm (Accessed August 24, 2001).
Burrows, S. M., Maltrud, M., Yang, X., Zhu, Q., Jeffery, N., Shi, X., et al. (2020). The DOE E3SM v1.1 Biogeochemistry Configuration: Description and Simulated Ecosystem-Climate Responses to Historical Changes in Forcing. J. Adv. Model. Earth Syst. 12, e2019MS001766. doi:10.1029/2019MS001766
Cavalieri, D. J., Parkinson, C. L., Gloersen, P., and Zwally, H. J. (1996). Sea Ice Concentrations From Nimbus-7 SMMR and DMSP SSM/I-SSMIS Passive Microwave Data, Version 1. Boulder, Colorado USA: NASA National Snow and Ice Data Center Distributed Active Archive Center. doi:10.5067/8GQ8LZQVL0VL
CFS (2009). “Reform of the Committee on World Food Security. Final Version, Rev.2” Committee on World Food Security, Thirty-Fifth Session, October 2009. Available at: http://www.fao.org/fileadmin/templates/cfs/Docs0910/ReformDoc/CFS_2009_2_Rev_2_E_K7197.pdf (Accessed February 17, 2023).
Chierici, M., and Fransson, A. (2009). Calcium Carbonate Saturation in the Surface Water of the Arctic Ocean: Undersaturation in Freshwater Influenced Shelves. Biogeosciences 6, 2421–2431. doi:10.5194/bg-6-2421-2009
Craig, P. C. (1984). Fish Use of Coastal Waters of the Alaskan Beaufort Sea: a Review. Trans. Am. Fish. Soc. 113 (3), 265–282. doi:10.1577/1548-8659(1984)113<265:fuocwo>2.0.co;2
DOE (2021). “Interface: Understanding Earth System Change Across Arctic Coastal Environments. Fact Sheet.” U.S. Department of Energy, Office of Biological And Environmental Research, Earth and Environmental System Modeling. Available at: https://climatemodeling.science.energy.gov/system/files/publications/attachments/InteRFACE.pdf (Accessed February 15, 2023).
Druckenmiller, M. L., Eicken, H., George, J. C., and Brower, L. (2013). Trails to the Whale: Reflections of Change and Choice on an Iñupiat Icescape at Barrow, Alaska. Polar Geogr. 36 (1–2), 5–29. doi:10.1080/1088937x.2012.724459
EIA (2010). Petroleum & Other Liquids. Alaska Regular Gasoline Wholesale/Resale Price by Refiners. U.S. Energy Information Administration. Available at: https://www.eia.gov/dnav/pet/hist/LeafHandler.ashx?n=PET&s=EMA_EPMR_PWG_SAK_DPG&f=M (Accessed 8 3, 2022).
Euskirchen, E. S., Timm, K., Breen, A. L., Gray, S., Rupp, T. S., Martin, P., et al. (2020). Co-Producing Knowledge: the Integrated Ecosystem Model for Resource Management in Arctic Alaska. Front. Ecol. Environ. 18 (8), 447–455. doi:10.1002/fee.2176
Fall, J. A. (2018). Subsistence in Alaska: A Year 2017 Update. Anchorage, Alaska: Alaska Department of Fish and Game. Available at: https://www.adfg.alaska.gov/static/home/subsistence/pdfs/subsistence_update_2017.pdf (Accessed February 17, 2023).
Fauchald, P., Arneberg, P., Debernard, J. B., Lind, S., Olsen, E., and Hausner, V. H. (2021). Poleward Shifts in Marine Fisheries Under Arctic Warming. Environ. Res. Lett. 16 (7), 074057. doi:10.1088/1748-9326/ac1010
Flato, G., Marotzke, J., Abiodun, B., Braconnot, P., Chou, S. C., Collins, W., et al. (2013). “Evaluation of Climate Models,” in Climate Change 2013: The Physical Science Basis. Contribution of Working Group I to the Fifth Assessment Report of the Intergovernmental Panel on Climate Change. Editors T. F. Stocker, D. Qin, G.-K. Plattner, M. Tignor, S. K. Allen, J. Boschunget al. (Cambridge, United Kingdom and New York, NY, USA: Cambridge University Press).
Ford, J., McDowell, G., and Pearce, T. (2015). The Adaptation Challenge in the Arctic. Nat. Clim. Change 5, 1046–1053. doi:10.1038/nclimate2723
Ford, J. D., Clark, D. G., Copland, L., Pearce, T., and Harper, S. L.IHACC Research Team (2023). Projected Decrease in Trail Access in the Arctic. Commun. Earth Environ. 4, 23. doi:10.1038/s43247-023-00685-w
FSMP. (2021). Management Regulations for the Harvest of Fish and Shellfish on Federal Public Lands and Waters in Alaska. Federal Subsistence Management Program. Available at: https://www.doi.gov/subsistence/fisheries (Accessed February 15, 2023).
Galginaitis, M. (2013). “Iñupiat Fall Whaling and Climate Change Observations From Cross Island,” in Responses of Arctic Marine Ecosystems to Climate Change. Alaska Sea Grant. Editors F. J. Mueter, D. M. S. Dickson, H. P. Huntington, J. R. Irvine, E. A. Logerwell, S. A. MacLeanet al. (Fairbanks, AK: University of Alaska Fairbanks). doi:10.4027/ramecc.2013.09
George, J. C., Huntington, H. P., Brewster, K., Eicken, H., Norton, D. W., and Glenn, R. (2004). Observations on Shorefast Ice Dynamics in Arctic Alaska and the Responses of the Iñupiat Hunting Community. Arctic 57 (4), 363–374. doi:10.14430/arctic514
Gibson, G. A., Baker, M., Stockhausen, W., Hinckley, S., Parada, C., Aydin, K., et al. (2022a). Modeling in an Integrated Ecosystem Research Framework to Explore Recruitment in Gulf of Alaska Groundfish – Applications to Management and Lessons Learned. Deep Sea Res. Part II 197, 105048. doi:10.1016/j.dsr2.2022.105048
Gibson, G. A., Elliott, S., Piliouras, A., Clement Kinney, J., and Jeffery, N. (2022b). Assessing the Potential Impact of River Chemistry on Arctic Coastal Production. Front. Mar. Sci. Coast. Ocean Process. 9. doi:10.3389/fmars.2022.738363
Gibson, G. A., Weijer, W., Jeffery, N., and Wang, S. (2020). Relative Impact of Sea Ice and Temperature Changes on Arctic Marine Production. J. Geophys. Res. Biogeosciences 125 (7). doi:10.1029/2019JG005343
Golaz, J.-C., Caldwell, P. M., Van Roekel, L. P., Petersen, M. R., Tang, Q., Wolfe, J. D., et al. (2019). The DOE E3SM Coupled Model Version 1: Overview and Evaluation at Standard Resolution. J. Adv. Model. Earth Syst. 11, 2089–2129. doi:10.1029/2018MS001603
Goldhar, C., Ford, J. D., and Berrang-Ford, L. (2010). Prevalence of Food Insecurity in a Greenlandic Community and the Importance of Social, Econmic and Environmental Stressors. Int. J. Circumpolar Health 69, 3. doi:10.3402/ijch.v69i3.17616
Gong, D., and Pickart, R. S. (2015). Summertime Circulation in the Eastern Chukchi Sea. Deep Sea Res. Part II Top. Stud. Oceanogr. 118 (Part A), 18–31. doi:10.1016/j.dsr2.2015.02.006
Goto, G. L., Irvin, G., Sherry, S., and Eberhart, K. (2004). Our Choices, Our Future: Analysis of the Status of Alaska Natives Report 2004. Anchorage, AK: Alaska Native Policy Center.
Grebmeier, J. M., Cooper, L. W., Feder, H. M., and Sirenko, B. I. (2006). Ecosystem Dynamics of the Pacific-Influenced Northern Bering and Chukchi Seas in the Amerasian Arctic. Prog. Oceanogr. 71, 331–361. doi:10.1016/j.pocean.2006.10.001
Grebmeier, J. M., Moore, S. E., Cooper, L. W., and Frey, K. E. (2019). The Distributed Biological Observatory: A Change Detection Array in the Pacific Arctic – An Introduction. Deep Sea Res. Part II Top. Stud. Oceanogr. 162, 1–7. doi:10.1016/j.dsr2.2019.05.005
Gundersen, K., Møgster, J. S., Lien, V. S., Ershova, E., Lunde, L. F., Arnesen, H., et al. (2022). Thirty Years of Nutrient Biogeochemistry in the Barents Sea and the Adjoining Arctic Ocean, 1990–2019. Sci. Data 9, 649. doi:10.1038/s41597-022-01781-w
Hall, D. K., and Riggs, G. (2015). MODIS/Terra Sea Ice Extent 5-Min L2 Swath 1km, Version 6. Boulder, Colorado USA: NASA National Snow and Ice Data Center Distributed Active Archive Center. doi:10.5067/MODIS/MOD29.006
Harada, N. (2016). Review: Potential Catastrophic Reduction of Sea Ice in the Western Arctic Ocean: Its Impact on Biogeochemical Cycles and Marine Ecosystems. Glob. Planet. Change 136, 1–17. doi:10.1016/j.gloplacha.2015.11.005
Hegseth, N. E. (1998). Primary Production of the Northern Barents Sea. Polar Res. 17 (2), 113–123. doi:10.1111/j.1751-8369.1998.tb00266.x
Hoel, A. H. (2018). “Northern Fisheries,” in The Routledge Handbook of the Polar Regions (New York, NY: Routledge), 391–402.
Holmes, R. M., Shiklomanov, A. I., Suslova, A., Tretiakov, M., McClelland, J. W., Spencer, R. G. M., et al. (2018). “River Discharge” in: Arctic Report Card 2018. Available at: https://arctic.noaa.gov/Report-Card/Report-Card-2018/ArtMID/7878/ArticleID/786/River-Discharge (Accessed January 17, 2023).
Huntington, H., Fox, S., Berkes, F., and Krupnik, I. (2005). “The Changing Arctic: Indigenous Perspectives,” in Arctic Climate Impact Assessment (Cambridge University Press), 61–98.
Huntington, H., Schmidt, J., Loring, P., Whitney, E., Aggarwal, S., Byrd, A., et al. (2021). Applying the Food–Energy–Water Nexus Concept at the Local Scale. Nat. Sustain. 4, 672–679. doi:10.1038/s41893-021-00719-1
Huntington, H. P., Noongwook, G., Bond, N. A., Benter, B., Snyder, J. A., and Zhang, J. (2013). The Influence of Wind and Ice on Spring Walrus Hunting Success on St. Lawrence Island, Alaska. Deep-Sea Res. II 94, 312–322. doi:10.1016/j.dsr2.2013.03.016
Huntington, H. P., and Quakenbush, L. T. (2013). “Traditional Knowledge Regarding Walrus Near Point Hope, Alaska.” Report to Native Village of Point Hope and Bureau of Ocean EnergyManagement for Contract #M09PC00027, 9.
ICCA (2014). “How to Assess the Arctic From an Inuit Perspective: Inuit Circumpolar Council-Alaska: Building a Conceptual Framework on How to Assess Food Security in the Alaska Arctic,” in Progress Report to the 2014 ICCC General Assembly, Geneva, Switzerland, 22 October 2013 –31 December 2013.
ICCA (2015). Alaskan Inuit Food Security Conceptual Framework: How to Assess the Arctic From an Inuit Perspective. Anchorage, AK: Inuit Circumpolar Council-Alaska. Available at: https://iccalaska.org/wp-icc/wp-content/uploads/2016/03/Food-Security-Summary-and-Recommendations-Report.pdf (Accessed January 17, 2023).
ICCA (2020). Food Sovereignty and Self-Governance: Inuit Role in Managing Arctic Marine Resources. Anchorage, AK: Inuit Circumpolar Council-Alaska.
ICCC (2008). “The Sea Ice Is Our Highway: An Inuit Perspective on Transportation in the Arctic.” a Contribution by ICC to the Arctic Council’s Arctic Marine Shipping Assessment, March 2008.
IPCC. (2021). “Annex IV: Modes of Variability,” in Climate Change 2021: The Physical Science Basis. Contribution of Working Group I to the Sixth Assessment Report of the Intergovernmental Panel on Climate Change, Editors: C. Cassou, A. Cherchi, Y. Kosaka, V. Masson-Delmotte, P. Zhai, A. Piraniet al. (Cambridge, United Kingdom and New York, NY, USA: Cambridge University Press), 2153–2192. doi:10.1017/9781009157896.018
Itoh, M., Nishino, S., Kawaguchi, Y., and Kikuchi, T. (2013). Barrow Canyon Volume, Heat, and Freshwater Fluxes Revealed by Long-Term Mooring Observations Between 2000 and 2008. J. Geophys. Res. Oceans 118, 4363–4379. doi:10.1002/jgrc.20290
Jeffery, N., Maltrud, M., Hunke, E., Wang, S., Wolfe, J., Turner, A., et al. (2020). Investigating Controls on Sea Ice Algal Production Using E3SMv1.1-BGC. Ann. Glaciol. 61 (82), 51–72. doi:10.1017/aog.2020.7
Kapsch, M. L., Eicken, H., and Robards, M. (2010). “Sea Ice Distribution and Ice Use by Indigenous Walrus Hunters on St. Lawrence Island, Alaska,” in SIKU: Knowing Our Ice (Dordrecht: Springer), 115–144.
Kaufman, M. (2009). Ground-Based Sea Ice Thickness Profiles. Arct. Data Cent. doi:10.18739/A2J678X1R
Kawamiya, M., Hajima, T., Tachiiri, K., Watanabe, S., and Yokohata, T. (2020). Two Decades of Earth System Modeling With an Emphasis on Model for Interdisciplinary Research on Climate (MIROC). Prog. Earth Planet. Sci. 64 (7), 64. doi:10.1186/s40645-020-00369-5
Kettle, N. P., Sam, J. M., Trainor, S. F., and Gray, G. T. (2018). “Supporting Climate Adaptation Planning in Northwest Alaska,” in Addressing Climate Change at the Community Level in the United States. Editors P. R. Lachapelle,, and D. E. Albrecht (New York, NY: Routledge), 215–231.
Kindle, E. M. (1909). Notes on the Point Hope Spit, Alaska. J. Geol. 17 (2), 178–189. doi:10.1086/621598
Lee, Y. J., Matrai, P. A., Friedrichs, M. A. M., Saba, V. S., Aumont, O., Babin, M., et al. (2016). Net Primary Productivity Estimates and Environmental Variables in the Arctic Ocean: An Assessment of Coupled Physical-Biogeochemical Models. J. Geophys. Res. Oceans 121, 8635–8669. doi:10.1002/2016JC011993
Li, S., Lin, P., Dou, T., Xiao, C., Itoh, M., Kikuchi, T., et al. (2022). Upwelling of Atlantic Water in Barrow Canyon, Chukchi Sea. J. Geophys. Res. Oceans 127, e2021JC017839. doi:10.1029/2021JC017839
Lin, P., Pickart, R. S., Moore, G. W. K., Spall, M. A., and Hu, J. (2019). Characteristics and Dynamics of Wind-Driven Upwelling in the Alaskan Beaufort Sea Based on Six Years of Mooring Data. Deep Sea Res. Part II Top. Stud. Oceanogr. 162, 79–92. doi:10.1016/j.dsr2.2018.01.002
McClelland, J. W., Tank, S. E., Spencer, R. G. M., Shiklomanov, A. I., Zolkos, S., and Holmes, R. M. (2023). “Arctic Great Rivers Observatory.” Water Quality Dataset. Available at: https://www.arcticgreatrivers.org/data (Accessed 01 03, 2023).
Meakin, S., and Kurvits, T. (2009). “Assessing the Impacts of Climate Change on Food Security in the Canadian Arctic.” Prepared by GRID-Arendal (Meakin, S. And Kurvits, T.) for Indian and Northern Affairs Canada. Available at: https://www.cakex.org/sites/default/files/GRID-Arendal_food.security.pdf (Accessed February 15, 2023).
Moon, T. A., Overeem, I., Druckenmiller, M., Holland, M., Huntington, H., Kling, G., et al. (2019). The Expanding Footprint of Rapid Arctic Change. Earth's Future 7 (3), 212–218. doi:10.1029/2018ef001088
Moore, J. K., Doney, S. C., Kleypas, J. A., Glover, D. M., and Fung, I. Y. (2001). An Intermediate Complexity Marine Ecosystem Model for the Global Domain. Deep Sea Res. Part II Top. Stud. Oceanogr. 49 (1–3), 403–462. doi:10.1016/s0967-0645(01)00108-4
Moore, J. K., Doney, S. C., and Lindsay, K. (2004). Upper Ocean Ecosystem Dynamics and Iron Cycling in a Global Three-Dimensional Model. Glob. Biogeochem. Cycles 18, GB4028. doi:10.1029/2004GB002220
Mordy, C. W., Stabeno, P. J., Ladd, C., Zeeman, S., Wisegarver, D. P., Salo, S. A., et al. (2005). Nutrients and Primary Production Along the Eastern Aleutian Island Archipelago. Fish. Oceanogr. 14, 55–76. doi:10.1111/j.1365-2419.2005.00364.x
NOAA (2020a). National Center for Environmental Information, Optimum Interpolation SST Version 2.1. Available at: https://www.ncei.noaa.gov/products/optimum-interpolation-sst (Accessed 2 3, 2003).
NOAA (2020b). National Center for Environmental Information, Storm Events Database Version 3.1. Available at: https://www.ncdc.noaa.gov/stormevents/ (Accessed 2 3, 2003).
Nuttall, M. (2007). “An Environment at Risk: Arctic Indigenous Peoples, Local Livelihoods and Climate Change,” in Arctic Alpine Ecosystems and People in a Changing Environment (Berlin, Heidelberg: Springer), 19–35.
Papatsie, L., Ellsworth, L., Meakin, S., and Kurvits, T. (2013). “The Right to Food Security in a Changing Arctic: the Nunavut Food Security Coalition and the Feeding My Family campaign,” in A New Dialogue: Putting people at the Heart of Global Development, Dublin, Ireland, 15-16 April 2013 (Irish Aid, Mary Robinson Foundation: Climate Justice CGIAR Research Program on Climate Change, Agriculture and Food Security (CCAFS) and World Food Programme), 4. doi:10.25607/OBP-1672
Penny, S. G., Akella, S., Balmaseda, M. A., Browne, P., Carton, J. A., Chevallier, M., et al. (2019). Observational Needs for Improving Ocean and Coupled Reanalysis, S2S Prediction, and Decadal Prediction. Front. Mar. Sci. 6, 391. doi:10.3389/fmars.2019.00391
Petty, A. A., Kurtz, N., Kwok, R., Markus, T., and Neumann, T. A. (2021). ICESat-2 L4 Monthly Gridded Sea Ice Thickness, Version 1. Boulder, Colorado USA: NASA National Snow and Ice Data Center Distributed Active Archive Center. doi:10.5067/CV6JEXEE31HF
Pickart, R. S., Schulze, L. M., Moore, G. W. K., Charette, M. A., Arrigo, K. R., van Dijken, G., et al. (2013). Long-Term Trends of Upwelling and Impacts on Primary Productivity in the Alaskan Beaufort Sea. Deep Sea Res. Part I Oceanogr. Res. Pap. 79, 106–121. doi:10.1016/j.dsr.2013.05.003
Poppel, B., and Kruse, J. (2009). “The Importance of a Mixed Cash- And Harvest Herding Based Economy to Living in the Arctic – An Analysis on the Survey of Living Conditions in the Arctic,” in Quality of Life and the Millennium Challenge. Editors V. Møller, and D. Huschka (Dordrecht: Springer). doi:10.1007/978-1-4020-8569-7_4
Prange, M. (2003). “Einfluss Arktischer Süßwasserquellen auf die Zirkulation im Nordmeer und im Nordatlantik in Einem Prognostischen Ozean-Meereis-Modell,” (Bremen, Germany: University of Bremen). Ph.D. thesis.
J. Prewitt, and H. R. McFarland (Editors) (2021). “Bering Science: Winter 2021 Bering Region Ocean Update.” Issue 3 (Anchorage, Alaska: Alaska Ocean Observing System). Available at: https://legacy.aoos.org/wp-content/uploads/2021/04/Bering-Science-FINAL-WEB-9April21.pdf (Accessed February 17, 2023).
Punt, A. E., Ortiz, I., Aydin, K. Y., Hunt, G. L., and Wiese, F. K. (2015). End-to-end Modeling as Part of an Integrated Research Program in the Bering Sea. Deep-Sea Res. II. doi:10.1016/j.dsr2.2015.04.018s
Rantanen, M., Karpechko, A. Y., Lipponen, A., Nordling, K., Hyvärinen, O., Ruosteenoja, K., et al. (2022). The Arctic Has Warmed Nearly Four Times Faster Than the Globe Since 1979. Commun. Earth Environ. 3, 168. doi:10.1038/s43247-022-00498-3
Rautio, A., and Natcher, D. (2016). “Food and Water Security in the Arctic.” Shared Voices Magazine. Rovaniemi, Finland: University of the Arctic, 28–29. Available at: https://www.uarctic.org/shared-voices/shared-voices-magazine-2016/ (Accessed February 17, 2023).
Ringler, T., Petersen, M., Higdon, R. L., Jacobsen, D., Jones, P. W., and Maltrud, M. (2013). A Multi-Resolution Approach to Global Ocean Modeling. Ocean. Model. 69, 211–232. doi:10.1016/j.ocemod.2013.04.010
Sandø, A. B., Mousing, E. A., Budgell, W. P., Hjøllo, S. S., Skogen, M. D., and Ådlandsvik, B. (2021). Barents Sea Plankton Production and Controlling Factors in a Fluctuating Climate. ICES J. Mar. Sci. 78 (6), 1999–2016. doi:10.1093/icesjms/fsab067
Schmidt, J. I., Johnson, B., Huntington, H. P., and Whitney, E. (2022). A Framework for Assessing Food-Energy-Water Security: A FEW Case Studies from Rural Alaska. Sci. Total Environ. 821, 153355. doi:10.1016/j.scitotenv.2022.153355
SeaWiFS (2019). SeaWiFS Level-2 Ocean Color Data Version 2018. Greenbelt MD: Goddard Space Flight Center. Maintained by NASA Ocean Biology Distributed Active Archive Center (OB.DAAC). doi:10.5067/ORBVIEW-2/SEAWIFS/L2/OC/2018
SIKU (2019). SIKU: The Indigenous Knowledge Social Network. Available at: https://siku.org/ (Accessed February 24, 2023).
Smith, S. J., Edmonds, J., Hartin, C. A., Mundra, A., and Calvin, K. (2015). Near-Term Acceleration in the Rate of Temperature Change. Nat. Clim. Change 5 (4), 333–336. doi:10.1038/nclimate2552
Starkweather, S., Larsen, J. R., Kruemmel, E., Eicken, H., Arthurs, D., Bradley, A. C., et al. (2021). Sustaining Arctic Observing Networks’ (SAON) Roadmap for Arctic Observing and Data Systems (ROADS). Arctic 74 (1), 56–68. doi:10.14430/arctic74330
Steele, M., Bliss, A. C., Peng, G., Meier, W. N., and Dickinson, S. (2019). Arctic Sea Ice Seasonal Change and Melt/Freeze Climate Indicators From Satellite Data, Version 1. Boulder, Colorado USA: NASA National Snow and Ice Data Center Distributed Active Archive Center. doi:10.5067/KINANQKEZI4T
Steiner, N. S., Cheung, W. W. L., Cisneros-Montemayor, A. M., Drost, H., Hayashida, H., Hoover, C., et al. (2019). Impacts of the Changing Ocean-Sea Ice System on the Key Forage Fish Arctic Cod (Boreogadus Saida) and Subsistence Fisheries in the Western Canadian Arctic—Evaluating Linked Climate, Ecosystem and Economic (CEE) Models. Front. Mar. Sci. 6, 179. doi:10.3389/fmars.2019.00179
Stige, L. C., Eriksen, E., Dalpadado, P., and Ono, K. (2019). Direct and Indirect Effects of Sea Ice Cover on Major Zooplankton Groups and Planktivorous Fishes in the Barents Sea. ICES J. Mar. Sci. 76 (1), i24–i36. doi:10.1093/icesjms/fsz063
Struzik, E. (2016). “Food Insecurity: Arctic Heat Is Threatening Indigenous Life.” Yale Environment 360. Published at the Yale School of the Environment. Available at: https://e360.yale.edu/features/arctic_heat_threatens_indigenous_life_climate_change (Accessed March 17, 2016).
Suryan, R. M., Arimitsu, M. L., Coletti, H. A., Hopcroft, R. R., Lindeberg, M. R., Barbeaux, S. J., et al. (2021). Ecosystem Response Persists After a Prolonged Marine Heatwave. Sci. Rep. 11 (1), 6235. doi:10.1038/s41598-021-83818-5
Suydam, R. S., and George, J. C. (2004). Subsistence Harvest of Bowhead Whales (Balaena Mysticetus) by Alaskan Eskimos, 1974 to 2003. Paper SC/56/BRG12 presented to the Scientific Committee of the International Whaling Commission.
Syvertsen, E. E. (1991). Ice Algae in the Barents Sea: Types of Assemblages, Origin, Fate and Role in the Ice-Edge Phytoplankton Bloom. Polar Res. 10 (1), 277–288. doi:10.3402/polar.v10i1.6746
UNEP (2007). Global Outlook for Ice and Snow. Available at: https://wedocs.unep.org/20.500.11822/7792 (Accessed February 17, 2023).
USCB (2022). Annual Estimates of the Resident Population for Incorporated Places in Alaska: April 1, 2020 to July 1, 2021. U.S. Census Bureau, Population Division. (SUB-IP-EST2021-POP-02). Available at: https://www.census.gov/data/tables/time-series/demo/popest/2020s-total-cities-and-towns.html (Accessed February 17, 2023).
Vancoppenolle, M., Bopp, L., Madec, G., Dunne, J., Ilyina, T., Halloran, P. R., et al. (2013). Future Arctic Ocean Primary Productivity From CMIP5 Simulations: Uncertain Outcome, but Consistent Mechanisms. Glob. Biogeochem. Cycles 27, 605–619. doi:10.1002/gbc.20055
Vylegzhanin, A. N., Young, O. R., and Berkman, P. A. (2020). The Central Arctic Ocean Fisheries Agreement as an Element in the Evolving Arctic Ocean Governance Complex. Mar. Policy 118, 104001. doi:10.1016/j.marpol.2020.104001
Waga, H., Eicken, H., Hirawake, T., and Fukamachi, Y. (2021). Variability in Spring Phytoplankton Blooms Associated With Ice Retreat Timing in the Pacific Arctic From 2003–2019. PLoS ONE 16 (12), e0261418. doi:10.1371/journal.pone.0261418
Walch, A., Bersamin, A., Loring, P., Johnson, R., and Tholl, M. (2018). A Scoping Review of Traditional Food Security in Alaska. Int. J. Circumpolar Health 77 (1), 1419678. doi:10.1080/22423982.2017.1419678
Walsh, J. E., Eicken, H., Redilla, K., and Johnson, M. (2022). Sea Ice Breakup and Freeze-Up Indicators for Users of the Arctic Coastal Environment. Cryosphere 16 (11), 4617–4635. doi:10.5194/tc-16-4617-2022
Weatherhead, E., Gearheard, S., and Barry, R. G. (2010). Changes in Weather Persistence: Insight From Inuit Knowledge. Glob. Environ. Change 20 (3), 523–528. doi:10.1016/j.gloenvcha.2010.02.002
Weingartner, T. J., Aagaard, K., Woodgate, R., Danielson, S., Sasaki, Y., and Cavalieri, D. (2005). Circulation on the North Central Chukchi Sea Shelf. Deep Sea Res. Part II Top. Stud. Oceanogr. 52, 3150–3174. doi:10.1016/j.dsr2.2005.10.015
Winsor, P., and Chapman, D. C. (2004). Pathways of Pacific Water Across the Chukchi Sea: A Numerical Model Study. J. Geophys. Res. Oceans 109, C03002. doi:10.1029/2003JC001962
Woodgate, R. A., and Aagaard, K. (2005). Revising the Bering Strait Freshwater Flux Into the Arctic Ocean. Geophys. Res. Lett. 32, L02602. doi:10.1029/2004GL021747
Yun, M. S., Whitledge, T. E., Stockwell, D., Son, S. H., Lee, J. H., Park, J. W., et al. (2016). Primary Production in the Chukchi Sea With Potential Effects of Freshwater Content. Biogeosciences 13, 737–749. doi:10.5194/bg-13-737-2016
Keywords: food security, marine ecosystem, subsistence, Earth system modeling, Alaskan Arctic
Citation: Gibson GA, Eicken H, Huntington HP, Deal CJ, Lee O, Smith KM, Jeffery N and Sam J-M (2024) How Earth System Models Can Inform Key Dimensions of Marine Food Security in the Alaskan Arctic. Earth Sci. Syst. Soc. 3:10082. doi: 10.3389/esss.2023.10082
Received: 04 April 2023; Accepted: 06 December 2023;
Published: 08 January 2024.
Edited by:
Donald John MacAllister, British Geological Survey-The Lyell Centre, United KingdomReviewed by:
Nadja Steiner, Fisheries and Oceans Canada (DFO), CanadaOne reviewer who chose to remain anonymous
Copyright © 2024 Gibson, Eicken, Huntington, Deal, Lee, Smith, Jeffery and Sam. This is an open-access article distributed under the terms of the Creative Commons Attribution License (CC BY). The use, distribution or reproduction in other forums is permitted, provided the original author(s) and the copyright owner(s) are credited and that the original publication in this journal is cited, in accordance with accepted academic practice. No use, distribution or reproduction is permitted which does not comply with these terms.
*Correspondence: Georgina A. Gibson, gagibson@alaska.edu