
Spatio-Temporal Dynamics of Sediment Transport Pathways: Sand Apron Bars and Islands of Tokelau and Kiribati, Central Pacific
 Eugene C. Rankey
 Tion Uriam
 Mika Perez3
- 1Kansas Interdisciplinary Consortium on Earth, Energy, and Environment, Department of Geology, University of Kansas, Lawrence, KS, United States
- 2Ministry of Information, Communications and Transport, Tarawa, Kiribati
- 3Department of Economic Development, Natural Resources and Environment, Nukunonu, Tokelau
Although there is general agreement that global change will influence low-lying atoll islands, considerable uncertainty remains concerning the nature, rates, and causes of morphological change (or, conversely, the stability) of islands. As the net geomorphical product of sediment erosion, transport, and accumulation, islands are intimately tied to reef flat sedimentological processes. Recognizing the morphodynamical linkages between reef flats and islands, the purpose of this study is to examine the nature and controls on spatial and temporal variations in sediment transport pathways on reef flats and their relation to island planform changes or stability on atolls of Tokelau and Kiribati. GIS analysis of historical aerial images and high-resolution remote-sensing data capture patterns of reef flat change up to 72 years in duration with up to weekly temporal resolution. Data reveal how granular materials that make up bars and islands on reef flats respond to physical oceanographic processes via sedimentary-geomorphical change across temporal scales, from “instantaneous” impacts of cyclones or swell events to seasonal to multi-decadal shifts. Each of these shifts is manifest as migration of sediment of island beaches and bar forms, but the character varies markedly—bars form new islands, others erode and disappear; some changes are cyclic, others are directional, still others are hybrid; sediment can be transported lagoonward, oceanward, along the reef flat, or in combinations thereof; and migration rates reach up to 10 s of m/month. Although sea-level change likely plays a modulating role, much of the considerable spatial and temporal variability relates to differences in energy controlled by seasonal change in swell direction and climate shifts. Nonetheless, sedimentary response to these external forcings at any specific location also is shaped by local factors, such as trade wind-generated lagoonal waves and currents, atoll lagoon size and depth, margin width and orientation relative to waves, and autogenic processes such as attachment of migrating bars. Collectively, these influences shape the spatially and temporally heterogeneous sediment flux to and from islands, and thus the variable response of islands to ongoing sea-level change. Understanding such local influences is requisite to predictive understanding of how global change might impact these sensitive seascapes.
Introduction
“…for dust thou art, and into dust thou shalt return.” – Genesis 3:19
Low-lying atoll islands are dynamic systems, responsive to many factors. Although there is general agreement that climate change will influence these islands, the nature, rates, and causes of morphological change of islands in response to such external forcing—or their stability—remain the subject of debate. Observations that atoll islands include variable island behavior across oceans and even within archipelagos (recently summarized by Duvat, 2018) have led some to suggest that studies examining a range of spatial and temporal scales are necessary to evaluate if changes represent distinct trends or individual phases in erosion-deposition cycles (Woodroffe, 2008; Dawson, 2021). Questions of the nature, rates, and causes of island change are of more than academic interest. With recent increases in the rate of sea-level rise and mounting anecdotal evidence of shoreline erosion, coastline dynamics have become a central concern for residents of many small, low-lying island nations (Roy and Connell, 1991; Barnett and Adger, 2003; Duvat, 2018; Kench et al., 2018; Kane and Fletcher, 2020).
Sea level is changing, including a multi-decadal rise in the central Pacific (Aung et al., 2009; Cazenave et al., 2014). Basic physical-oceanographic constraints mandate that sea level plays a role in sediment distribution and geomorphic adjustments. If sea-level rise were the dominant control on changes in atoll sedimentary systems, we might expect that the increased water levels facilitate higher wave energy on and across reef flats (Storlazzi et al., 2018). This increased energy would favor island erosion or lagoonward retreat of islands (Storlazzi et al., 2018; East et al., 2020). In that light, it may be surprising that a suite of studies since 2010 (e.g., Webb and Kench (2010), Owen et al. (2016), Aslam and Kench (2017), Duvat (2018), Kench et al. (2018)) have challenged the notion of a simple, 1:1 relationship between rising sea level and shoreline erosion.
The dynamics of islands—growth, stability, and erosion—reflect exchange of sediment between islands and the adjacent reef flats (McLean and Kench, 2015; Kench et al., 2018; East et al., 2020; Masselink et al., 2020). In this context, a key to understanding the heterogenous response of islands to sea-level rise may lie in discerning the details of factors that control sediment transfer to and from islands (Hamylton et al., 2016; Owen et al., 2016; Aslam and Kench, 2017; East et al., 2020; Kane and Fletcher, 2020). Acknowledging this linkage, this project views and analyzes islands as the stabilized, terrestrial components of the broader reef flat geomorphic system, rather than as isolated elements. Using time-series remote-sensing imagery from atolls of Tokelau and Kiribati, the purposes of this paper are A) to document spatio-temporal changes in reef-associated sedimentary seascapes; B) to assess sediment transport pathways; and C) to evaluate controls on these morphodynamics. The results demonstrate how transport pathways of atolls are shaped by distinct combinations of local factors, shifts in regional wave climate, and global change, and provide several examples of how sediment dynamics control changes in island position and extent.
Background
Geography
To explore sediment dynamics of atoll reef flats and islands, this study documents patterns from three atolls from the Gilbert Islands of the Republic of Kiribati and two atolls from Tokelau (Figures 1A–C). We utilize and build upon previous efforts in Kiribati, but since historical changes have been not been documented previously in Tokelau, we include more extensive documentation of patterns on those atolls.
FIGURE 1
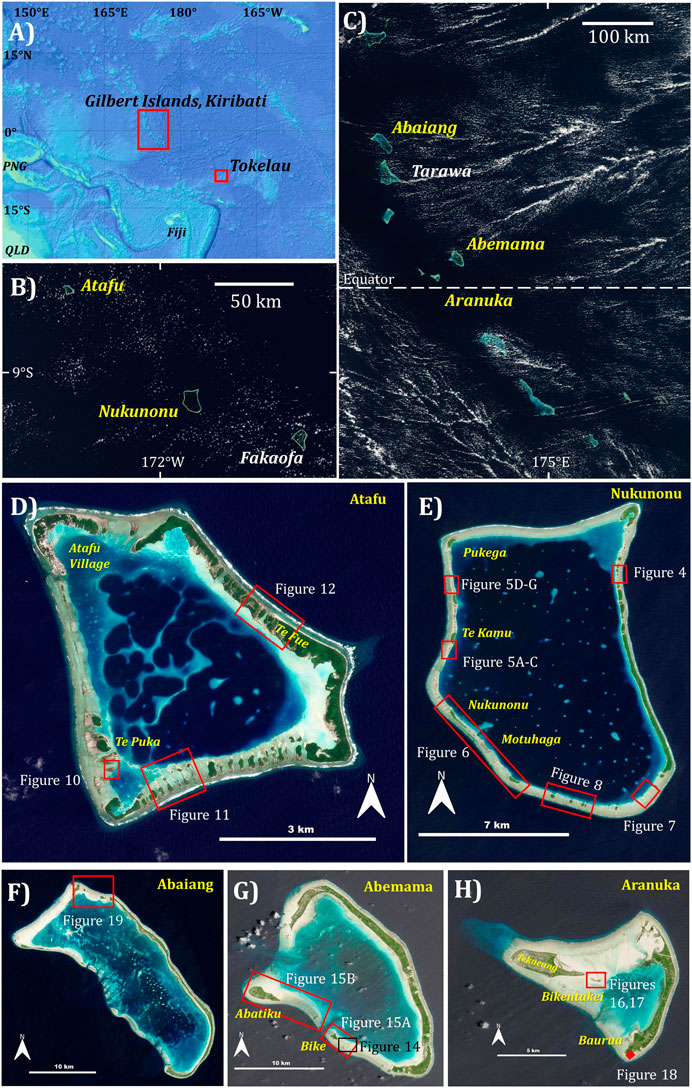
FIGURE 1. Location and focus areas. (A) Location of Tokelau and Gilbert Islands in the equatorial Pacific. PNG, Papua New Guinea; QLD, Queensland, Australia. (B,C) MODIS images of the atolls of Tokelau (B) and Gilbert islands (C). Atolls described in detail are in yellow text, and other atolls mentioned are in white text. (D) Atafu, Tokelau. (E) Nukunonu, Tokelau. (F) Abaiang, Gilbert Islands, Kiribati. (G) Abemama, Gilbert Islands, Kiribati. (H) Aranuka, Gilbert Islands, Kiribati. Red boxes in parts (D–H) represent location of other figures as noted, and these images are Ⓒ2022, Planet Labs PBC.
The nation of Tokelau includes three atolls that lie roughly nine degrees south of the equator, spread NW-SE across a distance of less than 165 km. To the northwest, Atafu forms an irregular pentagon with a continuous rim, covering less than 27 km2 (Figure 1D). The east- and northeast-facing margins host a string of islands separated by narrow ahaga (Tokelauan for a reef opening space between two islets, comparable to Polynesian “hoa”), a pattern that contrasts with the more open north, west, and south margins that include fewer islands. In the lagoon, a reticulate system of patch reefs surround basins that are up to 30 m deep. Nukunonu, the central atoll, is larger, over 14 km long north-south, and covers nearly 116 km2 (Figure 1E). This horseshoe-shaped atoll includes a string of islands and narrow ahaga on its eastern flank, discontinuous and widely spaced islands on the south and west margins, and a north rim (Ahaga Loa, literally “long reef opening”) with no islands. The lagoon is up to 50 m deep and includes scattered patch reefs. The southern atoll, Fakaofo, forms a deformed four-sided polygon that covers ∼70 km2 with a continuous rim, is not documented in detail.
The 16 Gilbert atolls and platform reefs extend from roughly 3°N to 3°S. The atolls documented here, Abaiang, Abemama and Aranuka (Figure 1C), lie in the north to middle of the chain, between 2°N and the equator. Abaiang (Figure 1F) and Abemama (Figure 1G) are ovoid to bean shaped, elongate northwest-southeast, include well-developed rims surrounding deeper lagoons. Abaiang is larger in extent than Abemama (385 km2 vs. 292 km2). Islands are more common on their east-northeast facing rims, but islands do occur on the remainder of the rim, including two on the southwest rim of Abemama that are a focus here. The lagoon of Abaiang is up to 27 m deep, whereas Abemama reaches 24 m depth; both include scattered patch reefs, and both have reef passes. Aranuka, just north of the equator, is an 85 km2, triangular atoll with two elongate islands extending along most of its eastern margin, and another large island nestled in its west-facing apex (Figure 1H). Its rim is continuous except for a narrow pass in the south, and it includes a pronounced reef sand apron, surrounding a lagoon that is up to 18 m deep.
General Climatic and Physical Oceanographic Setting
As an equatorial nation, Kiribati does not experience marked seasonal changes in temperature, although squalls and rains are more common in the austral summer season (“Aumeang”) from November to March than the dry austral winter (“Aumaiaki”). Tides in Kiribati are dominantly semidiurnal, with spring range of over 2 m and neap range of less than 0.6 m (Goldberg and Rankey, 2023). Traditional knowledge suggests that the spring tides during the “Aumeang” season are higher, and this factor could impact wave energy that reaches shorelines. Only one cyclone has been recorded in Kiribati, impacting the northern Gilberts in 1927 or 1928, and cold fronts do not directly affect the area.
In Tokelau, at roughly 9°S, the easterly trade winds predominate for much of the year. The weather is unsettled with more precipitation from November to March. During this austral summer, Tokelau can experience brisk winds and rough seas associated with westerly or northwesterly winds. In the austral winter, the more gentle trade winds are most common. Tides in Tokelau are semidiurnal with spring tide range of roughly 1.3 m, and neap tide range of less than 0.4 m (Goldberg and Rankey, 2023). Tokelau is in the Pacific cyclone belt; direct hits by cyclonic storms are infrequent, but when they do strike, they can have major impact on the atolls.
In general terms, both areas lie in the trade wind belt, and dominant easterlies generate wind waves from the east. Within this generalization, however, lies considerable seasonal and ENSO variability in winds, wind waves, and swell. For example, both areas can be impacted by powerful swell from distant, higher latitudes storms (Wasserman and Rankey, 2014; Hoeke et al., 2021).
As across much of the tropical Pacific, the long-term sea level has been rising. For example, in Betio, on Tarawa in Kiribati, the trend over 1995–2018 (the interval with available continuous, consistent data) suggest a long-term rate of rise of 4.8 mm/yr (Figure 2A). This trend is quite irregular, however, shaped by climatic variability. For example, the most pronounced changes in sea level are associated with ENSO shifts, with generally lower sea level during El Nino phases. A change of almost 45 cm was associated with the 1997/1998 El Nino, and a change of 30 cm occurred during the 2015/2016 shift to El Nino (Figure 2B). In addition to these multi-annual shifts, a seasonal cycle includes sea level changes of an average of ∼7 cm, lowest in June, highest in December. Comparable continuous tide gauge data are unavailable for Tokelau.
FIGURE 2
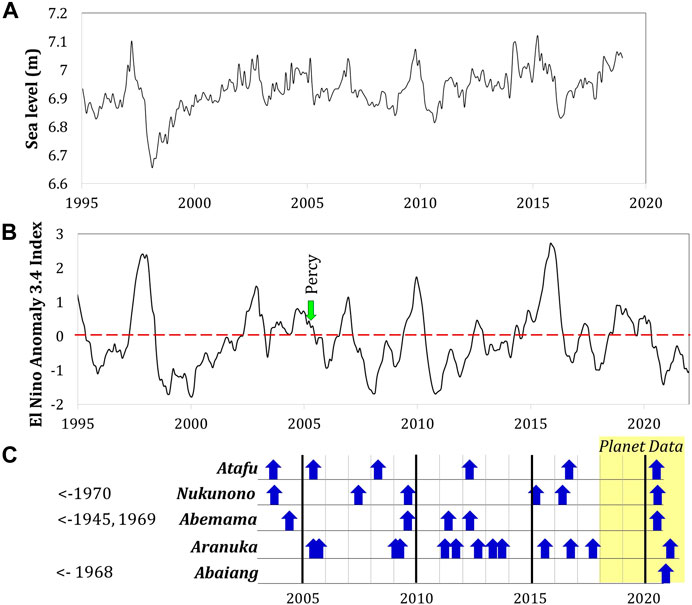
FIGURE 2. (A) Changes in sea level, Betio, Tarawa, Kiribati. The sea-level data represent monthly mean elevations relative to the Revised Local Reference (RLR) datum as established by the Permanent Service for Mean Sea Level (PSMSL)1. (B) Climatic trends, as reflected in the El Nino Anomaly 3.4 Index, calculated using NOAA ersstv5 from CPC2. On this plot, a value >0 represents an El Nino state, <0 La Nina conditions. Note the pronounced El Ninos in 1997/1998, 2009, and 2015/2016, and that these relate to changes in sea-level of up to several 10s of cm. (C) Dates of remote-sensing data utilized in this study are indicated as blue arrows. Planet data at frequency of greater than one scene/month are available 2018-present, as indicated by the yellow box.
Methods
To document the nature and dynamics of changes on these atolls, this study utilized a range of data sources and types. The fundamental data are observations of reef flat and island characteristics and changes documented using historical aerial images and high-resolution remote sensing data. These observations represent a series of case studies of changes from a range of atolls from Kiribati and Tokelau. Previously documented patterns from the Gilbert atolls (Webb and Kench, 2010; Rankey, 2011; Biribo and Woodroffe, 2013; Sengupta et al., 2021) provide an observational and interpretive foundation on which this study builds.
Remote Sensing Data
Data on shoreline and reef flat change are based on analysis and comparison of remotely sensed images. Data available for each atoll varied. Three atolls had historical aerial imagery that provide long-term, multidecadal perspectives: Nukunonu (1970), Abemama (1945, 1969), and Abaiang (1968). Starting with roughly 2003, recent very-high-resolution remote-sensing data (QuickBird, Geoeye, or Ikonos, mostly panchromatic, 0.6 m2 pixels or pan-sharpened multispectral, 0.7 m2 pixels) were available and utilized. In most cases, these represent acquisitions of opportunity wherein cloud-free images of an entire area are available from the archive at irregular intervals. Images used in such analyses for individual atolls ranged up to 14 (Aranuka, Kiribati) (Figure 2). These aerial and remote-sensing images provide high-resolution data to characterize details of islands and reef flats, and their changes.
Each atoll was queried further by Planet scenes, which provide multispectral data with 3 m2 pixels (Planet Team, 2017). These data provide much higher-frequency, and regular, temporal revisits; in some instances, images from successive days are available, most of the data and movies (see Supplementary Data) herein are illustrated at monthly intervals. These data permit detailed monitoring of seasonal changes, albeit at slightly lower spatial resolution. Planet data are available since 2016, with cloud-lean images available weekly to monthly after ∼2018.
Image Georeferencing
For explicit spatial comparison, images need to be georectified. As ground control points are unavailable, each image was georeferenced using control points from one consistent image in each atoll. Given the relative paucity of fixed, persistent features in many areas, natural features such as cemented beachrock outcrops or distinct patch reef corners were used commonly as control points. Image transformation in QGIS used a second-order polynomial; RMSE errors for the remote sensing images and high-resolution historical aerial images were consistently less than 2.5 m, errors for some of the historical aerial images of lower resolution were greater, in a few cases more than 10 m.
Feature Digitization
Several different methods have been utilized to characterize islands and their changes. One commonly utilized boundary is the edge of vegetation (e.g., Webb and Kench (2010), Ford (2013), Aslam and Kench (2017)). This contact has been described as a proxy for the “stable island core,” and it indeed represents the part of islands that has remained stable for sufficient time to permit vegetation to colonize an area and remain vegetated. Nonetheless, as Ford (2013) noted, in contrast to erosion which can be “instantaneous,” recovery or growth of beaches and vegetation on islands can be a gradual process. As such, he suggested that short-term records can favor detection of erosion and that “dampening the signal of episodic events” represented a “potential source of bias.”
In contrast, other workers have utilized toe of the beach as a datum to digitize and capture island footprints and their change (Rankey, 2011; Dawson, 2021). Some studies have avoided this datum, suggesting that it can “fluctuate over short time-periods” (Sengupta et al., 2021) and unlike the island core, it may reflect high-frequency change driven by variations in physical conditions (cf., Aslam and Kench (2017), Duvat (2018)). Given the recognition that islands do not grow unless sediment is added, and since our focus is on these very high-frequency changes that can inform regarding sediment dynamics, we elected to map toe of the beach to capture the entire island footprint (Dawson, 2021) and the morphology and dynamics of nearshore bars. Although it discounts the importance of vegetation for islanders and the importance of stability for habitation, this approach offers several advantages: 1. It describes changes in island footprint as they occur (e.g., it is not dependent on growth of vegetation); 2. It captures ephemeral features that appear, but do not last sufficiently long to become densely vegetated before being eroded; 3. It can be used for sedimentary features including both bars and islands, and envelop the dynamics of sediment transfer from bars to islands and vice versa. Of course, using this datum for digitization does not imply that we ignored the stable, vegetated island cores.
The toe of the beach for islands was digitized manually within QGIS, by a single operator (ECR) for consistency. Results were reviewed by all co-authors to ensure that the data were consistent with field observations, local understanding and first-hand knowledge. As appropriate and clearly defined, bar crests or toes of bars were digitized as well.
Change Analyses: Quantitative and Qualitative
Bars and islands represent sinks of sediment and are visible on remote-sensing imagery, data that can provide unique perspectives on mode and magnitude of change. As long-term changes of shorelines have been documented before in Kiribati (see references above), the focus here was not on systematic documentation of all islands on all atolls. Rather, our emphasis lies in areas that demonstrate representative, illustrative, or informative dynamics.
Comparison of digitized shorelines provided means to assess changes in shoreline position as well as migration of bars. Digitized shorelines were converted to polygons in QGIS for calculating island areas. Comparison of areas of the same island through time document temporal changes.
Beyond quantitative analyses of changes in shoreline position and island area, this study also characterizes qualitative changes in a time-series of successive images to document bar dynamics. This approach acknowledges that some bars may not have discrete boundaries or resolvable crests that can be digitized, but several examples demonstrate unambiguous shifts in position of bar crests that are greater than that expected via changes in imaging parameters (e.g., tide level).
These analyses, demonstrated below as figures and in the Supplementary Data as movies, capture changes at time scales from days (to assess impact of wave events) to weeks/months (to assess seasonal changes) to multi-annual (to start to capture ENSO-related shifts), using Planet data. These time-series data show general trends in patterns of sediment transport but have several limitations: 1. They do not offer m-scale precision offered by digitization from very-high-resolution images. As such, only more pronounced changes are documented. 2. Some sediment transport simply is not discernible from remote-sensing data, for example, sediment transport across flat sand beds. 3. Available high-temporal resolution Planet data do not capture the full range of ENSO variability. For example, only sporadic images sample the last pronounced El Nino, in 2015–2016. Even with these limitations, the characterizations provide qualitative insights into general patterns of sediment transport.
Wind and Wave Data
Data describing winds are derived from the Fifth European Centre for Medium-Range Weather Forecasts ReAnalysis (ERA5), a dataset derived from integrating historical observations with numerical modeling and data assimilation systems (Hersbach et al., 2017). ERA5 data used herein from the global wind dataset (1979–2021) that included hourly data at a spatial resolution of 0.25° during the full period. Wind data presented herein represent wind vectors at 10 m.
These wind data provided input into the DHI global wave model dataset (GWM), generated by DHI’s 3rd generation MIKE 21 Spectral Wave Model, calibrated and validated by both offshore buoy and satellite data. Data are documented at hourly temporal resolution on a flexible mesh with varying cell size (15–50 km), from 1979 to 2021. This wave model includes parameters of significant wave height, peak wave period, and mean wave period, and subdivides locally generated wind-waves from swell generated outside the local area. This latter distinction is important in large basins like the Pacific, where waves can be generated by distant fronts or cyclones and travel hundreds or even thousands of km to impact distant atolls (Hoeke et al., 2013; Hoeke et al., 2021; Wasserman and Rankey, 2014). Of note, data in the descriptions that follow are characterized with reference to both wind waves (waves generated by local winds) and peak waves (the portion of the wave spectrum with the most energy).
Both wind and wave data were extracted using Meta-Ocean on Demand by DHI3. Data from a point in central Kiribati (173.6°E, 0.3°N) and Tokelau (171.8°W, 9.1°S) were queried for the months of January (austral summer) and July (austral winter) over 30 years periods to characterize seasonal changes, and for specific years to characterize ENSO variability. In illustrations of both wind and wave data, major but infrequent storm events may be difficult to resolve, in that a storm that lasts a few days represents an insignificant percentage of 30 years of data. Nonetheless, the impact of specific cyclones is discussed in the context of image data below.
Wave and wind data (Figure 3) are illustrated as rose diagrams. These figures capture the direction (0°–360°) and the frequency (width of the petal) from which winds and waves approach an area.
FIGURE 3
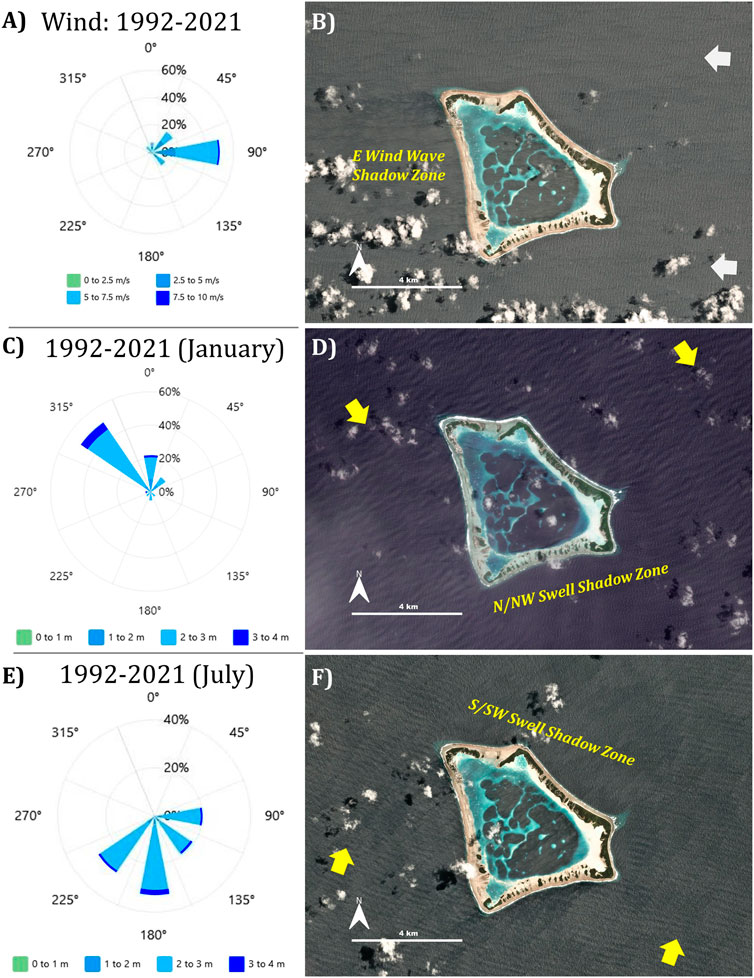
FIGURE 3. Synoptic wind and wave characteristics, Tokelau. Data are provided by Metocean Data Portal3. (A) Rose diagram of wind data, illustrating the direction and frequency from which the wind blows. Data here represent all months, 1992–2021. Note that winds are dominantly easterly, reflecting the Trade Winds. (B) Planet image from 2022-9-27, illustrating modest waves dominantly from the east (white arrow), and a wave shadow zone west of the atoll. Image Ⓒ2022, Planet Labs PBC. (C) Rose diagram of wave data during all Januarys between 1992 and 2021, documenting direction and significant wave height of peak waves, or those waves that include the most energy. These data illustrate that the most energetic waves during this boreal winter month include a northerly component. (D). Planet image of Atafu from 2022-1-7. On this day, swell with wavelength of ca 300 m from the north-northwest (yellow arrows) hit the atoll, impacting north-facing margins but creating a low-energy wave shadow zone to its south. Image Ⓒ2022, Planet Labs PBC. (E) Rose diagram of wave data during all Julys between 1992 and 2021, indicating direction and significant wave height of peak waves. During these austral winter months, waves included a dominant southerly approach direction. (F) Planet image of Atafu from 2019-9-3, documenting swell from the south (yellow arrows) that impacted that margin and created a low-energy zone in the atoll’s lee. Image Ⓒ2019, Planet Labs PBC.
Terminology
The focus herein is on the reef rim, the shallow-water portion of atolls extending from the seaward break point for incoming open-ocean waves, e.g., the reef crest, to the deeper water of the lagoon. The rim can include various benthic habitats, ranging from in-situ reef to lithified or biotically bound reef debris to granular rubble to sand of the reef sand apron. The rim can include motu, a Polynesian term used in Tokelau for the “part of the reef with vegetation, surrounded by water or arid dry rock,” and whose literal meaning is “broken off” (Danielsson, 1954). A broadly comparable term in Kiribati is atimakoro, which translates literally to “seed portion,” reflecting smaller islands, but this term is not in wide usage any more. We use these terms interchangeably with island and islet, with the latter representing a “small” island. We do note that sizes of terrestrial land bodies on atolls (islands/islets) have no natural break in size distribution, and their colloquial usage is not uniformly applied. For example, Fongafale Islet is the largest landmass on Funafuti Atoll in Tuvalu, where it is 12 km long, hardly a ‘small’ island. We further acknowledge that some (e.g., Stoddart and Steers (1977)) apply elevation or sediment size criteria to distinguish motu from sand cays, for example, In many publications, motu are described as being separated by ahaga (Tokelau) or rawa (Kiribati), or shallow passes (cf. hoa of Danielsson, 1954; Stoddart and Fosberg, 1994). Widths and depths of these passes vary considerably and commonly form a continuum, and at some point, especially broad ahaga/rawa simply transition into undifferentiated expanses of rim, and islets become islands.
As our emphasis is on sediment and its transport, we use various terms related to sandy geomorphic forms on the rim. One occurs lagoonward of ahaga, as flow restriction caused by islands ends and the bottom deepens into the lagoon. These areas, which can assume a broadly lobate shape, have been described as “submerged reef deltas” (McKee, 1958) and “submarine sand deltas” (Stoddart and Gibbs, 1975). As many are not immediately adjacent to reefs and to distinguish them from siliciclastic forms, we call these forms sand-apron deltas.
This paper uses the term sand apron bars (or, loosely, bars) to describe elongate to arcuate geomorphic accumulations of granular material whose crests are shallower than the surrounding seafloor. These features are not repeated along the direction of flow, and so are distinct from dunes; sand apron bars can have superimposed dunes and ripples however. Some bars can become emergent, lying above sea level, and with time, can stabilize and be vegetated to become proper islands (see Sections Nukunonu Atoll Geomorphic Changes and Atafu Atoll Geomorphic Changes). Vegetation is typically first a mix of scrubs (e.g., Scaevola) and sedges, and sandy soils develop Suriana. The mangrove Pemphis may occur. A halophytic forest zone with larger vegetation such as Pandanus develops in time, and if large and sufficiently stable, more mesophytic forest (Whistler, 1988).
Results
Tokelau
Oceanography
At 8–10°S, the atolls of Tokelau lie in the heart of the trade wind belt, with easterly winds throughout most of the year. Over the period 1992–2021, roughly 80% of winds had an easterly component (Figure 3A), with the vast majority (98%) of speed less than 10 m/s. These persistent easterly winds generate modest wind waves that impact the east, windward flank of atolls (Figure 3B).
In contrast, peak waves, or those waves that contain the most energy, include considerable variability and change with seasons. Consider data from the austral summer month of January between 1992 and 2021. Over this 30 years period, 22% of peak waves were from the north, 51% were from the northwest, and 11% arrived from northeast (Figure 3C). Waves of significant wave height (Hs) of greater than 3 m came from the west (2.0% of the time in total) and northwest (5.7%). These northerly waves would most markedly impact the north-facing margins, and the south-facing rims would be leeward to these waves (Figure 3D). In marked contrast, synoptic data from the austral winter month of July between 1992 and 2021 demonstrate that the vast majority of peak waves are from the south (33%), southwest (27%) and southeast (18%) (Figure 3E). Waves with Hs of greater than 3 m were less common, and from the south (2.1% of all waves), southwest and southeast (0.7% each), or east (0.9%). During austral winter, the southern margins would be most impacted by the highest-energy waves (Figure 3F), roughly antipodal to the pattern in the austral summer.
Patterns of waves also change with ENSO state. For example, during a year that included the peak of a recent, marked El Nino (1 April 2015–1 April 2016), peak wind waves were dominantly (43%) from east, with 16% from southeast. The data indicate a westerly wind-wave component; 11.5% of wind waves arrived from the west and these had Hs greater than 2 m. Peak waves had a different distribution, generally southerly (29.0%), southwest (24.8%), or southeast (16.0%), with north waves common as well (14.9%). Peak waves with Hs > 4 m (1.1% of the total) were west/northwesterly. In comparison, a year during a representative La Nina phase (1 April 2010–1 April 2011) included 72% of peak wind waves from the east, with 25% from the northeast. Peak waves were most commonly from the southwest (24.5%), south (21.6%), and east (16.3%). Peak waves of Hs greater than 3 m represented only 0.7% of the data, and these were all from the north.
Only infrequently is Tokelau impacted directly by tropical cyclones, but they can have marked impacts. For example, Cyclone Percy passed over Tokelau as a Category 3–4 storm on 25 February 2005. Since it passed during spring tide, villages on Fakaofo and Nukunonu were flooded under a meter of water. Similar strong cyclones in 1987, 1990, and 1991 struck the atolls and their islands.
Nukunonu Atoll Geomorphic Changes
Nukunonu analyses include a wealth of data, including an historical image from 1970, six very high-resolution images at irregular intervals from 2003 to 2020, and more regular and frequent Planet data since 2016 (Figure 2C). The data reveal spatial and temporal changes in the patterns of reef flat sediment.
The eastern rim of the horseshoe-shaped Nukunonu (Figure 1E) includes a 0.45 km2 U-shaped island to the north that passes to a chain of islets, each less than 0.1 km2 in area, separated by shallow ahaga. From there to the southeastern extent of the atoll is a 7 km long, narrow but continuous island. The ocean-facing side of the island includes a sandy beach to the north, but has mostly rocky outcrops to the south.
The comparison of images of the islets and ahaga of this eastern rim document several patterns through time. First, although the islands are persistent throughout the 50+ years of the analysis, the footprint of some islands changes considerably. For example, in one representative area, islands shifted most markedly on their lagoonward flanks, changing by up to 55 m in the spits that bound ahaga (Figure 4). Change on the oceanward flank was less pronounced, generally less than 20–30 m. Although islands are dynamic, no persistent or long-term trend in position of islands, such as lagoonward migration, is evident, even considering the 1970 data. Second, the lobate sand-apron deltas at the lagoonward end of the ahaga include considerable changes. For example, consider the ahaga between Olomuana and Tuigaika (in the area of the red triangles, Figure 4), which in 1970 had one narrow lobe elongate to the west/southwest. By 2003, the lobe was broader and included a west/northwest-oriented component. The 2009 image reveals a single, distinct delta, a feature that in the 2015 and 2016 images appears less clearly outlined, although it lies farther east (oceanward) by 2016. This shift is accompanied by eastward movement of a discrete pendant-like bar on the south margin of Olomuana evident on the 2015 and 2016 images. In contrast, the 2020 image includes a return to a well-defined delta extending lagoonward; the pendant is absent, but a spit on the southern flank of Olomuana extended the islet west by more than 50 m. No obvious seasonal trends are evident in these data.
FIGURE 4
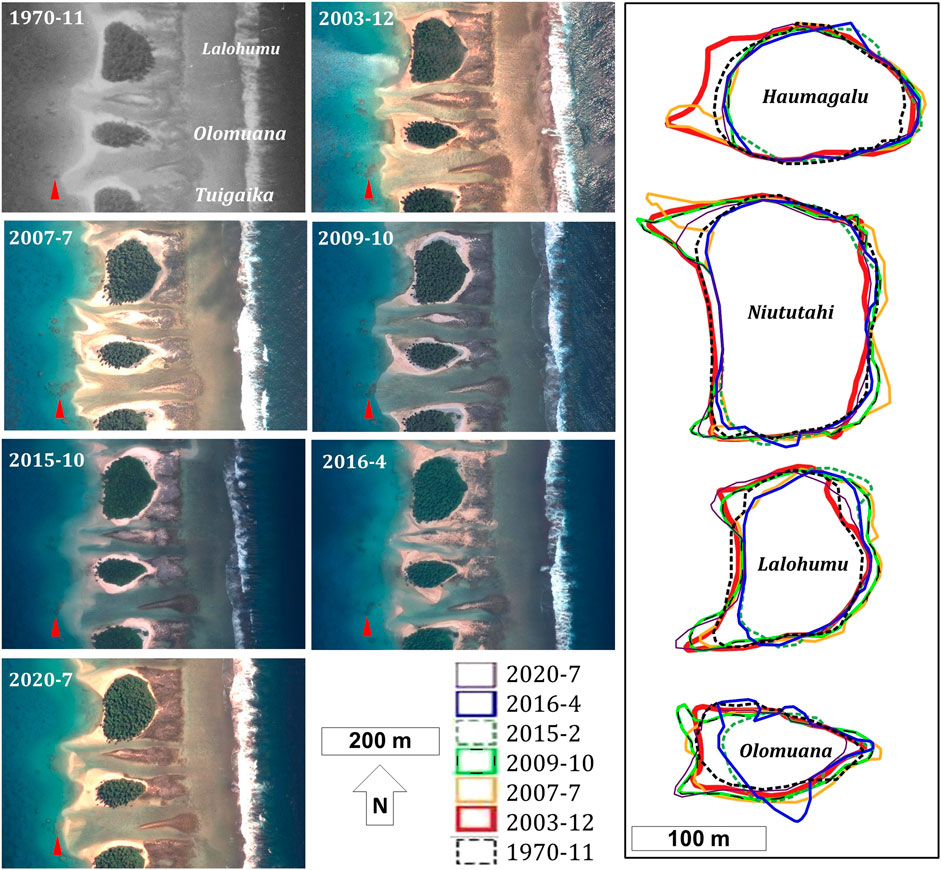
FIGURE 4. Temporal changes in ahaga and motu of east side of Nukunonu (locations in Figure 1E). Remote-sensing images arranged by date (1970–2020) on left side. Each image includes a triangle whose northern apex marks the same small patch reefs is included to aid comparison among images. Outlines of four illustrative islands though time on right. See text for discussion. Images Ⓒ SpaceImaging and DigitalGlobe, Inc.
Patterns on the western rim of Nukunonu are different than those on the eastern rim. This rim extends for roughly 8 km, from Pukega, the islet in the northwest corner of the atoll, to the populated islets of Nukunonu and Motuhaga to the south (Figure 1E). This margin includes only a few islets and is more than 80% open with a rim that is sediment poor and rocky.
Comparison of images reveals changes through time. The most marked changes occurred between the 1970 and the 2003 data, an interval during which 16 islets disappeared, many others were reduced in size (Figures 5A–C). Oral records indicate that many of these islets were removed with passage of the 1987 cyclone that impacted Nukunonu. One vestigial islet that survived this cyclone and was present in 2003 disappeared by 2007, an interval during which Cyclone Percy hit Tokelau (2005; cf. Atafu, below). Although the rim is generally sediment-lean and rocky, there are elongate, rim-parallel bars that come and go on the eastern (lagoon) flank of the rim. To the south, these features appear more persistent (e.g., Figures 5A–C, yellow triangles), but with variable position, especially notable just south of Te Kamu, the island. Farther north, they are present in 1970 and 2003, absent in 2007, 2009, 2016, and re-appear in 2020 (our 2015 data do not cover this area). They include arcuate forms that document a northward component of transport, akin to spit growth (Figures 5D–G, yellow triangles). Field observations indicate that these bars are 0.5–1.0 m high and consist of gravel and sand, and local understanding suggests that when the bar disappears, the gravel is washed into the lagoon.
FIGURE 5
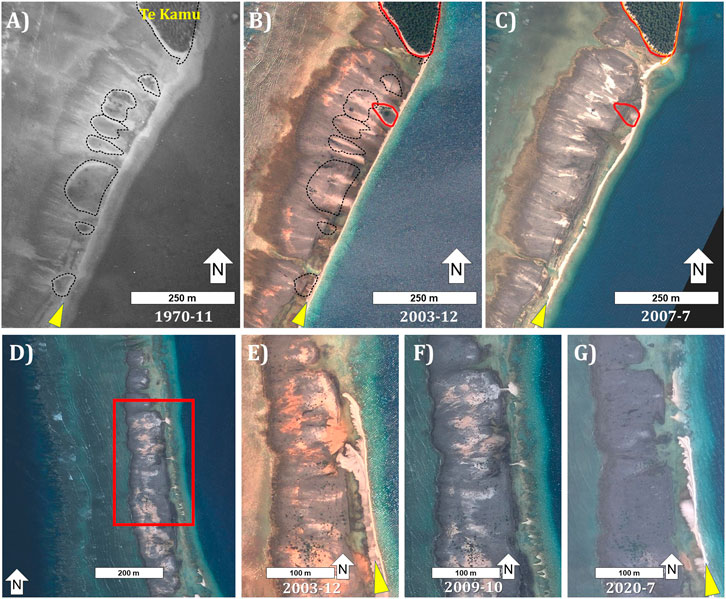
FIGURE 5. Temporal changes in ahaga and motu of west side of Nukunonu (locations in Figure 1E). (A) 1970. Note the presence of several small islets with partly vegetated tops rimmed by beaches, outlined in black dashed lines. Yellow triangle here, and in parts B and C, indicate location of a bar discussed in the text. (B) 2003. The 1970 islets (black dashed line) are largely eroded, and only one islet (outlined in red) south of Te Kamu remained here. Local knowledge indicates that these islands were eroded during the cyclone of 1987. (C) 2007. By this time, no islands are south of Te Kamu in this area. (D) Overview of reef flat in the generally rocky area to the north of Te Kamu. Red box notes area of (E–G). (E) 2003. (F) 2009. (G) 2020. Note the northward-growing spit (see yellow triangle), a bar-form evident in 2003 and 2020, but absent in the El Nino year of 2009. Images Ⓒ SpaceImaging and DigitalGlobe, Inc.
The two populated islets of Nukunonu and Motuhaga have experienced considerable erosion from 1970 to 2020 (Figure 6). In general terms, erosion is most pronounced on oceanward sides, but some erosion occurs on the lagoon flanks as well. Oral history records that the cyclone of 1987 caused considerable damage to the island, including erosion. Since that time, residents have built scattered seawalls of coral rubble to mitigate erosion, but even the non-populated north part of Nukunonu island has continued to erode.
FIGURE 6
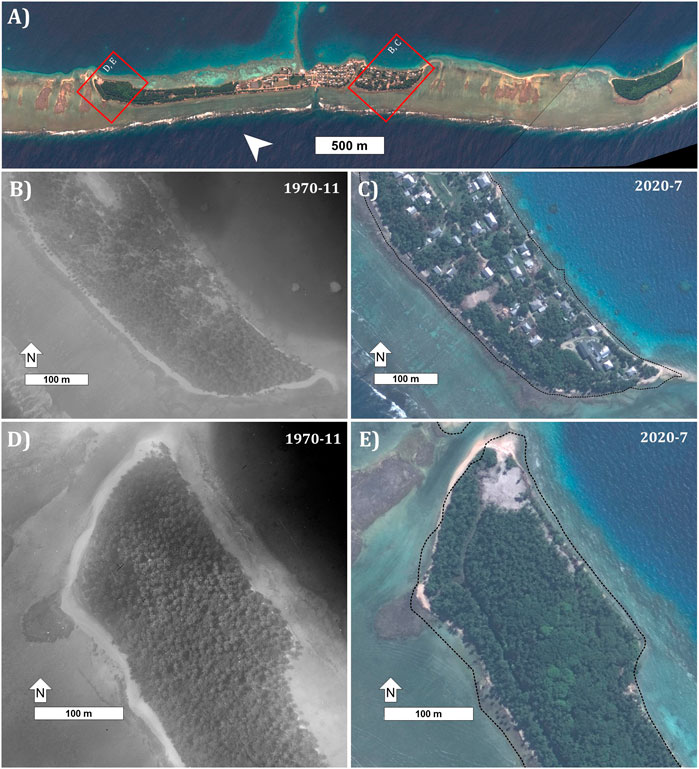
FIGURE 6. Changes along the southwest Nukunonu margin; locations in Figure 1E. (A) Overview image of Nukunonu village, the island to the north (left), and Motuhaga (right). Although some bars are evident between islands, much of the reef flat is rocky and sediment starved. Image Ⓒ2022 Planet Labs PBC. (B,C) Southeastern extent of Motuhaga in 1970 (B) and 2020 (C). In part (C), the position of the 1970 shoreline is shown by the dashed black line. (D–E) North tip of Nukunonu village in 1970 (D) and 2020 (E). In part (E), the position of the 1970 shoreline is shown by the dashed black line. Note the marked erosion of the shoreline in both areas. Images (C, E) are Ⓒ DigitalGlobe, Inc.
The southern margin of Nukunonu Atoll extends from Motuhaga east for roughly 10 km and includes ∼10 islets, all less than 1 km2 in area (Figure 1). Although the vegetated islets are generally stable, they include lagoon-facing appendages that shift between images, as on the east margin. In addition to these more-stable features, several islets first appear after 1970 (Figure 7). Two are evident first in 2003 (red arrows in Figure 7B); these persist through 2020, although the islet to the east is much diminished in extent by 2020. Additionally, a series of sandy islets appear by 2009 (yellow arrows of Figure 7C), have a broadly comparable extent in 2016 (Figure 7D), and disappear by 2020 (Figure 7E) (our 2007 and 2015 images are partly obscured by clouds).
FIGURE 7
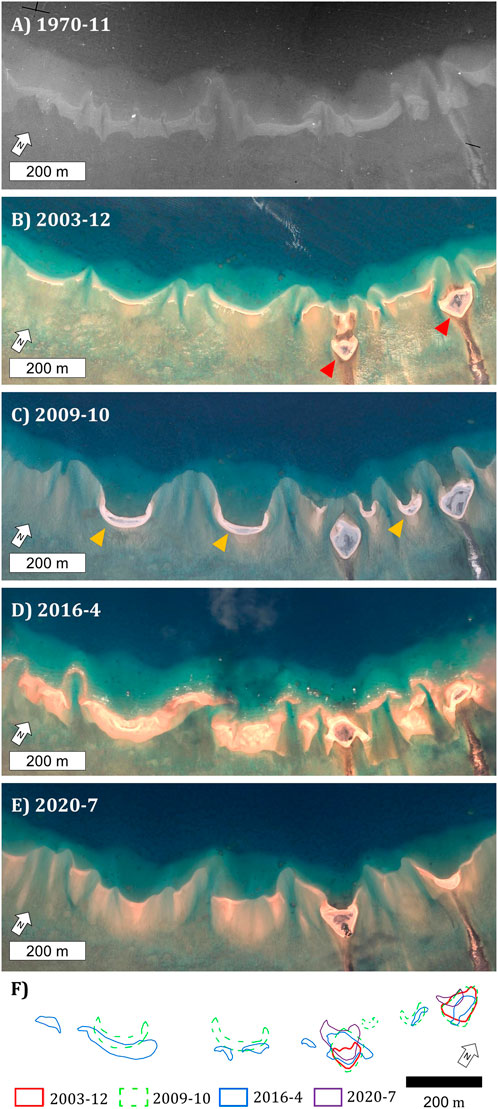
FIGURE 7. Changes along the south Nukunonu margin, 1970–2020; locations in Figure 1E. (A) In 1970, a series of linear to slightly arcuate bars on this margin were breached in several locations. No islands are evident. (B) By 2003, two islands (red arrows) had formed on subtle rocky highs, and the bars were more clearly arcuate, with concave-lagoonward segments separated by shallow channels. (C) The 2009 data indicate several new stabilized bars (e.g., islands; yellow arrows) separated by delta-like lobate forms, indicating that they shaped flow patterns. (D) Data from 2016 indicate emergent bars of broadly similar to greater extent, but less well-defined delta forms. (E) Data from 2020 reveal that all but one of the islets that emerged between 2003 and 2016 had eroded. (F) Outlines of emergent islets through time, illustrating the marked changes. Images (B–F) are Ⓒ SpaceImaging and DigitalGlobe, Inc.
Planet data document variations at even higher temporal resolution, revealing systematic seasonal changes in this area (Figure 8; please see also Supplementary Data S1). Specifically, during the austral winter (generally April-September) when Tokelau is impacted most strongly by swell from the south (Figures 3E, F), bar forms migrate to the north, or lagoonward on this rim (position of bars on 2018-8-3, 2019-8-6 and 2020-8-14 images on Figures 8A, C, E). In marked contrast, during the austral summer (broadly October-March), when swell arrive from the west, northwest, and north (Figures 3C, D), the same bars shift oceanward, to the south (see 2019-2-14 and 2020-3-1 images of Figures 8B, D). As they represent bar-island connections, the spits at islet ends mimic these patterns. The arcuate bar crests can migrate more than 100 m during these seasonal oscillations, with the dominant movement lagoonward and oceanward; marked migration of bars along the rim, e.g., east-west, is not evident. Data from 2018 to 2022 demonstrate that this trend recurs regularly, most clearly evident in the movie of Supplementary Data S1. Comparable, regular time-series data from marked El Nino phases (e.g., 2015/2016) are not available.
FIGURE 8
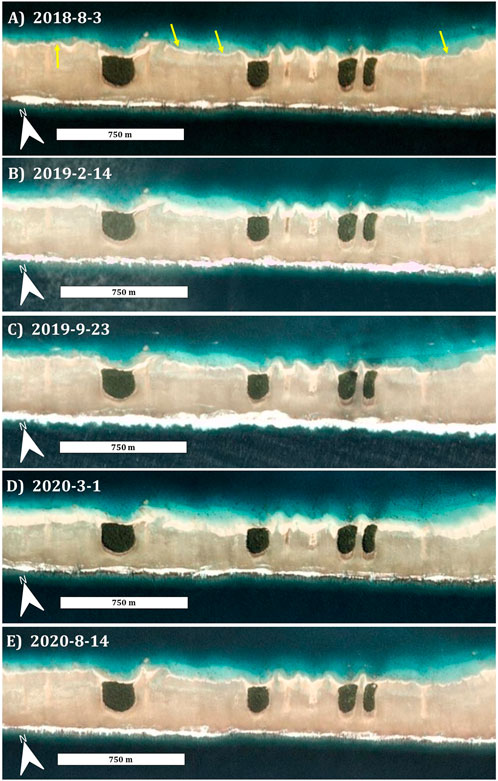
FIGURE 8. Planet images that capture changes in barforms, south Nukunonu (locations in Figure 1E). The area includes a well-defined bar crests near the lagoon slope; some are linear and others are more lobate. (A) 3 August 2018. (B) 14 February 2019. (C) 23 September 2019. (D) 1 March 2020. (E) 14 August 2020. These images, captured near the end of each season, show that bar crests which are near the lagoon slope shift oceanward, or to the south, during the boreal winter. Following the austral winter season, the bar crests shift back lagoonward (north). Supplementary Data S1 illustrates a video of changes in this area, and Supplementary Data S2 shows a movie from just east of here with ∼monthly resolution. Images Ⓒ2018–2020, Planet Labs PBC.
Considering the longer-term trends of islands on Nukunonu, of islands present in 1970, 17 were washed away by 2020, representing 55,725 m2 of land. All of these islands were on the west side of the atoll. In contrast, between 1970 and 2020, four new islands collectively forming ∼10,400 m2 of land, had appeared, and all lie on the south rim (e.g., Figure 7). Yet, in detail, individual islands have come and gone. Their numbers ranged from a high of 59 islands in 1970, to a low of 44 islands in 2003.
In terms of the total area of islands through time, Nukunonu Atoll as a whole has seen a general loss, representing a long-term net loss of 3.5% of its land between 1970 and 2020 (Figure 9). This averages to a loss of roughly the area of a football (soccer) pitch every 3 years. Nonetheless, although there is a general trend of loss, the trend is varied between 2003 and 2020, with some intervals (2003–2007) with net land gain. Similarly, individual islands can show distinct trends. For example, the inhabited islands of Nukunonu and Motuhaga document greater rate of loss over the long term than the other islands. Between 1970 and 2020, Motuhaga lost 8.7% of its land area and Nukunonu lost 7.3% of its island footprint (Figure 9).
FIGURE 9
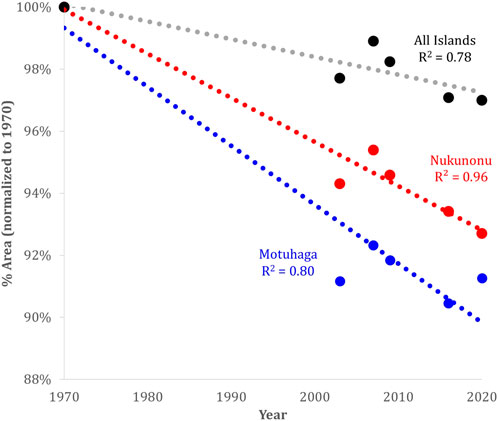
FIGURE 9. Areas of islands though time, Nukunonu Atoll. Data demonstrate that the two inhabited islands (Nukunonu and Motuhaga) are eroding at a long-term rate faster than the other islands, but that there is not a unidirectional trend.
Atafu Atoll Geomorphic Changes
Atafu, a smaller atoll, lies northwest of Nukunonu (Figure 1B). Its east- and northeast-facing reef rim includes numerous long islands, separated by only a few narrow ahaga, only two of which appear functional. The northern reef rim also has islands to the east and west, separated by a ∼750 m-wide opening with two small islets. From the populated island of Atafu Village southward, the west facing rim is largely rocky with only two islets larger than 0.25 km2. From another J-shaped islet on the atoll’s southwest corner to the hooked end of the long island (Na Hakea) on the eastern margin, the southern reef flat includes nearly 40 islets. The center includes larger islets, but to the east and west, the reef flat includes one chain of larger islets more oceanward of another series of smaller islets. These islets are all less than 0.5 km2, and are separated by ahaga less than 160 m wide.
Several areas on Atafu document the nature of changes between 2003 and 2020. For example, near the southern extent of the west-facing rim, one small islet present in 2003 was washed partly away by May 2005 (Figure 10), likely by Cyclone Percy which had just passed through this area in late February 2005. Similarly, the convex-east bar east of the islands expanded lagoonward, with several new dunes evident in the ahaga (Figure 10C). By 2008, a small sand bar had developed; in 2012, it was vegetated, and by 2020 it’s vegetated core had almost connected with the vestiges of the original islet (Figures 10D–G). During this same time, the vegetation of Te Puka, the small islet to the north, expanded eastward onto the post-cyclone beach. Thus, the net result of these dynamics is lagoonward migration of these islets.
FIGURE 10
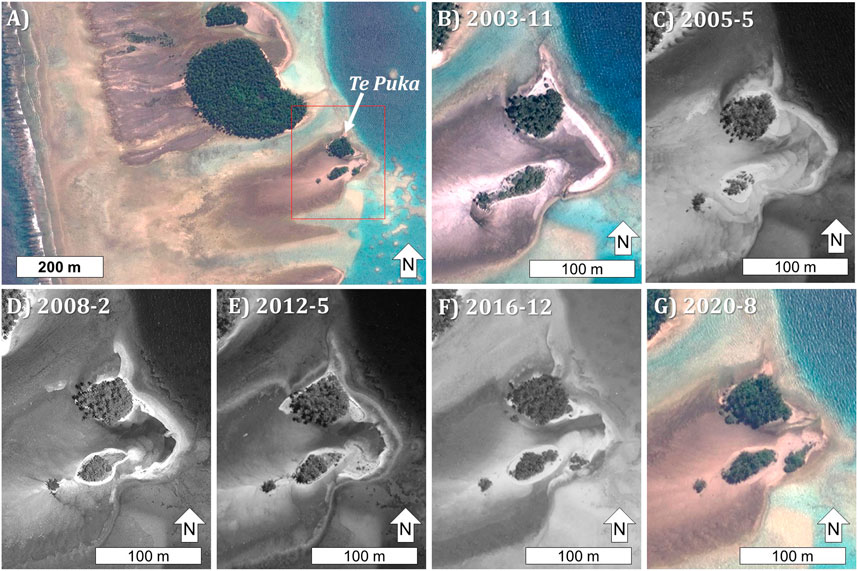
FIGURE 10. Changes along the southwest Atafu margin; Figure 1D shows location. (A) Overview image of focus area, around Te Puka. (B) 2003. (C) 2005, following passage of Cyclone Percy over the area. (D) 2008. (E) 2012. (F) 2016. (G) 2020. Thus succession illustrates how the cyclone split the small islet south of Te Puka, how the bar between that islet and Te Puka has shifted oceanward- and lagoonward, and that a new islet has formed. See text for discussion. Images Ⓒ SpaceImaging and DigitalGlobe, Inc.
The southern margin shows distinct patterns. At the coarsest scale, the oceanward islets are stable. Whereas the lagoonward chain of islets persist, their footprints change considerably (Figure 11A). In detail, in many of these islets, sandy beaches and bars present in 2003 (Figure 11B) migrate towards the open ocean to the south with some erosion of the stable core by May 2005 (e.g., associated with passage of Percy) (Figure 11C). By 2020, some islets had expanded subtly, such as Tafega, the western islet, on which vegetation has grown on the bar to the south of the 2003 stable core (Figure 11D).
FIGURE 11
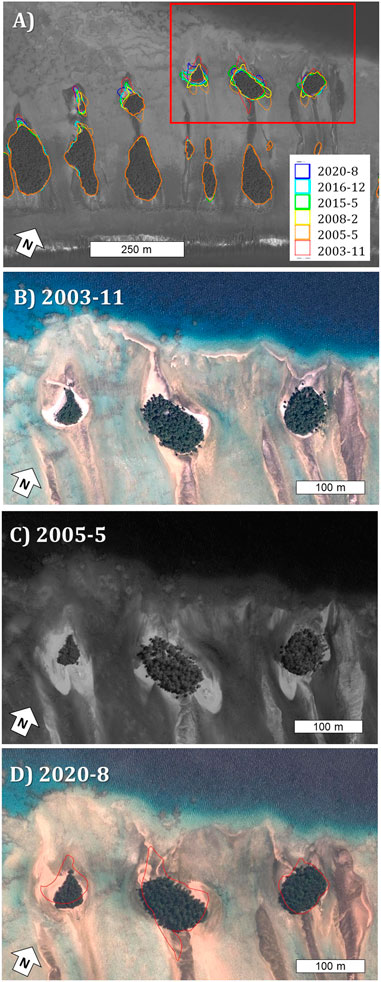
FIGURE 11. Changes along the south Atafu margin, in areas indicated in Figure 1D. (A) Overview image of focus area, with outlines of islands illustrated by color outlines. Note the two chains of islands, one more oceanward that includes very few changes and another more lagoonward that is more dynamic. Some of this latter group are illustrated in detail in B-D. (B) 2003. (C) 2005. (D) 2020. Note that between 2003 and 2005 (and the passage of Cyclone Percy from the west), the flanks of the islands moved oceanward (south), indicating offshore transport (cf. Figures 7B, C). Images Ⓒ SpaceImaging and DigitalGlobe, Inc.
The eastern rim, which includes fewer ahaga and more continuous islands, also includes patterns of dynamic lagoonward shorelines. Although the narrow ahaga include a paucity of the lobate sand-apron deltas common on Nukunonu, the island tips include change near the end of ahaga (Figures 12A, B), most commonly lateral shifting and stabilization of bars by vegetation. Oceanward, between 2003 and 2020, northwestward longshore transport extended the oceanward shoreline of Te Fue roughly 150 m, and occluded two of the ahaga, rendering them fully inactive (Figure 12B).
FIGURE 12
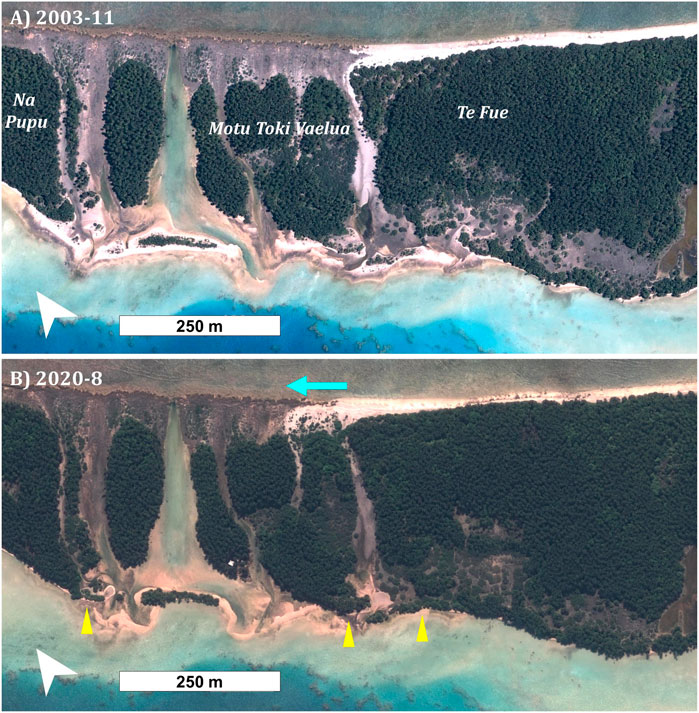
FIGURE 12. Changes along the east Atafu margin, in the area shown in Figure 1D. (A) 2003. (B) 2020. Note that the oceanward margin of Te Fue has migrated more than 100 m to the northwest (left, blue arrow), passing in front of two inactive ahaga. In the lagoon, several elongate bars have stabilized by vegetation (yellow arrows). Images Ⓒ SpaceImaging and DigitalGlobe, Inc.
Kiribati
Oceanography
An equatorial nation, Kiribati lies in the trade wind belt, but wind patterns are impacted markedly by ENSO variability. For example, during La Nina phases, winds are almost exclusively easterly (Figure 13A). They change to more northerly and westerly with shift to El Nino (Figure 13B). These patterns influence wind waves, with the vast majority (87%) of wind waves being easterly during La Nina phases, shifting to more northerly and westerly during El Nino phases.
FIGURE 13
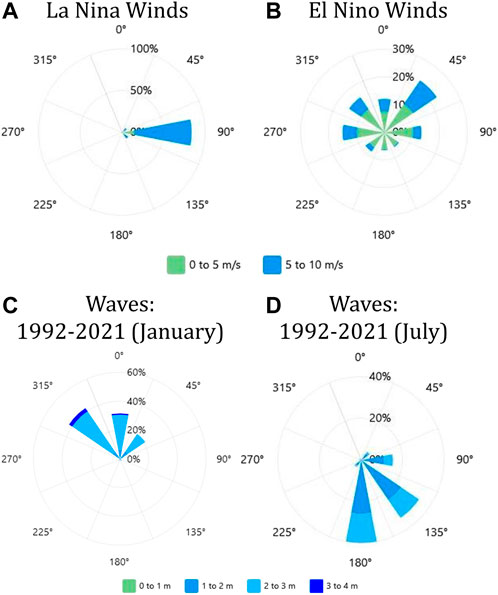
FIGURE 13. Synoptic wind and wave characteristics, Kiribati. Data are provided by Metocean Data Portal1. (A) Rose diagram of wind data, illustrating the direction and frequency from which the wind blows. Data here represent all months, during a La Nina phase (1 May 2010 to 30 April 2011). Note that winds are almost exclusively easterly, reflecting the Trade Winds. (B) Rose diagram of wind data. Data here represent all months, during an El Nino phase (1 May 2015 to 30 April 2016). Note that winds include more varied directions, including a pronounced westerly component. (C) Rose diagram of wave data during all Januarys between 1992 and 2021, documenting direction and significant wave height of peak waves, or those waves that include the most energy. These data illustrate that the most energetic waves during this boreal winter month include a northerly component. (D) Rose diagram of wave data during all Julys between 1992 and 2021, indicating direction and significant wave height of peak waves. During these austral winter months, waves included a dominant southerly approach direction.
Peak waves follow a somewhat different pattern, changing markedly each year with the seasons. For example, 30 years (1992–2021) of data document that in the austral summer (January), 43% of peak waves are from the northwest, 32% from north, and 21% from the northeast (Figure 13C). Waves with Hs >3 m also are from the northwest, north, or northeast (2.4%, 0.67%, and 0.38% of the total, respectively). In contrast, waves during the austral winter (July data, 1992–2021) are dominantly from the south (29%) and southeast (45%) (Figure 13D); no waves greater than 3 m Hs are resolved in the data.
Few cyclones strike Kiribati directly, and those that do impact only the out islands to the extreme north or south. There are no historical records of cyclones directly passing over Aranuka, Abaiang, or Abemama.
Abemama Atoll Geomorphic Changes
Analyses from Abamama utilize a depth of images, including historical images from 1945 to 1969, 4 very high-resolution images (2004, 2009, 2011, 2012), and Planet data since 2016 (Figure 2C). As Sengupta et al. (2021) recently documented general patterns of island shorelines of Abemama, the focus here is sediment transport dynamics and impact on spatial and temporal changes of some of the islands.
Like the atolls of Tokelau, Abemama includes more extensive islands on the east- and northeast-facing reef flat, although islands show westward growth at their termini (Sengupta et al., 2021). The lagoonward margins of islands in the southeast corner of the lagoon also include southward-migrating spits, evidence for longshore transport.
The southwest-facing reef rim contains a deep pass and only two islands, Bike to the center and Abatiku on the west point of the atoll. Between the main chain of eastern islands and Bike to the west, and the southwest pass on to Abatiku, lies several km of open reef rim less than 1,500 m wide. Rocky and reefal near the margin, this rim passes lagoonward to the sandy bottom of the reef sand apron. Of note, it includes a single, roughly linear chain of en echelon bars aligned parallel to the margin, yet set back ∼1,000 m towards the lagoon. North of these bars, across a distance of ∼200–300 m the sand apron passes gradually into the deeper lagoon; this area includes numerous subaqueous dunes evident on high-resolution data.
Time-series Planet data from 2020 to 2022 reveal that these bars and dunes are not static. Rather, the bars oscillate oceanward and lagoonward by up to 50–100 m seasonally as they migrate to the west/northwest. Specifically, during the austral summer (December-March), bars tend to migrate oceanward, reaching a southward extreme in austral fall (April/May) (Figure 14; please see also Supplementary Data S3) whereas during the austral winter (roughly June-September), bars shift lagoonward. As these seasonal offsets occur, the bars migrate more rapidly along the reef flat to the west and northwest at rates that can exceed 15 m/month. The subaqueous dunes lagoonward and downdip of the bars also document net westward migration.
FIGURE 14
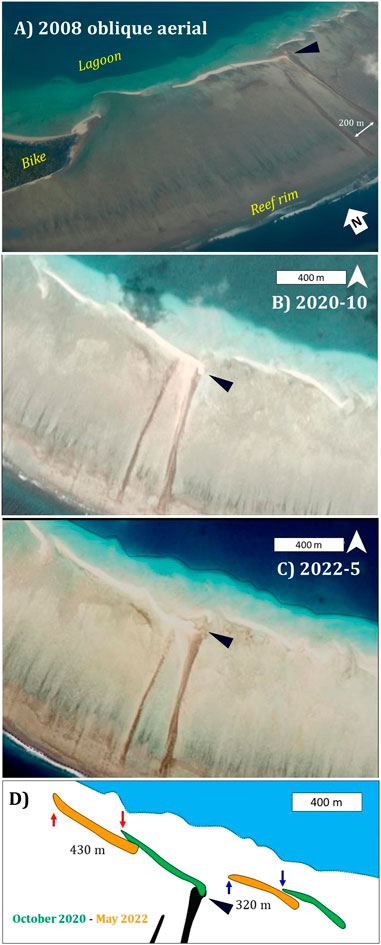
FIGURE 14. Changes along the south Abemama margin (for location, see Figure 1G). (A) Low-angle oblique aerial photo looking north-northeast. The reef near the margin passes to a sediment-covered bottom. Several bars are evident on the lagoonward side of the reef rim. Note the elongate dark strips to the right (east); these features are subtle rocky highs elevated 10s of cm above the adjacent seafloor. Black triangle here, and on parts B and C note the end of one of these features. (B) Planet image from October 2020. (C) Planet image from May 2022. (D) Cartoon indicating relative positions of individual bars in the time period between these two images, with October 2020 marked in green and May 2022 marked in orange. Note the marked along-strike migration (distances noted on the figure), and a more subtle oceanward-lagoonward shift. Supplementary Data S3 illustrates a video of changes in this area with ∼monthly resolution. Images Ⓒ2020–2022 Planet Labs PBC.
At the northwest end of this stretch of reef flat lies the islet of Bike. Comparison of imagery from 1945, 1969, and the 20th century reveals that Bike has expanded in area over this long term (Figure 15A). It grew from ∼0.38 km2 in 1945 and 1969 to ∼0.41 km2 in 2004, a growth in excess of 7%, although it shrunk ∼0.005 km2 between 2004 and 2012. The west, oceanward flank of the islet has been eroding, whereas the expansion of Bike has been on the eastern face of the island, where the sand apron bars connect. Here, the beach has prograded lagoonward by up to 100 m.
FIGURE 15
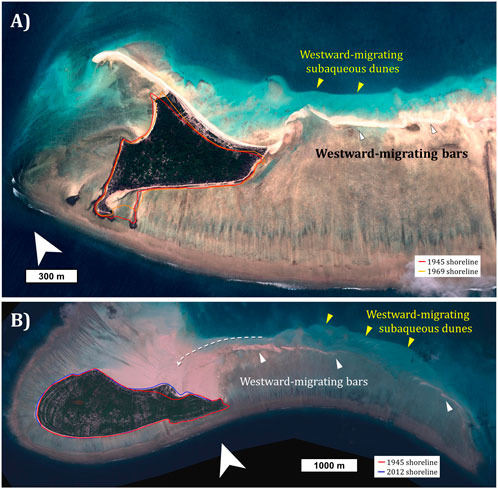
FIGURE 15. Morphology and changes along the south Abemama margin; see red boxes in Figure 1G for locations. (A) Southeastern rim, including the islet of Bike. Here, westward migrating bars supply the island with sediment. Comparison of 2014 shorelines (the image) with 1945 and 1969 shorelines reveal that the lagoonward flank of the island had expanded with the sediment supply. (B) Southwestern rim, including the islet of Abatiku. As near Bike, westward-migrating bars attach to the island and facilitate island growth in those areas. Images Ⓒ DigitalGlobe, Inc.
A broadly comparable dynamic is evident around Abatiku, on the southwest corner of Abemama. This islet has grown 6% in area (0.17 km2) since 1945, largely on the lagoonal margin, where westward-migrating bars connect to the island (Figure 15B).
Bars appear less well developed on the west-facing margin, on the flanks of the west pass. Those evident in Planet data appear to subtly migrate westward 2020–2022; seasonal shifts are not readily discernible on the data. Rather, more pronounced are the repeated sediment plumes extending off the platform to the west, consistent with leeward shedding.
Aranuka Atoll Geomorphic Changes
Aranuka is a roughly triangular atoll that lies less than 40 km to the west of Abemama (Figure 1B). It includes two long islands flanking the east-facing margin, Takeaeang on the west apex, and a small islet in the middle. Changes between 2005 and 2009 documented by Rankey (2011) provide a framework for analysis of 14 very high-resolution images (2005–2020) and Planet data.
Bikentakei, the islet near the center of the atoll, lies on the reef sand apron east of the tip of Tekaeang and west of the deeper lagoon. This area represents a general zone of convergence of currents from the northern margin and those from the southern margin (Wasserman and Rankey, 2014). Although older nautical charts (based on unknown data) document four small islets in this area, since 2005, the area has included but one vegetated island of roughly 0.1 km2.
Data from 2020 to 2022 document general west to southwest movement of bars that lie to the northeast to east of Bikentakei (Figure 16; please see also Supplementary Data S4). Several lie north of a channel and are separated from the island, but others to the east of the island suggest movement to the west, toward the island; no seasonal reversals are evident. Observations from older data and field observation suggest that comparable bars have supplied sediment to the eastern and southern island flanks since at least 2005 (see Figure 16; please also see Supplementary Data S5). The most pronounced changes in shorelines from 2005 to 2020 occur near the western tip, however, where the island footprint has expanded by more than 40–50 m (Figure 17). These patterns suggest that sediment added to the east and south by bar accretion is transported west by longshore currents. The net effect of these processes is expansion of the island at a relatively consistent amount (1,670 m2) annually between 2005 and 2021 (Figure 17, total growth of 27%, roughly 1.7%/year). The distal swell event that struck Aranuka in October 2012 (Wasserman and Rankey, 2014) had minimal impact on the island, although bars to the east of Bikentakei were shifted east by several meters (Supplementary Data S6).
FIGURE 16
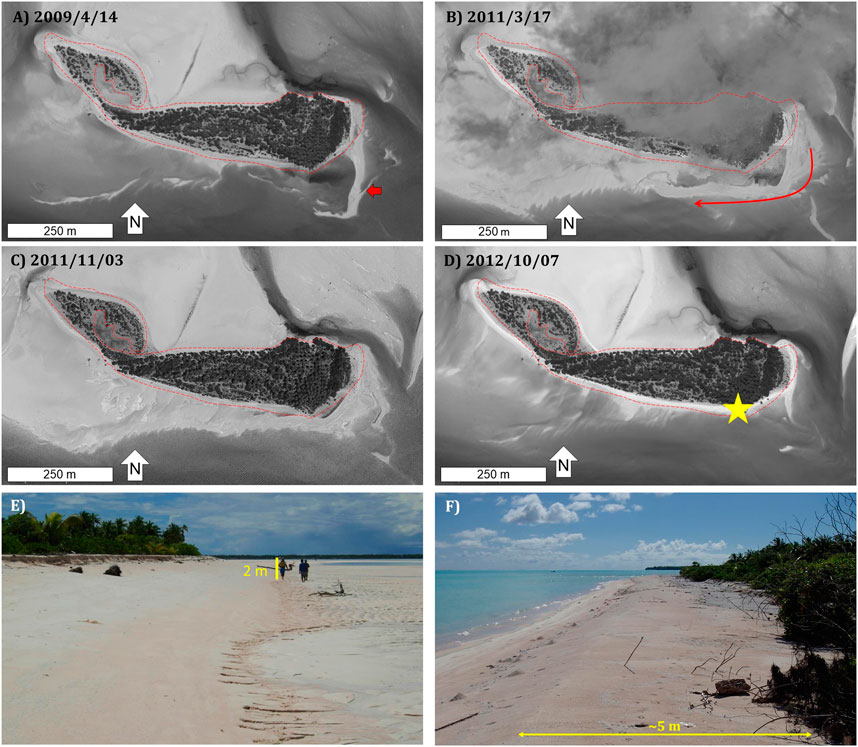
FIGURE 16. Spatio-temporal changes around Bikentakei, Aranuka (cf. Figure 1H for location). (A–D) High-resolution remote sensing images of changes 2009–2012. Outline of 2005 shoreline is represented by the dashed red line in each. (A) Image from April 2009. Red arrow emphasizes a nearshore bar to the east/southeast of the island. (B) March 2011 image. The bar, now wrapped to the south and west, is emphasized by the red line. (C) Data from November 2011. Bar has moved closer to the island. (D) October 2012 image. Bar has welded to the island. Approximate locations of photos of parts E and F noted with the yellow star. (E) 2008 field photo of south flank of islet, with small erosional scarp at the top of the beach that exposed roots of vegetation. Person noted is 2.0 m tall. Photo view is towards the east. (F) Field photo of same beach, looking west in August 2012 from the area with the 2008 scarp, reveals a broad sandy topset several m wide that passes to the foreshore. This accumulation represents accretion of the bar to the island (A–D). Images Ⓒ SpaceImaging and DigitalGlobe, Inc. Supplementary Data S4 illustrates a video of changes in this area with ∼monthly resolution.
FIGURE 17
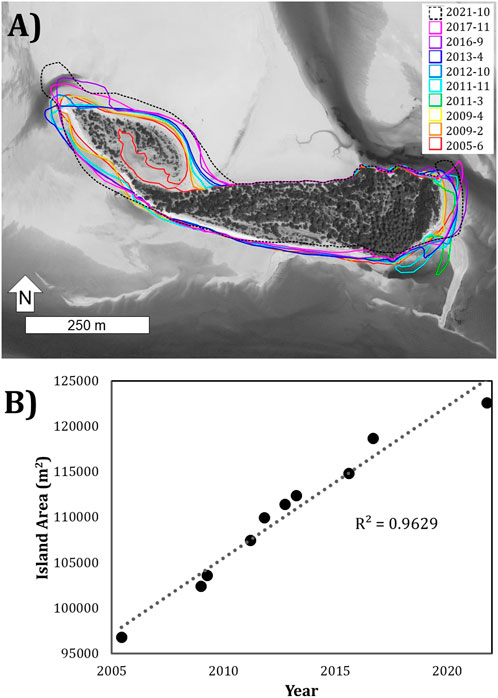
FIGURE 17. Synthesis of changes in extent of Bikentakei Island, Aranuka (cf. Figure 1H for location). (A) Island extent, mapped 2005–2021. The island, supplied by bars from the east, has grown most markedly to the west. Images Ⓒ SpaceImaging and DigitalGlobe, Inc. (B) Area of Bikentakei through time. The island area grows almost linearly through this time interval.
Another informative area lies near the southern tip of the main eastern island. Here, an exposed oceanward shoreline passes southwest to several pocket beaches, each isolated by rocky outcrops within 2 km of the southern terminus (Rankey, 2011) (Figure 18A). Planet data suggest some seasonal change, but even more pronounced dynamics are evident at multi-year scale. In detail, for example, the southernmost beach shows progressive counter-clockwise rotation from 2005 to 2009 to 2011 (Figure 18B); the 2011–2015 interval reveal clockwise beach rotation and reset (Figure 18C). Broadly comparable patterns are evident from 2015 to 2016 to 2021, with the northeast portion eroding 10 m, and the southwest beach prograding 14 m (Figures 18C–E). The embayed beach just north of this area (between yellow arrows, Figure 18A), as well as the non-embayed beach north of that (between red arrows, Figure 18A), showed similar rotation, albeit with different magnitudes.
FIGURE 18
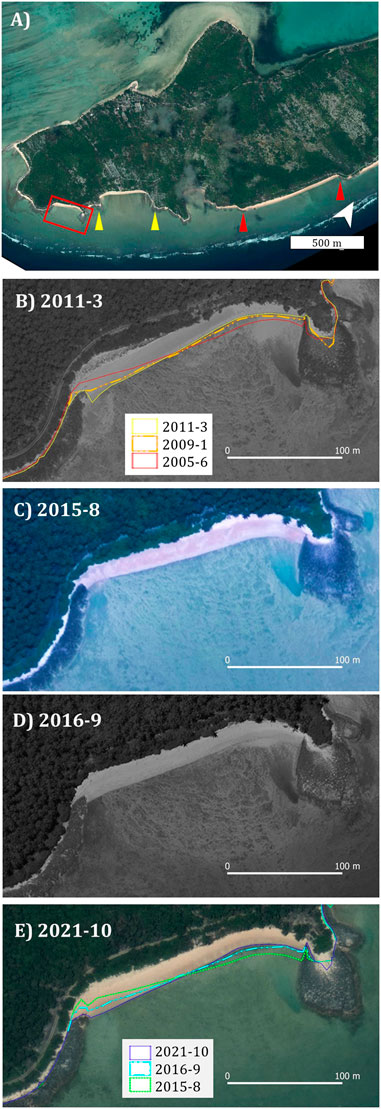
FIGURE 18. Morphology and changes along the oceanward margin, southeast Aranuka; see red boxes in Figure 1H for locations. (A) Overview. Three segments, outlined by the red triangles, the yellow triangles, and the red box, show similar shoreline trends. (B–E) Changes in the area of the red box of part A between 2011 and 2021. (B) 2011. The positions of the 2005, 2009, and 2011 shorelines are shown and document a counterclockwise rotation during this time. (C) 2015. (D) 2016. (E) 2021. The positions of the 2015, 2016, and 2021 shorelines, all in the austral spring, are shown in part E. As in part B, these also illustrate a counterclockwise rotation. See text for discussion. Images Ⓒ DigitalGlobe, Inc.
Abaiang Atoll Geomorphic Changes
The atoll of Abaiang lies north of Abemama and Aranuka (Figure 1C), where it forms a roughly rounded rectangular shape 32 km × 13 km in extent, elongated NW-SE (Figure 1F). The east-facing margins include narrow long islands, whereas those facing the northwest and southwest have more scattered, small islets. Near the northern point of the atoll, the reef flat reaches up to 1.5 km wide in broad, km-wide passes between islets. Here, as on the southern margin of Abemama, a rocky to reefal rim passes lagoonward to a sandy reef apron, and the apron includes a chain of roughly margin-parallel en echelon bars with shallow crests roughly 200–300 m from the deeper lagoon.
Planet time-series data reveal that these bars are also dynamic and moving. Specifically, they generally step lagoonward (south) during the austral summer, when the largest waves are from the north, and oceanward (north) during the austral winter. As on Abemama, however, these seasonal to-and-fro oscillations are superimposed on progressive westward movement of the bars (Figure 19; please see also Supplementary Data S7) at rates on the order of 10 m/month. Although we do not have very-high resolution data to characterize subtle changes, the islands do not appear to have expanded markedly since 1969 (Figure 19), suggesting that the islands are bypassed rather than adding sediment.
FIGURE 19
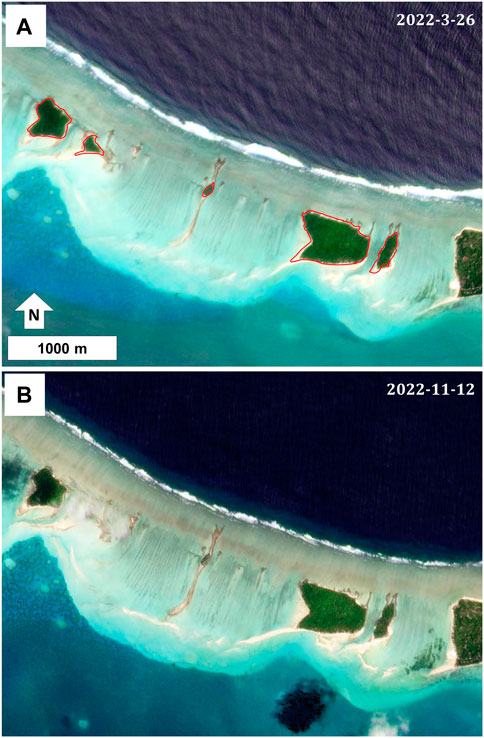
FIGURE 19. Planet data illustrating seasonal changes along the northwest margin of Abaiang. Location indicated on Figure 1F. (A) Image from March 2022; the outlines of island footprints in 1968 are shown in red. Note the swell from the northeast, and smaller wind waves from the east. (B) Image from November 2022, illustrating that these bars had migrated along-strike (to the west) and oceanward (to the north) during the austral winter. Although absolute direction of oscillation is similar to Abemama, the sense of oscillation is opposite, with lagoonward migration during the boreal winter, and oceanward shift during the austral winter. The islands, which have not changed markedly in extent since 1968, appear to largely be bypassed. Images Ⓒ2022, Planet Labs PBC. Supplementary Data S7 illustrates a video of changes in this area with ∼monthly resolution. See text for discussion.
Discussion: Sediment Dynamics
Shorelines erode or accrete as sediment is exchanged between a reef flat and its islands; island expansion requires supply of sediment, and following island erosion, sediment must go somewhere (McLean and Kench, 2015; Kench et al., 2018; Kane and Fletcher, 2020). In this context, a basis for predicting shifting shorelines lies upon an understanding of reef flat sediment transport processes (Hamylton et al., 2016). In some regards, because they are more sensitive to climate or oceanographic shifts than vegetated island cores, which by definition are stable (Ford, 2013), granular sediment of bars might represent ‘canaries in the coal mine,’ presaging any marked changes in island size or position, or at least being more responsive to variations in physical processes. Not surprisingly, each of the Tokelauan and I-Kiribati atolls indicate that bar forms are dynamic and changing.
Sand Apron Bars
Necessary Conditions
In most fundamental terms, sand apron bars accumulate in positions where tide, current and/or wave energy, integrated over some time period, becomes insufficient to transport part of the coarsest load either lagoonward or oceanward. Sand apron bars thus demonstrate a zone of convergence in which on-atoll flow is balanced by off-atoll flow, although short-term variations reflect the dynamics of this longer-term balance. Aside from this general necessary condition, the balance that shapes the sand apron bars are influenced by several, non-mutually exclusive factors.
First, the net balance is influenced by lagoonward-directed energy, and any spatial and temporal changes therein (e.g., Figure 3). On atolls, this energy is controlled by external factors such as local wind-generated waves, distal swell, and tides, as well as the occasional cyclone. More locally, given some external wave climate and tidal range, energy across the reef flat is controlled by bathymetric changes. Of particular note is the commonly abrupt deepening from the reef sand apron into the deeper lagoon on the lagoon-slope break. This increase in water depth decreases flow restriction for lagoonward-directed currents, slowing them, and thus decreasing sediment carrying capacity, favoring accumulation of sediment (Kench, 1998). In another scenario, reef sand apron expansion towards the lagoon with time (Purdy and Gischler, 2005) would create a setting on sand aprons with less pronounced on-platform sediment transport capacity (Ortiz and Ashton, 2019; Rankey, 2020). Finally, in a special case, the lateral flow expansion associated with lagoonward end of flow restriction between pre-existing islands (e.g., the ahaga) would decrease capacity.
Second, oceanward-directed energy also impacts the balance, and it too can have several sources. It may be derived from wind-generated waves from the lagoon. As these waves pass onto the shallowing lagoon slope they can break on the lagoonward flank of the reef sand apron. Local winds also can generate currents, and these currents can be directed at various angles towards or onto the reef sand apron. Alternatively, swell that strike one flank of the atoll can generate currents that drive water across the lagoon, forming oceanward-directed currents on other margins (Munk and Sargent, 1948; Atkinson et al., 1981). Finally, although microtidal in these areas, the tides do alternatively flood and ebb, raising and lowering water levels, that modulate wave energy and can generate off-platform directed currents (Wasserman and Rankey, 2014).
Other Controlling Factors
Any factor that influences this balance will impact bar character and position, and the observations of regular shifts in bars suggest that this balance is delicate and dynamic. The data herein suggest the important roles of various external influences: A) Seasonal changes of swell intensity and direction, B) Wind reversals (e.g., associated with ENSO shifts), C) Lagoonal currents/wind waves; internal factors play a role as well, including D) lagoon size and fetch and reef pinnacles or ridges; and E) island size and distribution.
The hindcast data for the Central Pacific (Figures 3, 13) reveal that the peak waves impacting these atolls seasonally change direction and intensity. During the austral winter, the most energetic waves are from the south, but shift to northerly during the boreal winter. These energetic waves represent swell generated by distant storms in the South Pacific/Southern Ocean (austral winter) and North Pacific (boreal winter).
These seasonal shifts in peak waves show close correspondence to many of the geomorphic shifts on I-Kiribati and Tokelauan atolls. For example, the lagoonward-oceanward shifts in bars on southeast Nukunonu, the south -facing reef rim of Abemama, and north-facing Abaiang rim follow the patterns of high wave energy. During the austral winter, with swell from the south, bars migrate towards the north; during the boreal winter, when swell are generated in the North Pacific, bars shift to the south. In terms of individual events, Wasserman and Rankey (2014) captured the impact of a North Pacific swell event in current meter data on the north reef flat of Aranuka. This event generated currents up to 90 cm/s on the sand apron and shifted bars up to 10 s of m in a few days (Supplementary Data S6). Hoeke et al. (2013), Hoeke et al. (2021) have described effects of swell events elsewhere.
Although these distal swell play a central role in oscillatory patterns, they may be modulated by other climatic factors. For example, the appearance of emergent bars in 2009 and 2016 (El Nino phases), and their disappearance by 2020 (a La Nina phase) on the southern Nukunonu reef flat is suggestive of ENSO influences, although the exact mechanism is unclear. Their appearance could be related to changes in distal swell direction or intensity, ENSO-driven sea-level change (Figure 2) that increases wave energy to form bars that then become emergent, or local shifts in winds that impact lagoonal waves or currents. The latter is consistent with the decimation of the bars at ahaga terminations associated with eastward (oceanward) shift in island footprint on Nukunonu’s east reef flat in 2015/2016 (Figure 4).
Although Planet data suggest minor shifts with changing seasons, the beaches of southeast Aranuka appear to show other, more marked shifts at longer timescales (Figure 18). The most pronounced changes are manifest as consistent counterclockwise rotation from 2005 to 2011, followed by a clockwise shift by 2015, and then another counterclockwise rotation from 2015 to 2021. Although this dataset is admittedly short, the timing of these variations corresponds with shifts associated with the Pacific Decadal Oscillation (PDO). The PDO was in a warm phase from 2002 to 2005, turned neutral until 2007, then entered a cool phase that persisted through 2013. In 2014, it shifted back to a warm phase. During warm phases, in the tropical Pacific, reduced winds are associated with warm sea-surface temperatures and weaker Walker circulation. The shift from weaker to stronger easterly winds would drive larger waves and could influence the counterclockwise beach rotation in southeast Aranuka; a shift back to weaker winds could reduce west/southwest transport and thus favor clockwise beach rotation.
Lagoon size and lagoon depth will influence the formation of lagoonal wind waves and wind-generated currents. For example, compared to Nukunonu, the smaller size of the Atafu lagoon and its reticulated reef may individually or collectively inhibit lagoonal energy, disfavoring development of a robust bar system, even though wind speed and direction are similar to Nukunonu. The southern margin of Atafu does include small bars (Figure 8), however these features are too small to be observed and documented with Planet data. Nonetheless, the data set is not sufficient to isolate and evaluate these parameters as controls. [Alternatively, distribution of islands on the rim, specifically the near-continuous islands on the north and east flanks of Atafu, may limit the influence of boreal-winter swell on southward-directed currents in the lagoon.]
Finally, once formed, bars represent an obstacle to flow. As such, they modify flow patterns from simple sheet-like flow on or off the rim to flow that is more focused vertically (over the bar) or laterally (around or along the bar). These dynamics can lead to feedbacks, and inherent instability, manifest as distinct patterns in bar morphology and position through time. Alternatively, bar positions may be influenced by pre-existing rocky outcrops (Figure 7, right side; rocky outcrops of Figure 15), but these features are not requisite to formation of the bars. Likewise, if these bars emerge and stabilize with vegetation to become proper islands, the bars that form their mobile flanks have locations that more constrained (Figure 4).
Relations Between Bars and Islands
Islands can arise from bars (Figures 7, 10) or bars can merge with islands to provide sediment, or conversely, islands can wash away and provide sediment that becomes bars (Figures 5, 7). Similarly, bars and islands respond to the same waves, tides, and currents, and interact dynamically to one another.
Once it emerges, the presence of even one individual island deflects flow around the obstruction, and developing wave shadow in its lee. For example, on Abemama the island of Bike shields the lagoon slope from ocean waves from the south (Figure 15). As the along-strike migrating bars encounter this energy shadow, the influence of ocean waves diminishes, and the bar bends oceanward, toward the island, driven by along-strike transport and energy from the lagoon (Figures 14, 15). This dynamic supplies the island with sediment in a position closer to the open ocean than the bar itself. Bikentakei on Aranuka reflects a different type of island energy shadow, as it shields the western part of the lagoon from wind and currents from the west. In this example, lagoonal waves from the east propagate onto the shallower reef sand apron, driving the bars to the west (Figure 16) and supplying the island with sediment.
Reef flats with multiple islands represent a special case. In the case of multiple islands deflecting wave- and tide-generated currents, flow can focus in passes between islands. These currents, strongest with offshore waves complimenting flood tides, transport sediment lagoonward and develop sand and rubble bars from the end of the islands where lateral flow restriction ends. These currents extend into the lagoon, where water also deepens and bed shear stress decreases, depositing sediment and building the sand-apron deltas (McKee, 1958; Stoddart and Gibbs, 1975). In this conceptualization, passes can range in scale from narrow ahaga or rawa (Figure 4) to 100s of m (Figures 4, 16) to km-scale (Figure 15), with the influence of islands on focusing flow progressively decreasing.
If waves approach at an angle other than normal to the margin, they can establish an along-strike flow that may create a component of longshore transport on island beaches. If the rate of alongshore transport is greater than the rate of on- or off-platform transport through ahaga/rawa or passes, the end of the island will expand along the rim, shrinking the pass. Once this process starts, it can be enhanced by positive feedback—as the island elongates, the water flux through the pass will be diminished and the island will be longer, favoring greater supply and less removal, ultimately blocking or filling the inlet (Figure 12) These processes can lead to progressively longer islands, and is consistent with the observation that the ends of long islands are commonly the areas of most growth (Rankey, 2011; Dawson, 2021; Sengupta et al., 2021).
Closed inlets can be breached by high-energy events, such as storms or swell (Stoddart and Fosberg, 1994). In this context, it is interesting to note that in Kiribati and Tokelau, the longest and most continuous islands occur on the eastern or northeastern margins. Geomorphic evidence suggests many of these elongate islands have ahaga that have been occluded, including some in historical times (Richmond, 1993; Stoddart and Fosberg, 1994; Rankey, 2011; Figure 12). The islands in these windward areas are influenced by wind waves generated by the persistent easterly trade winds (e.g., Figure 3A), but largely protected from high-energy swell arriving from the southwest or northwest, common approach directions (Figures 3, 13). As a result, although modest in energy, the persistent trade-wind-generated waves striking the eastern atoll flanks could generate longshore transport. This along-strike sediment movement would favor occluding ahaga/rawa and elongating islands (Duvat and Pilet, 2017), and these features could remain unbreached and preserved due to the relative paucity of high-energy events on these margins. These windward islands still include dynamic shorelines, however, with transport directions that change with season, ENSO, or even PDO (e.g., Figures 12, 18; Rankey, 2011; Sengupta et al., 2021).
Implications and Conclusion
By most estimates, the primary source of sediment on reef rims is the reef that lies on its oceanward side, which may supply up to 80% of sediment (Stoddart, 1969). This sediment is physically or biologically eroded, and transported towards the lagoon, driven by high wave energy from the open ocean. This lagoonward-transported sediment is captured in the reef sand apron, the shallow accumulation of sand and gravel, which commonly is interpreted as prograding towards the deeper lagoon. Over geological time scales, this reef sand apron may ultimately fill lagoons (Purdy and Gischler, 2005; cf. Vila-Concejo et al., 2013; Ortiz and Ashton, 2019; Rankey, 2020). Field studies that demonstrate systematic lagoonward changes in grain size and type and lagoonward flow vectors (e.g., Kench (1998), Vila-Concejo et al. (2013), Wasserman and Rankey (2014)) are consistent with this general dynamic.
The growth, stability, and erosion of atoll islands are related to sediment transport pathways, and many islands consist of sediment derived mostly from the reef. Nonetheless, in most basic terms, the very presence of islands on reef rims indicates that continuous, unabated transport into the lagoon is not the only transport dynamic. The examination of barform dynamics and their relations to island change at time scales from event, seasonal, to multidecadal herein suggests more complex and nuanced dynamics. Reef flats are not simple, unidirectional conveyor belts, but instead they can include oceanward or along-strike sediment transport. Some of these bars are persistent at roughly the same positions on the reef flat, without marked net lagoonward movement (Figures 4, 5, 7, 14, 18); these bars suggest that - over these time scales—there is a net balance or equilibrium between oceanward and lagoonward flux, and/or along-strike transport.
Of course, not every margin includes these persistent bars; many do not. Their absence is informative as well, for it argues for net on- or off-platform flow and sediment flux, which would tend to disfavor accumulation of sediment. This net transport could reflect the influence of quotidian processes, persistence of swell events impacting the margin, cyclones, or combinations. Not surprisingly, these reef flats without persistent bars also typically lack islands (e.g., north Nukunonu), or include areas with eroding or historically eroded islands (west Nukunonu, Figure 5).
The results herein demonstrate how these oceanographic factors—and thus the islands on reef rims—reflect a range of processes and contingent factors that mandate considering the atoll as a holistic system. That is, island dynamics are controlled not only by offshore wave energy, but also its balance with energy from the lagoon. This oceanward-directed energy in turn is influenced by lagoon size and depth, seasonal or multi-year wave-climate shifts, orientation relative to winds, presence of other islands, and other local contingencies. In this context, the heterogeneous response of islands to external forcing such as sea-level rise is not surprising, and may in fact be the norm (Duvat, 2018). If correct, these results emphasize the need to evaluate island change in a comprehensive context that considers the entire reef flat system, and one that forms as but a part of a whole atoll. Accurate consideration of how islands might change to any global change needs to assess these factors.
Reflections on Atoll Island Planning, Management and Policy
Recent ocean and coastal sustainability efforts have focused attention on the importance and utility of nature-based solutions. Recognizing that nature forms a critical component of risk management and reduction, as well as climate adaptation, these initiatives commonly focus on utilizing the inherent ability of coastal ecosystems such as mangroves, beach vegetation, and coral reefs to buffer infrastructure.
The results of this study—which focus on the scientific aspects of island dynamics—emphasize several points central to nature-based coastal resilience efforts and policy development on atoll islands. First, while not dismissing the importance of biological or ecological framework, the results show how understanding physical factors can be at least as important. Although all of the sediment of atolls ultimately is derived from organisms, it is movement of these granular materials by waves, tides, and currents that shapes island dynamics. Nature-based solutions are more than ecosystems.
The second point is that the islands form but one part of a very intricate, complex atoll system, and whose dynamics are linked to the reef, sand apron, and lagoon. The sediment supply to islands is related closely with the ecology and calcareous benthos. Solutions to challenges such as shoreline erosion should recognize these linkages, and step away from island-myopic, focused engineering solutions, such as seawalls, whose construction commonly lead to unintended consequences.
A third, related point is that island sustainability requires managing and maintaining sediment sources. The character of the natural systems documented here specifically illustrate the role and importance of sediment transport pathways, or perhaps better characterized as sediment transport ‘superhighways,’ in driving island migration, maintenance, and in some cases expansion. Successful application of nature-based solutions to island management requires understanding the science behind energy and material flux on atolls and how natural systems form resilient structures, even where facing sea-level rise.
A fourth point is that sand transport is three-dimensional. That is, although most sediment is derived ultimately from the shelf-margin reef, these atolls also include sediment transport from the lagoon towards the ocean and even along the rim as a sort of ‘longshore’ transport in bars even in areas with no shoreline. Simple assessments that consider wave energy normal to the margin and islands as sole driver of island change have the possibility of missing crucial components of supply or removal.
These points are illustrated clearly in two anecdotes that demonstrate how nature-based solutions can respect natural shoreline processes and dynamics. First is from Baurua, in southeast Aranuka, where an observant resident noticed that his lagoonal shoreline had been eroding, driving him to move his house landward twice prior to our visit in 2009. Remote-sensing data from between 2005 and 2021 (Supplementary Data S8, S9) reveal that his property was in the area in which a protuberance of sand and gravel moved along the shoreline, towards the lagoon. This feature was in front of his property prior to 2005, when he built the houses, but migrated to his neighbor’s property to the north, who by 2011 had established a kava bar on the migrating bar. These dynamics here should not be surprising, as the next village to the north is Bauriki, which translates to “back and forth,” reported by village elders to reflect the cyclic nature of shoreline erosion and accretion that had been occurring as long as people had lived there.
A second anecdote tells of coastline instability and erosion in the area of Tebunginako Village, Abaiang Atoll (elegantly documented in Webb (2006)). Here, the lagoonal shoreline of the village had been eroding for decades; the government of Kiribati held it up as an example of the impacts of climate change, a moniker still present on Wikipedia4. The villagers sought to understand why the shoreline was changing, as they had had spent considerable effort and money in mitigation efforts. Study of historical and aerial imagery, enhanced by interviews with elders, revealed the beach erosion common in and around the village, but showed that the sediment had been re-deposited in other areas along strike, where local beach accretion of 100 m occurred. Oral history documented that the area immediately south of Tebunginako, known as Terawabono, “the blocked channel,” was a rawa, or pass, that had been filled. The shoreline village, which had been north of the channel, was cut off from its supply of sediment, or at least the sediment flux had changed, and erosion represented adjustment of the shore to the blocked channel. As a result of this interpretation, the efforts to stop the re-adjustment of the shoreline were deemed to be unproductive by the villagers. They decided to rebuild inland and to avoid constructing seawalls. Thus, although climate change may have played a role, the proximal driver of the shoreline instability was sediment dynamics, and the policy solution was to respect those dynamics.
Clearly, this study raises more questions than it answers. Yet, as Pacific island nations like Kiribati and Tokelau struggle with the impacts of climate change on atolls and islands, “conventional” approaches like seawalls and groins have not adequately addressed the vexing challenges of island sustainability. Nature-based solutions—including exploring the physical as well as the ecological aspects—offer promising understandings and alternatives, and we hope that our study informs knowledge that provides productive policies.
Data Availability Statement
Original remote sensing data are licensed to the first author for this study. Licenses to those data are available and can be purchased from Maxar, DigitalGlobe, or IKONOS. The I-Kiribati historical images were made available for this study by the government of Kiribati and are not publicly released. The historical data from Tokelau are available via Land Information New Zealand (https://data.linz.govt.nz/). Planet data can be purchased or accessed by registered users from www.planet.com. Both wind and wave data were extracted using Meta-Ocean on Demand by DHI (www.metocean-on-demand.com/), and are available from that source. Shapefiles of island outlines are available from the authors upon reasonable request.
Author Contributions
ER conceived the study, acquired funding, performed fieldwork, analysed remote sensing data, wrote first draft of manuscript and compiled figures. TU performed fieldwork, QC’d and provided feedback on remote sensing analyses, provided indigenous insight, edited manuscript. MP performed fieldwork, QC’d and provided feedback on remote sensing analyses, provided indigenous insight, edited manuscript. All authors contributed to the article and approved the submitted version.
Funding
Funding for various aspects of this project has been provided by the Kansas Interdisciplinary Carbonates Consortium, the University of Kansas General Research Fund, US National Science Foundation (NSF EAR-0937699).
Conflict of Interest
The authors declare that the research was conducted in the absence of any commercial or financial relationships that could be construed as a potential conflict of interest.
Publisher’s Note
All claims expressed in this article are solely those of the authors and do not necessarily represent those of their affiliated organizations, or those of the publisher, the editors and the reviewers. Any product that may be evaluated in this article, or claim that may be made by its manufacturer, is not guaranteed or endorsed by the publisher.
Acknowledgments
We are grateful to many people who have assisted us in the field over the years, including Reenate Willy, Hannah Wasserman, Tutana Teitengaun, Mary Kate Rankey, Liz Rankey, Michele Mary, Daniel Doolittle, Raitiata Cati, Titeem Auatabu, as well as Tereke, Toom, and Mayor Taiki. Chris Paola and Diane Kamola provided helpful discussions at key points. We are grateful to DHI for access to and use of atmospheric and wave data from the Metocean Data Portal (https://www.metocean-on-demand.com/#/main) and The Global Tide Model (via MIKE 21). Tokelau historical imagery was sourced from Land Information NZ—reproduced under CC BY 4.0; thanks to Shannon McColley for assistance. Planet Labs Inc. provided most of the data used in the Supplementary Data movies as part of their Research and Education program. We are grateful to reviewers Hazel Beaumont and Anonymous and to Editor Natasha Dowey for their constructive suggestions on how to improve the manuscript.
Supplementary Material
The Supplementary Material for this article can be found online at: https://www.escubed.org/articles/10.3389/esss.2023.10077/full#supplementary-material
Supplementary Data S1 | (Video to accompany Figure 8) Video of changes of the reef rim of south Nukunonu between 2018 and 2022, documented in Planet data. The data reveal systematic seasonal shifts, with lagoonward (north) movement during the boreal winter and lagoonward (south) during the boreal summer. Images Ⓒ2018–2022 Planet Labs PBC.
Supplementary Data S2 | Video of images changes of the reef rim of southeast Nukunonu between 2018 and 2022, documented in Planet data. The data reveal systematic seasonal shifts, with lagoonward (north) movement during the boreal winter and lagoonward (south) during the boreal summer. Images Ⓒ2018–2022 Planet Labs PBC.
Supplementary Data S3 | (Video to accompany Figure 14) Video of time-series Planet data illustrating changes along the south margin of Abemama, 2020–2022. The area is indicated in Figure 1G. The data reveal pronounced along-rim migration of bars. These movements are associated with less pronounced, but systematic, seasonal shifts, with lagoonward (north) movement during the boreal winter and lagoonward (south) during the boral summer. Images Ⓒ2020–2022 Planet Labs PBC.
Supplementary Data S4 | (Video to accompany Figure 16) Video of time-series Planet data illustrating changes in the area of Bikentakei, Aranuka, 2020–2022. This series documents westward movement of bars that lie to the east of the islet. Images Ⓒ2020–2022 Planet Labs PBC.
Supplementary Data S5 | Movie of images of the area around Bikentakei, Aranuka. Images Ⓒ SpaceImaging and DigitalGlobe, Inc.
Supplementary Data S6 | Movie of images of Bikentakei, Aranuka, changes associated with a swell event in October 2012 (Wasserman and Rankey, 2014). Images Ⓒ DigitalGlobe, Inc.
Supplementary Data S7 | (Video to accompany Figure 19) Video of time-series Planet data illustrating changes along the northwest margin of Abaiang, 2019–2022. Location indicated on Figure 1F. As on the south margin of Abemama, these bars document a marked westward migration during this time, with seasonal oscillations. Although absolute direction of oscillation is similar to Abemama, the sense of oscillation is opposite, with lagoonward migration during the boreal winter, and oceanward shift during the austral winter. See text for discussion. Images Ⓒ2019–2022 Planet Labs PBC.
Supplementary Data S8 | Movie of changes along shoreline near Baurua, Aranuka, illustrating longshore transport, towards the lagoon.
Supplementary Data S9 | Images of changes along shoreline near Baurua, Aranuka, illustrating longshore transport, towards the lagoon.
Footnotes
1https://tidesandcurrents.noaa.gov/sltrends/sltrends_station.shtml?id=730-009
2https://psl.noaa.gov/data/climateindices/list/
3https://www.metocean-on-demand.com/#/main
4https://en.wikipedia.org/wiki/Abaiang; accessed 24 July, 2023.
References
Aslam, M., and Kench, P. S. (2017). Reef Island Dynamics and Mechanisms of Change in Huvadhoo Atoll, Republic of Maldives, Indian Ocean. Anthropocene. 18, 57–68. doi:10.1016/j.ancene.2017.05.003
Atkinson, M., Smith, S. V., and Stroup, E. D. (1981). Circulation in Enewetak Atoll Lagoon. Limnol. Oceanogr. 26, 1074–1083. doi:10.4319/lo.1981.26.6.1074
Aung, T., Singh, A., and Prasad, U. (2009). A Study of Sea-Level Changes in the Kiribati Area for the Last 16 Years. R. Meteorol. Soc. 64 (8), 203–206. doi:10.1002/wea.396
Barnett, J., and Adger, W. N. (2003). Climate Dangers and Atoll Countries. Clim. Change 61, 321–337. doi:10.1023/b:clim.0000004559.08755.88
Biribo, N., and Woodroffe, C. D. (2013). Historical Area and Shoreline Change of Reef Islands Around Tarawa Atoll, Kiribati. Sustain. Sci. 8, 345–362. doi:10.1007/s11625-013-0210-z
Cazenave, A., Dieng, H. B., Meyssignac, B., Von Schuckmann, K., Decharme, B., and Berthier, E. (2014). The Rate of Sea-Level Rise. Nat. Clim. Change 4, 358–361. doi:10.1038/nclimate2159
Dawson, J. D. (2021). Multi-Decadal Shoreline Morphodynamics of a Shelf-Edge Reef Island, Great Barrier Reef: Implications for Future Island Persistence. Geomorphology 392, 107920. doi:10.1016/j.geomorph.2021.107920
Duvat, V. K. E. (2018). A Global Assessment of Atoll Island Planform Changes Over the Past Decades. WIREs Clim. Change 10, e557. doi:10.1002/wcc.557
Duvat, V. K. E., and Pillet, V. (2017). Shoreline Changes in Reef Islands of the Central Pacific: Takapoto Atoll, Northern Tuamotu, French Polynesia. Geomorphology 282, 96–118. doi:10.1016/j.geomorph.2017.01.002
East, H. K., Perry, C. T., Beetham, E. P., Kench, P. S., and Liang, Y. (2020). Modelling Reef Hydrodynamics and Sediment Mobility Under Sea Level Rise in Atoll Reef Island Systems. Glob. Planet. Change 192, 103196. doi:10.1016/j.gloplacha.2020.103196
Ford, M. (2013). Shoreline Changes Interpreted from Multi-Temporal Aerial Photographs and High Resolution Satellite Images: Wotje Atoll, Marshall islands. Remote Sens. Environ. 135, 130–140. doi:10.1016/j.rse.2013.03.027
Goldberg, W. M., and Rankey, E. C. (2023). A Global Atlas of Atolls. CRC Press, 420. doi:10.1201/9781003287339
Hamylton, S. M., Carvalho, R. C., Duce, S., Roelfskma, C. M., and Vila-Concejo, A. (2016). Linking Pattern to Process in Reef Sediment Dynamics at Lady Musgrave Island, Southern Great Barrier Reef. Sedimentology 63, 1634–1650. doi:10.1111/sed.12278
Hersbach, H., Bell, B., Berrisford, P., Hirahara, S., Horányi, A., Muñoz-Sabater, J., et al. (2017). Complete ERA5 from 1979: Fifth Generation of ECMWF Atmospheric Reanalyses of the Global Climate. Copernicus Climate Change Service (C3S) Data Store (CDS). (Accessed 25 January 2023).
Hoeke, R. K., Damlamian, H., Aucan, J., and Wandres, M. (2021). Severe Flooding in the Atoll Nations of Tuvalu and Kiribati Triggered by a Distant Tropical Cyclone Pam. Front. Mar. Sci. 7, 1–12. doi:10.3389/fmars.2020.539646
Hoeke, R. K., McInnes, K. L., Kruger, J. C., McNaught, R. J., Hunter, J. R., and Smithers, S. (2013). Widespread Inundation of Pacific Islands Triggered by Distant-Source Wind-Waves. Glob. Planet. Change 108, 128–138. doi:10.1016/j.gloplacha.2013.06.006
Kane, H. H., and Fletcher, C. H. (2020). Rethinking Reef Island Stability in Relation to Anthropogenic Sea Level Rise. Earth's Future 8, e2020EF001525. doi:10.1029/2020ef001525
Kench, P. S., Ford, M. R., and Owen, S. D. (2018). Patterns of Island Change and Persistence Offer Alternate Adaptation Pathways for Atoll Nations. Nat. Commun. 9, 605. doi:10.1038/s41467-018-02954-1
Kench, P. S. (1998). Physical Controls on Development of Lagoon Sand Deposits and Lagoon Infilling in and Indian Ocean Atoll. J. Coast. Res. 14, 1014–1024. doi:10.1016/S0025-3227(97)00101-1
Masselink, G., Beetham, E., and Kench, P. (2020). Coral Reef Islands Can Accrete Vertically in Response to Sea Level Rise. Sci. Adv. 6, eaay3656. doi:10.1126/sciadv.aay3656
McKee, E. D. (1958). Geology of Kapingamarangi Atoll, Caroline Islands. Geol. Soc. Am. Bull. 69, 241–278. doi:10.1130/0016-7606(1958)69[241:GOKACI]2.0.CO;2
McLean, R., and Kench, P. (2015). Destruction or Persistence of Coral Atoll Islands in the Face of 20th and 21st Century Sea-Level Rise? Wiley Interdiscip. Rev. Clim. Change 6, 445–463. doi:10.1002/wcc.350
Munk, W. H., and Sargent, M. C. (1948). Adjustment of Bikini Atoll to Ocean Waves. Eos,Transactions, Am. Gcophysical Union 29, 855–860. doi:10.1029/TR029i006p00855
Ortiz, A. C., and Ashton, A. D. (2019). Exploring Carbonate Reef Flat Hydrodynamics and Potential Formation and Growth Mechanisms for Motu. Mar. Geol. 412, 173–186. doi:10.1016/j.margeo.2019.03.005
Owen, S. W., Kench, P. S., and Ford, M. (2016). Improving Understanding of the Spatial Dimensions of Biophysical Change in Atoll Island Countries and Implications for Island Communities: A Marshall Islands’ Case Study. Appl. Geogr. 72, 55–64. doi:10.1016/j.apgeog.2016.05.004
Planet Team (2017). Planet Application Program Interface: In Space for Life on Earth. San Francisco, CA. Available at: https://api.planet.com/ (Accessed August 1, 2023).
Purdy, E. G., and Gischler, E. (2005). The Transient Nature of the Empty Bucket Model of Reef Sedimentation. Sediment. Geol. 175, 35–47. doi:10.1016/j.sedgeo.2005.01.007
Rankey, E. C. (2011). Nature and Stability of Atoll Island Shorelines: Gilbert Island Chain, Kiribati, Equatorial Pacific. Sedimentology 58, 1831–1859. doi:10.1111/j.1365-3091.2011.01241.x
Rankey, E. C. (2020). Platform-Top Reef Sand Apron Morphodynamics and the Half-Empty Bucket. Sediment. Geol. 412, 105825. doi:10.1016/j.sedgeo.2020.105825
Richmond, B. M. (1993). Reconnaissance Geology of the Gilbert Group, Western Kiribati. South Pacific Applied Geoscience Commission, 65.
Roy, P., and Connell, J. (1991). Climatic Change and the Future of Atoll States. J. Coast. Res. 7, 1057–1075.
Sengupta, M., Ford, M. R., and Kench, P. S. (2021). Multi-Decadal Planform Changes on Coral Reef Islands from Atolls and Mid-Ocean Reef Platforms of the Equatorial Pacific Ocean: Gilbert Islands, Republic of Kiribati. Geomorphology 389, 107831. doi:10.1016/j.geomorph.2021.107831
Stoddart, D. R. (1969). Ecology and Morphology of Recent Coral Reefs. Biol. Rev. 44, 433–498. doi:10.1111/j.1469-185x.1969.tb00609.x
Stoddart, D. R., and Fosberg, F. R. (1994). The Hoa of Hull Atoll and the Problem of Hoa. Atoll Res. Bull. 394, 1–26. doi:10.5479/si.00775630.394.1
Stoddart, D. R., and Gibbs, P. E. (1975). Almost-Atoll of Aitutaki: Reef Studies in the Cook Islands, South Pacific. Atoll Res. Bull. 190, 1–158.
Stoddart, D. R., and Steers, J. A. (1977). “The Nature and Origin of Coral Reef Islands,” in Biology and Geology of Coral Reefs, Vol. IV – Geology II. Editors O. A. Jones,, and R. Endean (Elsevier B.V), 59–105.
Storlazzi, C. D., Gingerich, S. B., van Dongeren, A., Cheriton, O. M., Swarzenski, P. W., Quataert, E., et al. (2018). Most Atolls Will Be Uninhabitable by the Mid-21st Century Because of Sea-Level Rise Exacerbating Wave-Driven Flooding. Sci. Adv. 4 (4), eaap9741. doi:10.1126/sciadv.aap9741
Vila-Concejo, A., Harris, D. L., Shannon, A. M., Webster, J. M., and Power, H. E. (2013). Coral Reef Sediment Dynamics: Evidence of Sand-Apron Evolution on a Daily and Decadal Scale. J. Coast. Res. 65, 606–611. doi:10.2112/SI65-103.1
Wasserman, H. N., and Rankey, E. C. (2014). Physical Oceanographic Influences on Sedimentology of Reef Sand Aprons: Holocene of Aranuka Atoll (Kiribati), Equatorial Pacific. J. Sediment. Res. 84, 586–604. doi:10.2110/jsr.2014.50
Webb, A. P. (2006). “Analysis of Coastal Change and Erosion – Tebunginako Village, Abaiang, Kiribati. SOPAC (Pacific Islands Applied Geoscience Commission),”. Project Report 53. 10.
Webb, A. P., and Kench, P. S. (2010). The Dynamic Response of Reef Islands to Sea-Level Rise: Evidence From Multi-Decadal Analysis of Island Change in the Central Pacific. Glob. Planet. Change 72, 234–246. doi:10.1016/j.gloplacha.2010.05.003
Whistler, W. A. (1988). Ethnobotany of Tokelau: The Plants, Their Tokelau Names, and Their Uses. Econ. Bot. 42, 155–176. doi:10.1007/bf02858917
Keywords: climate change, shoreline, atoll, sediment transport pathways, Pacific
Citation: Rankey EC, Uriam T and Perez M (2023) Spatio-Temporal Dynamics of Sediment Transport Pathways: Sand Apron Bars and Islands of Tokelau and Kiribati, Central Pacific. Earth Sci. Syst. Soc. 3:10077. doi: 10.3389/esss.2023.10077
Received: 23 March 2023; Accepted: 28 August 2023;
Published: 03 October 2023.
Edited by:
Natasha Dowey, Sheffield Hallam University, United KingdomReviewed by:
Hazel Beaumont, University of the West of England, United KingdomStephanie Duce, James Cook University, Australia
Copyright © 2023 Rankey, Uriam and Perez. This is an open-access article distributed under the terms of the Creative Commons Attribution License (CC BY). The use, distribution or reproduction in other forums is permitted, provided the original author(s) and the copyright owner(s) are credited and that the original publication in this journal is cited, in accordance with accepted academic practice. No use, distribution or reproduction is permitted which does not comply with these terms.
*Correspondence: Eugene C. Rankey, grankey@ku.edu