
Morphological Model for Erosion Prediction of India’s Largest Braided River Using MIKE 21C Model
 Kuldeep Pareta
- Water Resource Department, DHI (India) Water & Environment Pvt Ltd., New Delhi, India
The Brahmaputra River has a dynamic, highly braided channel pattern with frequent river bar formation, making it morphologically very dynamic, especially during the monsoon season with high discharge and sediment load. To understand how the river changes over time, this study focused on two stretches: Palasbari-Gumi and Dibrugarh. Using 2D morphological models (MIKE-21C), the study aimed to predict erosion patterns, plan protective measures, and assess morphological changes over short-term (1 year), medium-term (3 year), and long-term (5 year) periods. Model runs were conducted to predict design variables across these river reaches, encompassing different hydrological scenarios and development-planning scenarios. The coarse sand fraction yielded mean annual sediment load predictions of 257 Mt/year for the 2021 hydrological year and 314 Mt/year under bankfull discharge conditions in the Palasbari-Gumi reach. In the Dibrugarh reach, the corresponding values were 78 Mt/year and 100 Mt/year. Notably, historical records indicate an annual sediment load of 400 Mt/year in the Brahmaputra River. The model results were compared to measurements from Acoustic Doppler Current Profilers (ADCP), showing good accuracy for flow velocities, flood levels, and sediment loads. Discrepancies in peak model velocities compared to ADCP measurements remain consistently below 9% across the majority of recorded data points. The predicted flood levels for the bankfull discharge condition exhibited an outstanding accuracy, reaching nearly 91% at the Palasbari-Gumi site and a notable 95% at the Dibrugarh site. This study has presented a valuable methodology for enhancing the strategic planning and implementation of river training endeavours, particularly within the dynamic and highly braided channels of rivers such as the Brahmaputra River. The approach leverages predictive models to predict morphological changes over a 2–3 years timeframe, contributing to improved river management.
Introduction
The Brahmaputra River is India’s largest river and has a braided channel pattern, carrying a large amount of suspended sediment and facing erosion challenges (Kleinhans, 2010; Pathan and Sil, 2022; Sarker et al., 2023). Floods and breaches of river embankments happen often due to changes in the river’s shape caused by high upstream flows and monsoon sediment (Pareta, 2022). Changes in the river’s shape are closely tied to how much water is flowing (Raff et al., 2023). Increased water flow leads to more erosion and sediment movement, raising the risk of flooding (Prasujya and Nayan, 2021). Over 60% of the people affected by this live in the Brahmaputra floodplain, and the consequences include the yearly loss of farmland and infrastructure like buildings, roads, and mosques (Ashmore, 2013). The riverbanks and nearby land easily erode and collapse during the wet season, causing seasonal flooding, loss of farmland, and homes (Métivier et al., 2016). This is particularly challenging for the people in Assam who are already dealing with poverty (Borah, 2022). Effective flood and erosion management can help reduce poverty, and to do this, it is important to understand the river’s hydrology and geography (Nicholas, 2013). This understanding relies on the collection, analysis, and organisation of various types of data about the river (Sarker, 2022).
A braided river is characterised by a network of multiple, interweaving channels that divide and rejoin, creating a distinctive braided appearance (Schuurman and Kleinhans, 2011; Gao et al., 2022; Pareta, 2023). Typically found in mountainous regions, these rivers transport relatively coarse and diverse sediments down steep gradients. The dynamic and intricate nature of braided river systems presents a set of unresolved questions (Sun et al., 2015; Pradhan et al., 2023). Natural braided channels result from a combination of factors, encompassing various flow patterns, properties of bed materials, intricate interactions between water flow and sediment transport, potential colonisation by vegetation, and human activities (Stevens et al., 2022; Nandi et al., 2023; Talukdar et al., 2023). The morphodynamic processes involved constitute an exceptionally intricate system, even without accounting for the influence of biological and societal factors (Williams et al., 2016b). The Brahmaputra River features a highly braided channel pattern with dynamic river bars (chars) that change in size and shape seasonally and annually (Bristow, 1987; Best et al., 2007). These bedforms, including large-scale features like bars and islands, and small-scale features such as ripples and dunes, significantly affect flow resistance and bed shear stress (Unsworth et al., 2020; Flemming, 2022; Jan et al., 2022). These bedforms indirectly influence flood and erosion patterns along the river by impacting water levels and flow velocity (Cilli et al., 2021). Regular monitoring of these river features is crucial in order to understand river characteristics and support mathematical modelling (Mosselman, 2004; Spasojevic and Holly, 2008; Williams et al., 2016a; Nandi et al., 2022). Monitoring involves tracking changes in bar position, height, width, and length through river surveys and multi-temporal satellite imagery (Pareta and Pareta, 2021). Satellite data is analysed using remote sensing software to assess sand bar shape, size, and movement over time (Prasujya and Nayan, 2021; Sah et al., 2022).
Previous literature indicates that the recent channel evolution of the Brahmaputra River is primarily influenced by regional tectonics and basin aggradation (Goswami, 1985; Lahiri and Sinha, 2012; Sarker et al., 2014; Czuba and Foufoula-Georgiou, 2015; Basumatary et al., 2019; Li et al., 2020; Cilli et al., 2021; Gao et al., 2022; Nandi et al., 2022; Saikia and Laskar, 2022; Nandi et al., 2023; Pradhan et al., 2023). These factors dictate the residence time of the river or its branches at different locations, with major anabranches and their angles of approach to the banks determining the erosional magnitude of adjacent areas (Coleman, 1969; Basumatary et al., 2019). The variability in erosional activities along different sections indicates the river’s preferred erosional sites. The morphodynamics of extensive braided river systems, like the Brahmaputra, contribute to high rates of bank erosion, an unstable braided belt, and fluctuating channel courses (Dutta et al., 2010). The considerable variability in discharge and sediment load leads to extensive erosion-deposition processes and complex bar dynamics (Sah et al., 2022), requiring exploration of spatio-temporal variability in bar dynamics to understand braided hydrodynamics (Nandi et al., 2022). Comprehensive data collection, both vertically and horizontally, is essential for understanding morphological changes in a braided river like the Brahmaputra (Sarker and Thorne, 2006; Li et al., 2020; Saikia and Laskar, 2022). Landsat satellite data, a valuable tool for tracking horizontal river alterations, is crucial for detecting dynamic changes and critical areas along the river (De Vriend, 2001; Tamiminia et al., 2020; Hemati et al., 2021). The accessibility of such data has been significantly enhanced with the introduction of Google Earth Engine (GEE), facilitating the operational use of remote sensing data (Gorelick et al., 2017; Mutanga and Kumar, 2019; Gomes et al., 2020; Moharrami et al., 2021; Johary et al., 2023). Gao et al. (2022) utilised GEE resources for accessing specific Landsat images to characterise the functional behaviour of the Upper Lancang River in the Qinghai-Tibet Plateau, China (>3,400 m elevation). Similarly, Lu et al. (2022) examined altered water and sediment flux due to glacier melting in the source region of the Yangtze River using Unmanned Aerial Vehicle (UAV) surveys and DEM data. Additionally, GIS systems like ArcGIS or QGIS are employed for the ongoing analysis of the river’s planform development (Czuba and Foufoula-Georgiou, 2015; Pareta and Pareta, 2021; Lawal et al., 2022; Velastegui-Montoya et al., 2023; Wu et al., 2023).
The vertical changes in the Brahmaputra River are monitored through river cross section surveys, conducted using ADCP (Acoustic Doppler Current Profiling) in water-covered areas or conventional cross section surveys. In dry sections of the river, surveys are performed using traditional topographical methods or airborne LiDAR (Light Detection and Ranging) surveys (Leyland, et al., 2017; Hu et al., 2023). Besides topographic and bathymetric data, acquiring data on discharge, sediment load (both bed load and suspended load), and the grain size distribution of bed and bank materials is crucial (Karmaker and Dutta, 2016; Ashley et al., 2020). The mentioned data types are essential for mathematical modelling tools like MIKE 21C, Delft2D-Rivers, CCHE2D, TELEMAC, etc., enabling numerical predictions of short-term and medium-term morphological behaviour (Takebayashi and Okabe, 2009; Khanh et al., 2023). Numerical simulations of fluvial morphodynamics are used by scientists and river managers to understand and predict the interactions between flow, sediment transport, and river form. Mathematical modelling supports bank erosion prediction, hydraulic and morphological development assessment, and the evaluation of riverbank protection and training works, both upstream and downstream (DHI, 2017; Pareta, 2020; van der Wal, 2020; Saadona et al., 2021; Das et al., 2022).
A number of articles have reviewed existing approaches to numerical modelling in fluvial geomorphology, and erosion prediction (Murray and Paola, 1994; Webb, 1995; De Vriend, 2001; Malmaeus and Hassan, 2002; Olsen, 2003; Mosselman, 2004; Jang and Shimizu, 2005; Doeschl et al., 2006; Coulthard et al., 2007; Jang and Shimizu, 2007; Spasojevic and Holly, 2008; Thomas and Chang, 2008; Takebayashi and Okabe, 2009; Tucker and Bradley, 2010; Schuurman and Kleinhans, 2011; Van De Wiel et al., 2011; Mosselman, 2012; Lajeunesse et al., 2013; Liedermann et al., 2013; Nicholas, 2013; Pirot et al., 2014; Sun et al., 2015; Williams et al., 2016b; Yang et al., 2017; Javernick et al., 2018; Kasprak et al., 2019; Weisscher et al., 2020; Saadona et al., 2021; Bürgler et al., 2022; Stecca and Hicks, 2022; Wang et al., 2022; Han et al., 2023; Khanh et al., 2023; Pareta and Pareta, 2023; Stecca et al., 2023). In recent years, there has been a growing adoption of physics-based numerical models for modelling fluvial processes (Webb, 1995; De Vriend, 2001; Jang and Shimizu, 2005; Tucker and Bradley, 2010; Sun et al., 2015; Weisscher et al., 2020; Khanh et al., 2023). However, limited efforts have been dedicated to modelling the evolution of braided rivers with their dynamic planform characteristics, and erosion prediction.
Of particular note, braided river modelling has experienced an innovation from simplified approaches to physics-based models (Murray and Paola, 1994; Jang and Shimizu, 2005). Webb, (1995) introduced a linear model to investigate migrating alternate bars and random walk models for predicting braided channel system geometry. Predicting long-term morphological changes in rivers, estuaries, coasts, and shelf seas is challenging due to unpredictable weather and non-linear morphodynamic processes, necessitating predictive models at the relevant scale (De Vriend, 2001). The model in question employs a convection-diffusion equation to calculate bed load and suspended sediment transport, adapting the grid for channel changes and validating against Colorado State University’s physical model studies (Olsen, 2003). However, cellular models, as noted by Doeschl et al. (2006), are limited in studying interactions between flow, sediment, and bed deformation, impacting their ability to simulate flow routines in natural braided rivers. Jang and Shimizu. (2007) addressed this limitation by employing a physics-based numerical model to replicate features of braided rivers with erodible beds and banks made from well-sorted sandy materials. While Coulthard et al. (2007) highlighted the prevalence of cellular models, which lack water depth, flow velocity, or flow momentum calculations, Thomas and Chang. (2008) and Spasojevic and Holly. (2008) provided comprehensive descriptions of one-dimensional (1D), two-dimensional (2D), and three-dimensional (3D) approaches to morphodynamic modelling. Takebayashi and Okabe. (2009) developed a numerical model exploring the impacts of vegetation and unsteady flow on braided stream dynamics. Tucker and Bradley. (2010) modelled the morphological evolution of 2D scarps using moving grains, while others, such as Malmaeus and Hassan. (2002) and Lajeunesse et al. (2013), employed grains to model bedload transport. Schuurman and Kleinhans. (2011) applied a two-dimensional morphological model to generate braided bar patterns in an idealised channel, using Engelund-Hansen’s total load formula for sediment load calculations. Van De Wiel et al. (2011) discussed the application of models to understand and predict evolution in response to environmental change, and Mosselman. (2012) provided a review within the context of gravel-bed rivers.
Nicholas. (2013) introduced a morphodynamic model incorporating two grain size fractions (sand and silt) to simulate the co-evolution of rivers and floodplains within a comprehensive framework for modelling both meandering and braided rivers. Liedermann et al. (2013) employed a fully 3D model to calculate sediment particle movement in the Danube River. Pirot et al. (2014) proposed a novel method for generating successive topographies in braided river systems, influencing river-aquifer interactions, and impacting ecosystems, flood risk, and water management. Williams et al. (2016b) suggested that physics-based models offer more detailed process information, enhancing the understanding of natural braided rivers by better representing hydraulic and morphodynamic processes. They emphasized that a 2D physics-based model holds the greatest potential for simulating braided river morphodynamics at temporal and spatial scales relevant to investigations related to river mechanisms and management. Yang et al. (2017) developed a 2D physics-based model to simulate braiding processes and morphodynamic changes in rivers, incorporating hydrodynamic and sediment transport principles, bed morphology deformation, and a TVD (Total Variation Diminishing) scheme for predicting trans-critical flows and bed morphology deformation. Javernick et al. (2018) examined Delft3D, a 2D model, using observed bed load transport data from braided river flume experiments, focusing on shear stress calculations to predict sediment fluxes for morphological simulations in a fixed bed model configuration. Kasprak et al. (2019) indicated that numerical models predict channel evolution, overcoming challenges in field observation timescales, and the model successfully simulated 80% of observed braiding mechanisms through parameterised bed processes. Weisscher et al. (2020) investigated channel evolution, highlighting that numerical models face limitations in oversimplification or computational constraints, hindering their application scope. Stecca and Hicks. (2022) studied braiding channel dynamics through numerical simulations, observing hints of ergodic behaviour, with time statistics converging to ensemble statistics across different runs. Spasojevic and Holly. (2008), and Bürgler et al. (2022) demonstrated that physics-based numerical models, ranging from one-dimensional (1D) to three-dimensional (3D), can nearly completely represent the complicated processes in natural braided rivers. A 1D model, as suggested by Weisscher et al. (2020), cannot adequately simulate the lateral flow necessary for braiding, whereas a two-dimensional (2D) model can make spatially explicit predictions of flow depth, velocity, and bed shear stress, incorporating the influence of topography in steering flow and allowing lateral variation in water surface elevation. Wang et al. (2022) proposed a one-dimensional model simulating bed and bank changes in the Lower Yellow River’s braided reach during flood seasons, integrating modules for flow-sediment transport, bed deformation, and bank erosion/accretion. Han et al. (2023) successfully simulated the large-scale braided system evolution in the middle Yarlung Tsangpo River, China, using a physics-based model with D50 = 0.23 mm, capturing both microscopic and macroscopic changes, including the formation of a high-intensity braided reach from an initial lateral flatbed under lateral valley confinement. Khanh et al. (2023) used the Mike 21FM hydrodynamic model to assess sediment transport changes in the Tien River, crucial for understanding riverbed evolution in the Cao Lanh district.
The specific objectives of this paper are: (i) to undertake short to medium-term prediction of bank erosion, specifically to facilitate strategic planning of river training methodologies, (ii) to assess the hydraulic and morphological transformations transpiring within the Palasbari and Gumi reach, regions severely influenced by erosion along the southern bank, and (iii) to evaluate the ramifications of extant river training interventions on the immediate environs, encompassing both upstream and downstream zones.
About the Study Areas
The development of the morphological model for erosion prediction involves the selection of two highly active and morpho-dynamically significant reaches along the Brahmaputra River. These reaches are specifically located in Palasbari-Gumi, situated in the middle-western region of Assam, and Dibrugarh, located in the northeastern part of Assam. This choice is based on the pronounced erosion dynamics of these areas, which are crucial for this research. The Palasbari-Gumi reach extends from latitude 26.099°N to 26.2636°N, and longitude 91.1364°E to 91.5868°E, while the Dibrugarh reach extends from latitude 27.3748°N to 27.6640°N, and longitude 94.7464°E to 95.1605° E (Figure 1). Administratively, the Palasbari-Gumi reach spans across four districts, namely, Barpeta, Nalbari, Kamrup, and Dispur. In contrast, the Dibrugarh reach is situated solely within the Dibrugarh district of Assam. In terms of topography, these regions exhibit generally flat but uneven terrain. Additionally, these areas belong to an agroclimatic sub-zone, which is distinguished by a prevalent tropical humid climate. The regional climate exhibits distinct seasons, including summer (Mar-May), monsoon (Jun-Sep), and cool winter (Oct-Feb). Temperature ranges between 12°C and 33°C, with maximum temperatures peaking in August. Rainfall commences in April, continues through August, and is characterised by an annual range of 1,500 mm–2,700 mm.
FIGURE 1
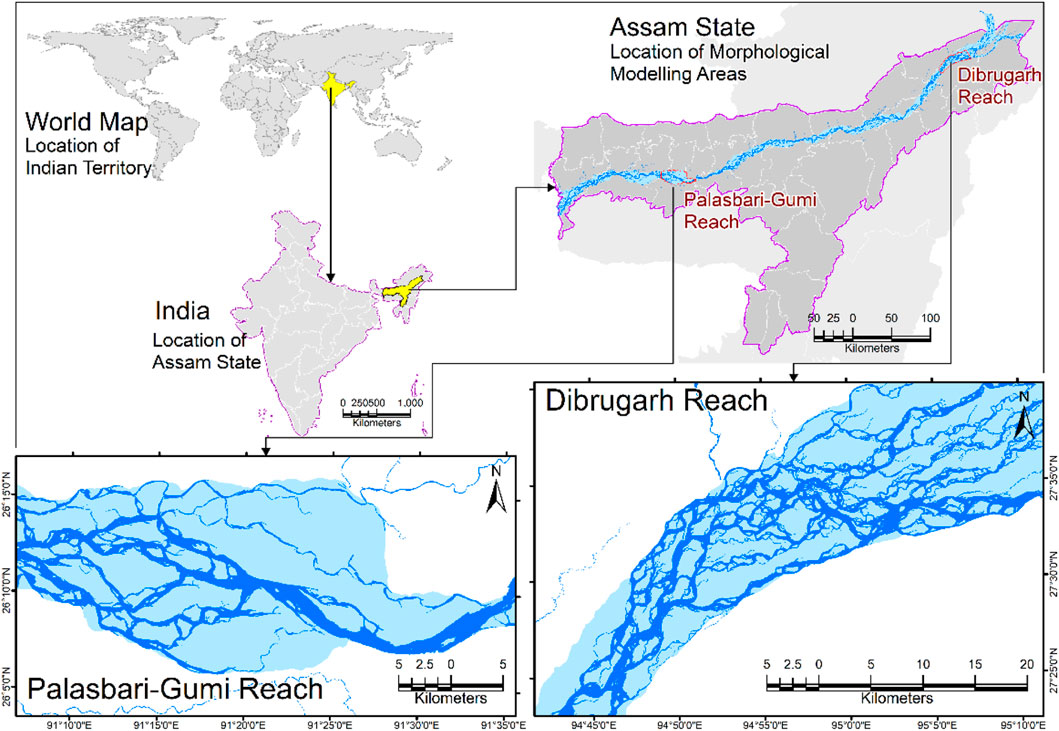
FIGURE 1. Location map of study areas.
Study Material and Data Collection
The data have been collected from secondary as well as primary sources for the Palasbari-Gumi reach to fulfil the objectives of the study. The secondary datasets included rainfall data from fixed stations, river cross-section measurements, river water level measurements, river discharge data, bathymetry data, topography data, grain size characteristics data, ADCP (Acoustic Doppler Current Profiler) velocity measurements, available high-resolution DEM (digital elevation model), and satellite images. Primary datasets such as topography and bathymetry data were also used to complement the analysis and modelling work.
Shuttle Radar Topography Mission (SRTM) digital elevation model (DEM) data, featuring a spatial resolution of 30 m, was obtained from1 for the year 2014 to cover the study areas. This dataset played a crucial role in the validation of cross-sectional topographic data and the comprehensive analysis of the topographical characteristics within the designated study.
The existing cross-sectional data was sourced from the Water Resource Department of Assam, accessible at.2 Subsequently, these cross-sectional datasets were augmented by incorporating the available bathymetric data, enhancing the overall dataset for the study areas.
Observed water level data spanning from 2018 to 2022 were sourced from the Central Water Commission (CWC) and accessed through.3 The accuracy and reliability of these water level measurements were cross-validated using precipitation data obtained from TRMM (Tropical Rainfall Measuring Mission) and GPM (Global Precipitation Measurement) through numerical simulations. This process ensured the quality and consistency of the water level records in the study.
Precipitation data spanning from 2000 to 2022 were sourced from the Tropical Rainfall Measuring Mission (TRMM), specifically the TMPA (TRMM Multi-satellite Precipitation Analysis) 3B42 v7 dataset, known for its fine 0.25° × 0.25° spatial resolution. This valuable meteorological data was acquired through the National Aeronautics and Space Administration (NASA) and can be accessed at.4
Rainfall data from 2014 to 2022, featuring a spatial resolution of 0.1° × 0.1°, was sourced from the Global Precipitation Measurement (GPM) project. This dataset, renowned for its fine spatial granularity, was obtained through the National Aeronautics and Space Administration (NASA) and can be accessed at.4
Rainfall data spanning from 1980 to 2022, characterised by a spatial resolution of 0.25° × 0.25°, was procured from the Global Forecast System (GFS). This extensive dataset was acquired through the National Oceanic and Atmospheric Administration (NOAA) and is accessible at.5
Discharge data spanning from 2017 to 2022 was sourced from the Global Flood Monitoring System (GFMS), accessible at.6 This dataset, which encompasses both water level and discharge information, served as a foundational component for defining the hydrological boundaries within the 2D model.
Bathymetry, grain size characteristics, and ADCP velocity measurements data for the year 2018 were acquired from a report authored by the Institutional Strengthening Component (ISC) of the Flood and River Erosion Management Agency of Assam (FREMAA), which operates under the Government of Assam. This dataset was accessed through the official website of FREMAA at.7
Most recently, topography and bathymetry data were gathered through a primary survey conducted in the year 2022.
Methodology
Model Framework
The 2D model of the Palasbari-Gumi reach extends over a distance of 57 km, encompassing the entire width of the Brahmaputra River. It commences at the Saraighat Bridge in Guwahati and concludes at Bahari in the north bank, with the south bank extending to Sontoli in the Kamrup district. Notably, the width of the Brahmaputra River at Saraighat Bridge is a mere 1.49 km, while approximately 37 km downstream, in the vicinity of Palasbari-Gumi, the river widens significantly to 18.83 km, marking one of the most substantial variations in river width globally (Pareta, 2021). Similarly, the 2D model for the Dibrugarh reach spans a length of 43 km, covering the complete breadth of the Brahmaputra River. This modelling domain encompasses the stretch from the Bogibeel Bridge near Dibrugarh to a point 43 km upstream at Rohomaria.
Set-Up Computational Grid
The 2D model for the Palasbari-Gumi reach spans a length of 57 km and was constructed using 148,200 computational cells within a curvilinear orthogonal grid system, employing MIKE 21C modelling technology. This model comprehensively covers the full width of the Brahmaputra River, which spans approximately 20 km. Along the 57 km length of the river, there are 570 computational cells, while 260 cells are arranged across the river’s width (Figure 2A).
FIGURE 2
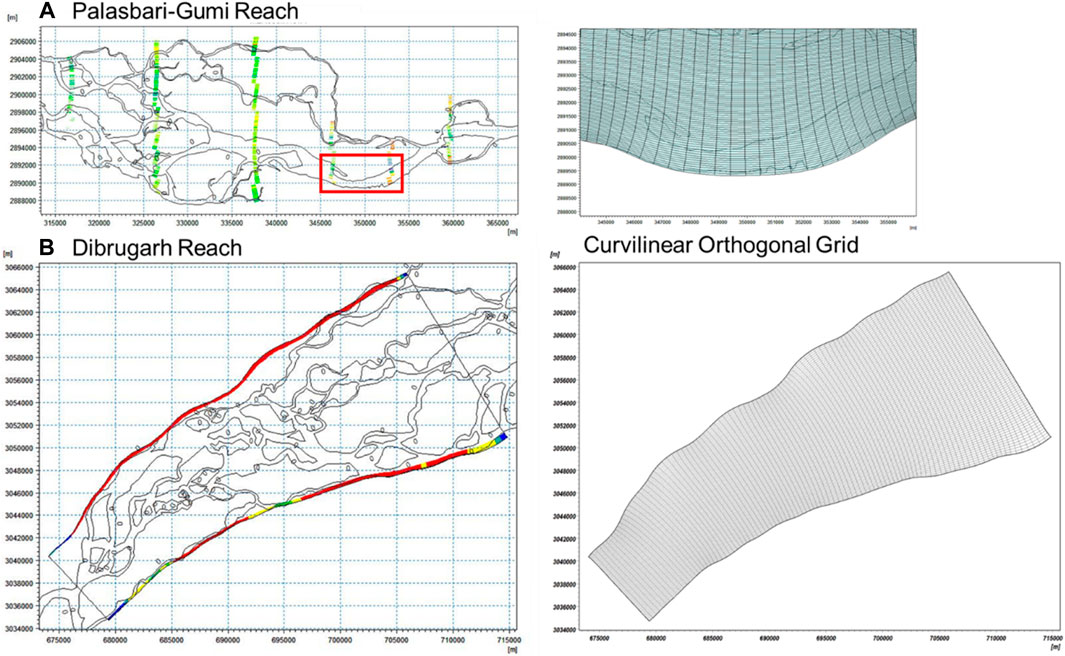
FIGURE 2. Model grid for the model domain of the Brahmaputra River at (A) Palasbari-Gumi reach, and (B) Dibrugarh reach.
Conversely, the 2D model for the Dibrugarh reach is based on 21,660 cells within a curvilinear orthogonal grid system using MIKE21C. This grid covers a 43 km stretch of the river and encompasses the complete width of the Brahmaputra River. The cell size varies, with the maximum cell dimension along the river’s length at 571 m and a minimum of 315 m. The resolution across the width varies between 65 and 190 m (Figure 2B). The finer resolution across the width is of paramount importance, especially in evaluating phenomena such as bend scour, obstruction scour, and bank erosion. Given the river’s width and the presence of anabranches, this resolution is deemed sufficient to simulate bend scour, various forms of scours, and bank erosion. The computational resolution for both models is considered satisfactory for the intended purposes.
Bathymetry Generation
The bathymetry data for the study areas encompassed by the 2D model have been sourced from available data repositories described in Section Study Material and Data Collection. These data sources primarily cover the navigational sections of the main channels and certain deep anabranches. Additionally, data from the Water Resource Department’s (WRD) cross-sections within the Palasbari-Gumi reach (CS = 22 to CS = 15) and the Dibrugarh reach (CS = 57 to CS = 62) are at our disposal. Utilising these limited but valuable resources, the bathymetries have been generated for both reaches, visually represented in Figure 3.
FIGURE 3
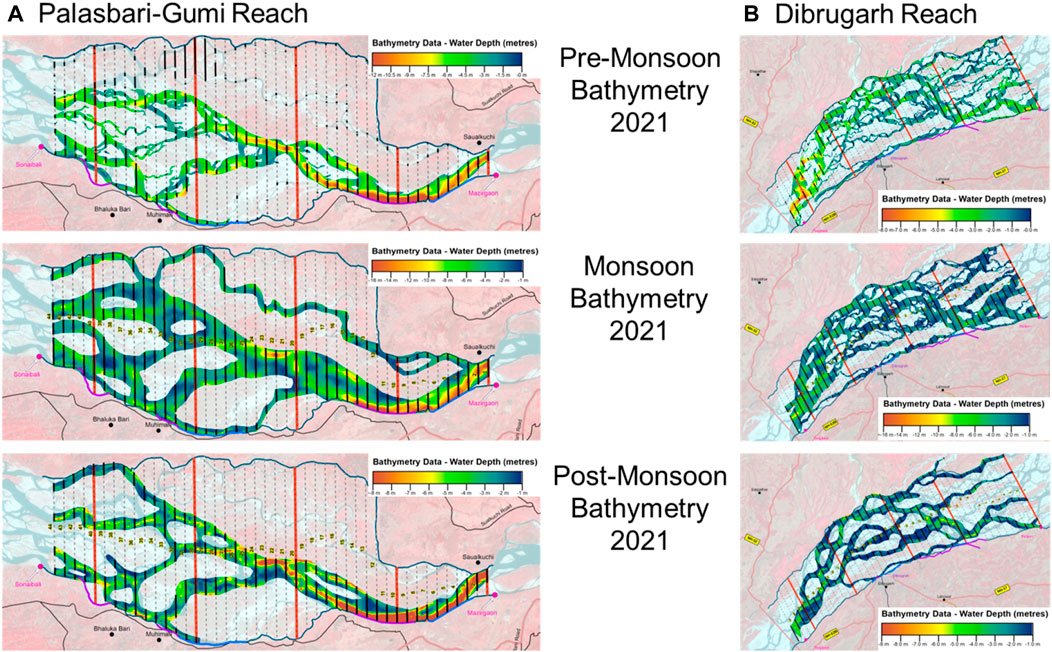
FIGURE 3. Bathymetry for model domains for (A) Palasbari-Gumi reach, and (B) Dibrugarh reach.
It is important to note that the cross-sections were primarily employed for estimating the formation levels of relatively stable and permanent islands. This was undertaken with the assumption that changes in the formation level of these stable islands have been minimal, particularly over recent years. It is imperative to emphasise that the model’s bathymetry has been constructed with the constraints of very limited available bathymetric data. Nonetheless, the present models have demonstrated a high degree of efficacy in describing the hydraulics and morphological developments within the study area. They have successfully generated essential hydraulic and morphological design parameters, which are pivotal for the planning and design of river training works. Such works encompass a range of activities including revetment work, groynes, dikes, and dredging for navigation purposes, among others.
Boundary Conditions
Hydrological boundaries for the 2D model simulation were established using discharge and water level data. Discharge data sourced (described in Section Study Material and Data Collection) from the Pandu gauging station were employed as the inflow data at the upstream boundary of the Palasbari-Gumi reach model, positioned approximately 3 km downstream from the Pandu location. On the other hand, water level data was implemented at the downstream boundary, situated about 54 km downstream from Pandu. To ensure the accuracy and reliability of the model, a calibration process was executed using data from the 2021 hydrological year, as illustrated in Figure 4A. Following calibration, the model’s performance was further validated using data from June 2022. The available data encompassed discharge information from the Pandu gauging station for the entire 2021 hydrological year and water level data at the downstream boundary of the 2D model. Discharge values were derived from a rating curve that correlated water levels at the Pandu location.
FIGURE 4
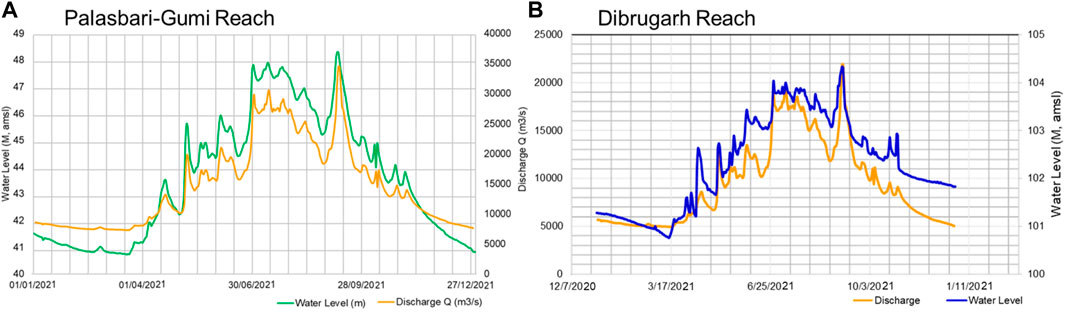
FIGURE 4. Inflow discharges at the upstream boundary and water level at the downstream boundary of the 2D Model, (A) Palasbari-Gumi reach, and (B) Dibrugarh reach.
It is important to note that discharge data for Dibrugarh were initially unavailable. To address this gap, discharge data for Dibrugarh were temporarily derived from the data collected at the Pandu gauging station. Subsequently, the model was refined with observed discharge data obtained from the WRD department of Assam. Furthermore, water level data for the year 2021 at the Bogibeel station were successfully collected, as indicated in Figure 4B. The boundary of the model domain is positioned approximately 7 km upstream from the Bogibeel Bridge. To support the modelling process, water level data from the Bogibeel location were extended, taking into consideration the changes in the bed level slope. Similar to the Palasbari-Gumi reach, model calibration was meticulously conducted using data from the 2021 hydrological year.
Grain Size Characteristics
Grain size data, collected in 2018 from available sources as described in Section Study Material and Data Collection, were utilised to characterise grain sizes, gradation, and grain sorting processes relevant to morphological studies, including roughness, sediment transport, and morphological prediction. A total of 20 samples were collected at eight cross-sections within the 57 km reach of the Palasbari-Gumi 2D model domain, while 16 samples were gathered at six cross-sections within the 43 km reach of the Dibrugarh 2D model domain. At each cross-section, three samples were collected from the riverbed: one from the middle and two from either side of the cross-section for both reaches. The Van Veen Grab sampler was used for sample collection. The grain size data, including the median grain size (D50), for both reaches are presented in Table 1. The grain size data are consistent with citation grain sizes for the Brahmaputra River found in the literature. Average grain size distribution curves of DED (directed energy deposition) material for both reaches are shown in Figure 5.
TABLE 1
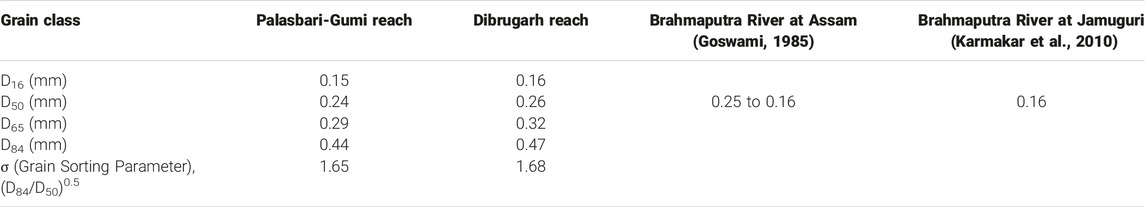
TABLE 1. Bed material grain size distribution at Palasbari-Gumi and Dibrugarh reach of the Brahmaputra River (2018).
FIGURE 5
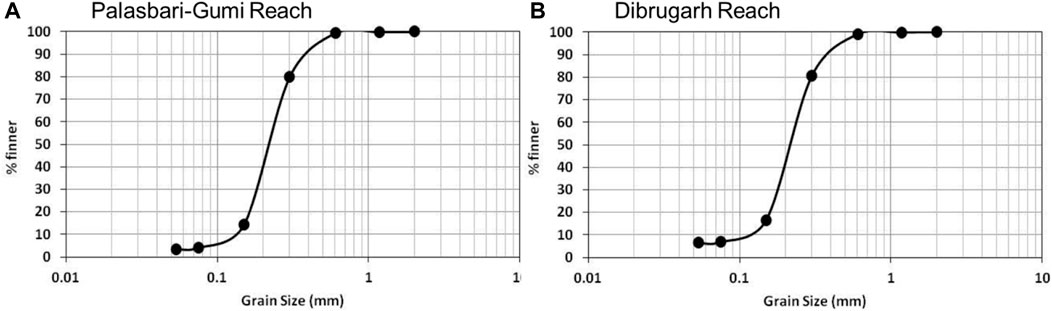
FIGURE 5. Average grain size distribution curves of DED material for (A) Palasbari-Gumi reach, and (B) Dibrugarh reach.
Moreover, the grain sorting parameter (σ) indicates well-sorted sediment in the riverbed, where a sorting parameter of less than 1.6 signifies well-sorted sediment (Schumm and Parker, 1973; ASCE Manual of Practice, 2006), making sediment transport formulas applicable for uniform sediment (with median grain size, D50) useable in sediment transport and morphological prediction. This characterisation enhances the precision of sediment transport and morphological predictions in the study.
Scenarios for Morphological Model
The morphological model developed in this study employs the advanced MIKE-21C technology to predict erosion patterns and plan protective measures within the Palasbari-Gumi reach, and Dibrugarh reach of the Brahmaputra River. This model is underpinned by a comprehensive dataset, including topographical information, discharge data, and sediment characteristics, enabling the simulation of morphological alterations under a spectrum of hydrological scenarios. The results derived from this model provide invaluable insights into erosion prediction and river management strategies within this dynamic and ever-changing environment. This approach enhances our understanding of the complex interactions in the Palasbari-Gumi and Dibrugarh reach and aids in the development of effective measures to mitigate erosion and its associated impacts.
Hydrological Scenarios
The model underwent a series of runs to explore various hydrological scenarios for predicting design parameters along both the Palasbari-Gumi and Dibrugarh reaches of the Brahmaputra River. These simulations were primarily focused on the monsoon period when the morphological dynamics are most pronounced. The simulation period extended from May to October and encompassed three key scenarios: (a) conditions approximating a bankfull discharge (equivalent to a 1 in 2 year return period); (b) conditions representing a 1 in 100 year discharge, with the simulation period also spanning from May to October; and (c) utilisation of actual hydrological discharge data from 2021.
To ensure the accuracy of the simulations, the discharge and water level hydrographs from 2021, which were used for model calibration, were adjusted to align with the peak magnitudes observed during 1 in 2 year and 1 in 100 year flood events. The model runs were executed under fixed bed conditions and relied on topography data from June 2022 for the overall model area, with bathymetry data from August 2022 being applied specifically to the Palasbari-Gumi and Dibrugarh reaches. This comprehensive approach to modelling allowed for a detailed exploration of morphological changes in these critical areas during the monsoon season.
Development and Planning Scenarios
The morphological prediction process involved the strategic use of specific scenarios to comprehensively assess the behaviour of the Palasbari-Gumi and Dibrugarh reaches in the Brahmaputra River. These scenarios were as follows: (a) in the first scenario, the assumption was made that the entire south bank within the 2D model domain of both Palasbari-Gumi and Dibrugarh reaches was non-erodible. This essentially mimicked a scenario where the riverbanks were trained or fixed, allowing for an evaluation of scour development within the river; (b) the second scenario introduced the incorporation of river training works into the model at the Palasbari-Gumi and Dibrugarh reaches. This addition aimed to assess the impact of these river training measures on bank erosion in the unprotected south bank reaches; and (c) in the third scenario, the entire Palasbari bend was considered non-erodible, with a focus on understanding its impact on the unprotected south bank reach. These scenarios served as valuable tools in unravelling the complexities of erosion dynamics and the requirements for protective measures in these critical areas. By systematically exploring these scenarios, the study provided insights into how different factors and interventions influenced the morphological evolution of the river reaches, ultimately contributing to a better understanding of river management in these regions.
Result
Model Calibration and Validation
Hydrodynamic variables, with a primary focus on ADCP velocity measurements, played a pivotal role in the calibration process of the model. This calibration was of utmost importance as it served to establish the model’s reliability in predicting sediment load and, consequently, morphological changes including scour and erosion. To fine-tune the model’s performance, adjustments were made to Chezy’s flow friction factor (C) (Manning, 1895; Chow, 1973) through iterative model runs, aligning the model-generated variables, such as velocity and sediment load, with measured data. The MIKE 21C modelling software provided a robust framework for the incorporation of spatial variations in Chezy’s C. This feature allowed for the accounting of differing roughness conditions within the river, particularly between shallow islands and deep channels. Bedforms like dunes and ripples, known to impact roughness, were also taken into consideration. The software’s capabilities extended to quantifying flow friction due to the dynamic evolution of bars and bedforms within the complex braided river system.
Several researchers, including van Rijn. (1984), have proposed empirical equations to evaluate flow friction associated with skin roughness (arising from sediment grains) and form roughness (linked to ripples and dunes). Applying van Rijn’s formula to the Brahmaputra River, hand calculations yielded Chezy’s C values ranging from 55 to 60 for deep channels, 40 to 45 for channels with more average depths, and 25 to 30 for shallow islands for both reaches. Notably, the calibrated Chezy’s C values in the 2D model demonstrated a commendable alignment with ADCP velocities and sediment load data. It is worth highlighting that these calibrated C values fell within the range derived from the hand calculations based on van Rijn’s formula, underlining the model’s fidelity to real-world observations and data.
ADCP Velocity Comparison
The 2D model demonstrated a high degree of accuracy in predicting velocities within the primary channels of the Palasbari-Gumi and Dibrugarh reaches. Calibration procedures were meticulously carried out using data from the 2021 hydrological year, and the model’s performance was rigorously validated against flow data from June 2022. In both the calibrated and validated results, there was a robust concurrence between the model-generated velocities and the actual measurements obtained through ADCP. Specifically, when comparing ADCP-measured velocities from July 2021 in the primary channel of Palasbari, it was observed that the peak model velocity exhibited only a minimal deviation of approximately 8.9% from the measured values. Similarly, in the primary channel of Dibrugarh, the peak model velocity showed a slight deviation of around 5.3% from the measured values. This level of agreement is considered highly satisfactory, particularly in the context of sediment load prediction, indicating the model’s reliability and suitability for its intended purposes.
The author conducted a comprehensive calibration and validation process for flow parameters across various cross-sections. However, for the sake of brevity, only a representative cross-section for both the Palasbari-Gumi and Dibrugarh reaches is presented in Figure 6. Validation against ADCP measurements conducted in June 2022 further substantiated the model’s proficiency in predicting velocity distribution. The comparison between the model-predicted average velocities and the actual measurements revealed a high degree of agreement across all cross-sections within both the Palasbari-Gumi and Dibrugarh reaches. The disparities observed, typically falling below 10%, were deemed minor and within an acceptable margin of error. This validation process serves as a robust confirmation of the model’s efficacy in replicating real-world velocity patterns in the study area.
FIGURE 6
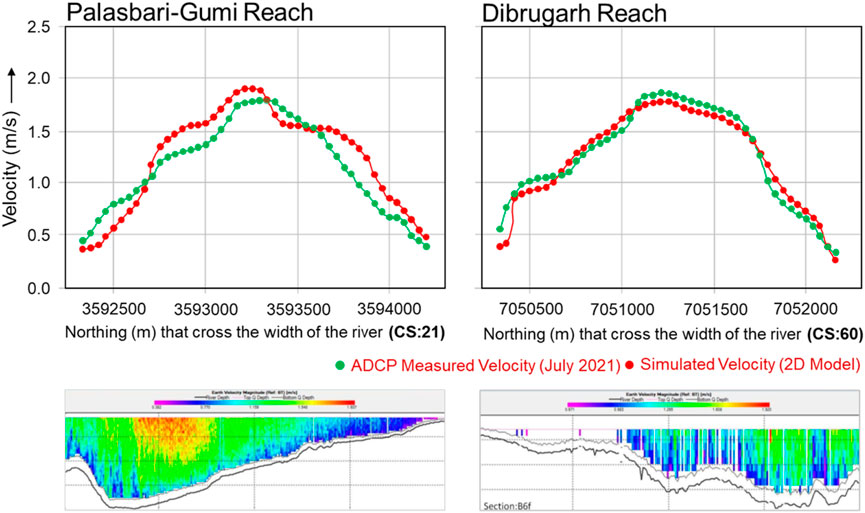
FIGURE 6. Comparison of 2D model velocity with ADCP measurement of July 2021 (result compared at CS:21 (near Pandu in Palasbari-Gumi reach), and CS:60 (near Dibrugarh town in Dibrugarh reach) in the main navigable channel.
Sediment Load Comparison
The model demonstrated an effective capacity to predict sediment load under the 2021 hydrological conditions and the bankfull discharge scenario, exhibiting a close alignment with historical measurements for both the Palasbari-Gumi and Dibrugarh reaches (Table 2). The Engelund and Hansen. (1967) total transport load formula was applied in the model, utilising a median grain size (D50) of 0.16 mm to represent fine sand. When the model’s sediment load predictions were compared to observed loads at Bahadurabad on the Brahmaputra River, a high level of agreement was observed in the Palasbari-Gumi reach. However, it is worth noting that the observed load at Pandu appeared to exceed the model’s prediction. This disparity could potentially be attributed to the inclusion of wash load, although this was not explicitly stated in the reference. Typically, wash load constitutes a substantial portion, around 40%–50%, of the total load (as noted in FAP24, 1996; Coleman, 1969). Assuming a consistent ratio and considering a coarse sediment load of approximately 200 Mt/year at Bahadurabad, it is plausible that the Pandu load mentioned in the literature appears elevated if it contains only the coarse sediment fraction. Therefore, in consideration of this fractional ratio, the 2D model’s load prediction also aligns satisfactorily with the measurement at Pandu within the Palasbari-Gumi reach.
TABLE 2
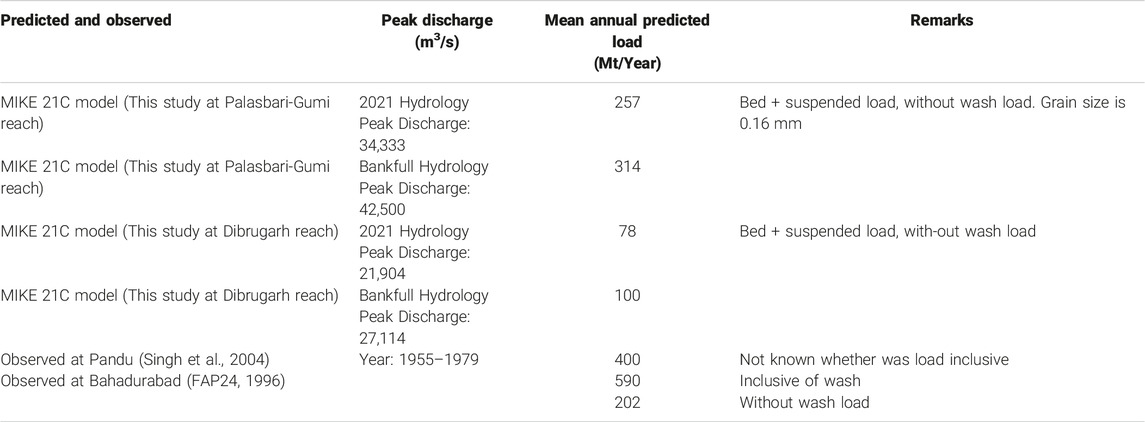
TABLE 2. Sediment load predicted by 2D MIKE 21C model at Palasbari-Gumi, and Dibrugarh reach of the Brahmaputra River.
The model’s prediction for the total load at Dibrugarh under the 2021 hydrological conditions is approximately 78 Mt/year. This particular hydrology represents a low-magnitude flood event, and in comparison to the bankfull discharge condition, it may slightly lag in magnitude. When examining the measured and model-predicted load at Pandu, the predicted load at Dibrugarh appears quite plausible. Pandu discharge is approximately 1.6 times higher than Dibrugarh, while the Pandu-predicted load is 3.3 times higher than the load predicted for Dibrugarh. This nonlinear relationship between the increase in sediment load and discharge or shear stress is a well-established concept in sediment transport studies (as evident in Engelund and Hansen, 1967). Such non-linearity in the increase of sediment load with discharge is also observed in measurements from the Brahmaputra River in Bangladesh. Furthermore, even when considering the same discharge, sediment load would proportionally be lower at Dibrugarh than at Pandu due to the higher grain size at Dibrugarh (D50 = 0.26 mm) compared to Pandu (D50 = 0.16 mm). In sediment transport processes that are size-independent, where sediment is uniform in size, the load is inversely related to grain size. Simply put, the larger the median grain size (D50) in well-sorted uniform sediment, the lower the transport rates (Wilcock and McArdell, 1993; ASCE Manual of Practice, 2006).
Taking into account the precision of the observed load at Pandu, it is reasonable to assume that the predicted load at Dibrugarh, specifically for the coarse fraction (without wash load or silt), would have fallen within the range of two-fold had there been measured load data available at Dibrugarh. In the realm of sediment transport involving non-cohesive sediment, results within a factor of two are generally regarded as satisfactory (White et al., 1975; Yang, 1976; ASCE Manual of Practice, 2006). Model predicted total sediment load and discharge for short-term (1 year), short-term (2 year), medium-term (3 year), and long-term (5 year) at (A) Palasbari-Gumi reach (Palasbari river section), and (B) Dibrugarh reach (Oakland section) are shown in Figure 7.
FIGURE 7
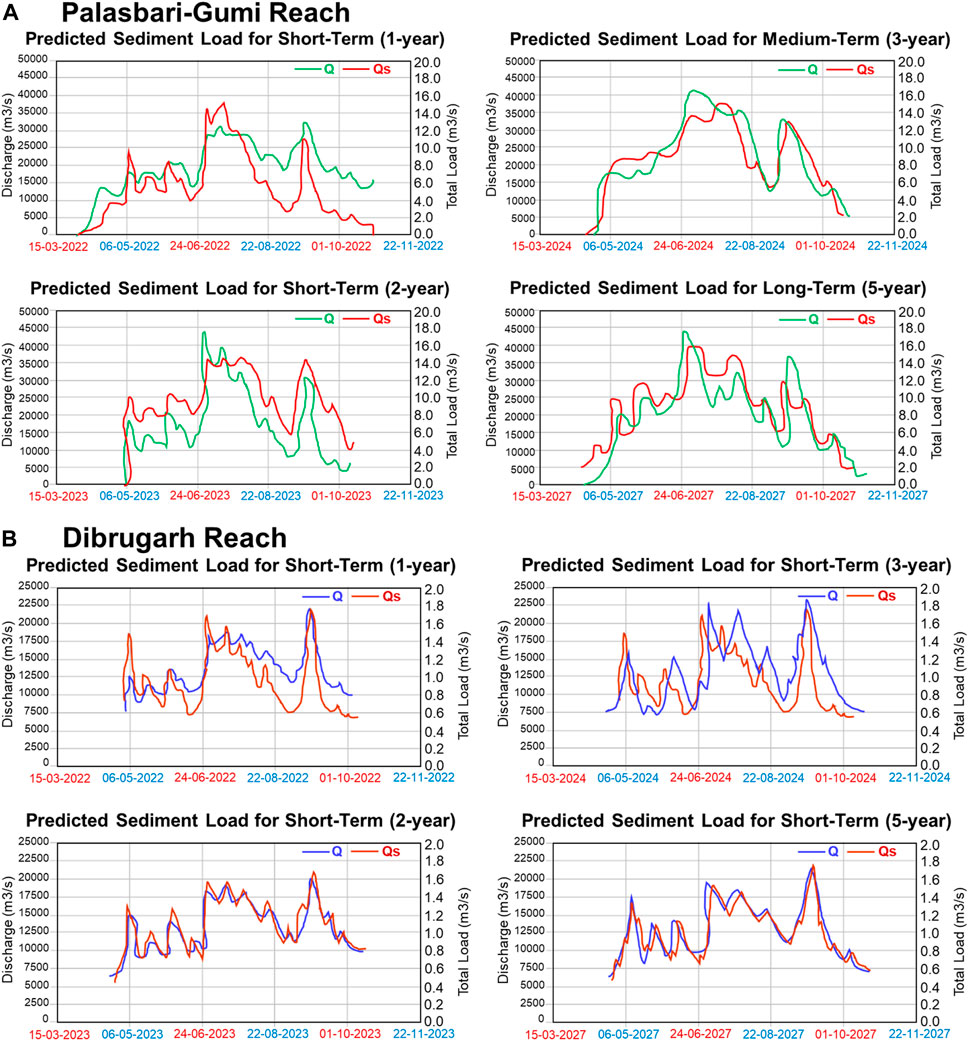
FIGURE 7. MIKE21C model predicted sediment load and hydrograph of discharge of different simulation scenarios at (A) Palasbari-Gumi reach, and (B) Dibrugarh reach of Brahmaputra River.
Assessment of Erosion and Scours
Palasbari-Gumi Reach
The predictions indicate substantial bed scour, ranging from approximately 12 to 25 m, along the Palasbari bend for the three flood events (Table 3). In contrast, the scour along the Gumi bend is comparatively lower, with depths ranging from 4 to 8 m. Both short-term (1 year) and medium-term (3 year) forecasts do not anticipate significant changes in the Gumi anabranch in the upcoming year, as depicted in Figure 8. Some localized areas with high scour values, as projected by the model, are considered non-representative and likely a result of the coarse-scale bathymetric data employed. Improvements in these areas can be achieved with high-resolution bathymetric survey data, particularly along the edges of deeper channels. Nevertheless, observations indicate that the Palasbari channel bend experiences siltation and narrows after the peak flood and sediment load from the stable channel section at Pandu has passed. This transition is evident in the bathymetric plots shown in Figure 8A, comparing conditions at the start of the monsoon (May) to those after the peak of the hydrograph (Figure 8B).
TABLE 3
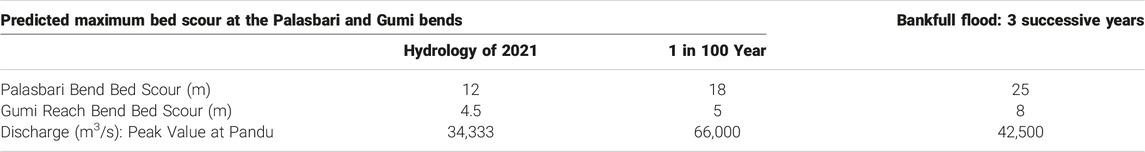
TABLE 3. Sediment load predicted by 2D MIKE21C model of the Brahmaputra River for the Palasbari-Gumi reach.
FIGURE 8
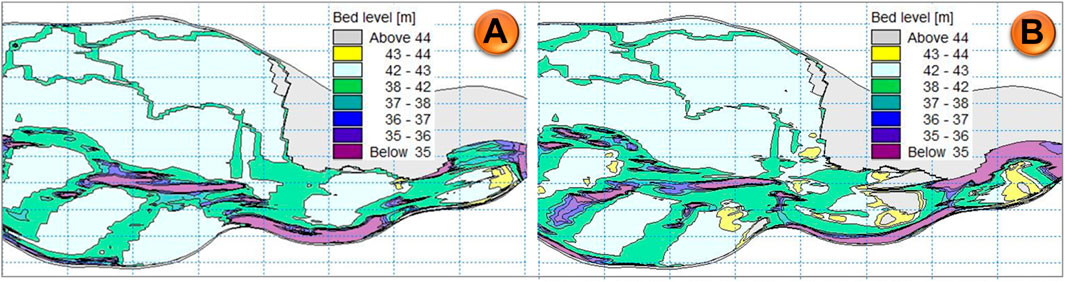
FIGURE 8. (A) Main channel planforms based on survey of June 2021, (B) Predicted channel planform under bankfull discharge condition after the peak flow load and the flow has passed the Palasbari bend.
Dibrugarh Reach
Scour depths in the main anabranches and along the banks are in the range of 5–6 m, which is understandably small in the model’s predictions. The lower magnitude of scour depth can be attributed, in part, to the lower magnitude flood in 2021. It is important to note that the channel geometry at Dibrugarh differs considerably from that of Palasbari-Gumi, as Dibrugarh features a braided and straight channel configuration, while Palasbari-Gumi consists of a braided system with sharp channel bends along the banks. Furthermore, the larger grain size at Dibrugarh contributes to the relatively lower scour development in this area, especially considering that the sediment load at Dibrugarh is 3.5 times lower than that in the Palasbari-Gumi reach. Nevertheless, these morphological forecasts offer valuable insights into channel morphology along the south bank, which should be closely monitored in the coming years for effective bank erosion management.
The forecasted bathymetry for the 5th year (2027) from the present year is depicted in Figure 9B, while the bathymetry at the present time (2021) is shown in Figure 9A. Although there are no surprising developments in the channel after 5 years of natural processes acting on the present bed, it is worth noting that a chute channel is expected to form along the south bank between Easting 686,000 m and Easting 690,000 m, as indicated by the deep blue channel along the bank. This is anticipated to increase bank erosion in this specific reach, covering a length of approximately 3–4 km.
FIGURE 9
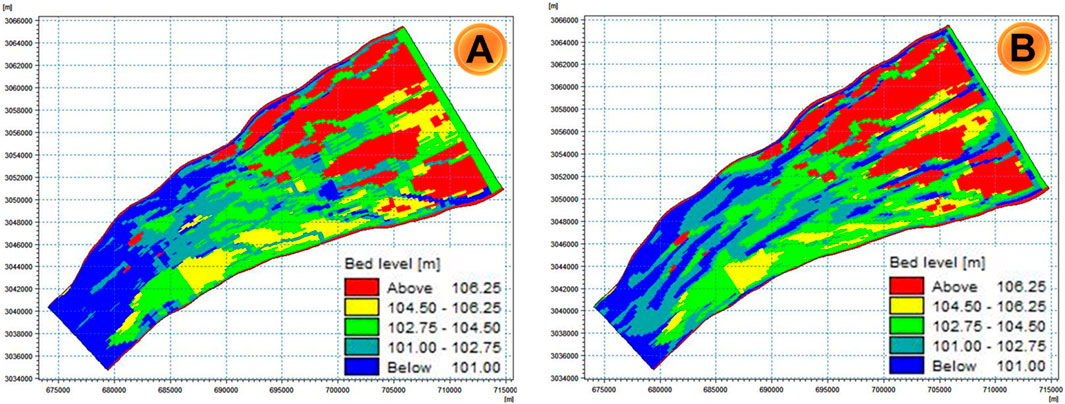
FIGURE 9. (A) River bathymetry prior to water working by the hydrology of 2021, (B) Forecast of morphological development in the 5th year from 2022 due to water working of the bed by 2021 hydrology.
Discussion
Bank Erosion Prediction at Palasbari and Gumi Reach
Bank erosion predictions for the south bank in the Palasbari and Gumi reach were conducted, encompassing scenarios for 1 year, 3 year, and 5 year projections. Two primary development scenarios were taken into consideration: (a) the existing conditions, where protection is provided by geo-bags along the Palasbari and Gumi reach, and (b) protection along the entire Palasbari bend and the existing Gumi training work. However, it is important to emphasise that effective bank erosion management in these areas, specifically at Palasbari and Gumi, necessitates integration with development plans for the north bank immediately upstream of Palasbari and further upstream. This is crucial because the development activities on the north bank can exert a significant influence on erosion patterns and channel changes downstream.
The erosion predictions were based on bankfull discharge, which represents a reasonably frequent occurrence with a 1 in 2 year probability. For medium-term forecasts spanning 3–4 years, the 1 year monsoon hydrograph was used as a basis and multiplied to create the hydrographs for these extended periods. The areas susceptible to erosion under bankfull discharge conditions are visually represented in Figure 10, where eroded banklines are depicted in red lines. Gaps without erosion indicate the presence of existing protective measures at the Palasbari and Gumi reach.
FIGURE 10
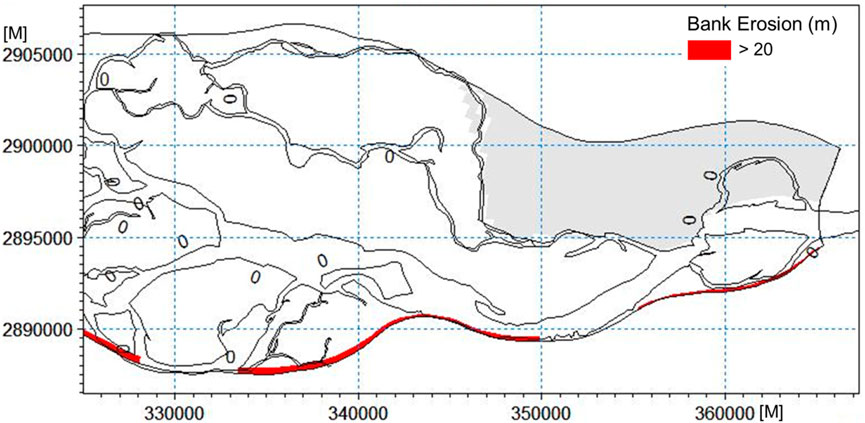
FIGURE 10. Erosion affected reaches along the south bank from Palasbari to Gumi.
The annual erosion rate varies between 10 and 30 m, with certain areas, such as the extended banklines downstream of the Palasbari bend, experiencing minimal erosion rates of less than 5 m annually. In the medium-term scenario, the comprehensive protection of the entire Palasbari bend encourages morphological development, resulting in the elevation of downstream riverbanks and the formation of islands within 3 years. However, this might intensify erosion downstream of Gumi’s bank protections, necessitating potential extensions. The initial bank erosion rate stands at 15 m per year, reducing to 8 m annually by the fifth year.
The north bank near Pandu, although not subject to specific erosion predictions, is vulnerable due to the presence of swift, deep channels. Thus, controlling erosion at the Palasbari bend and regulating downstream channel development are pivotal. A comprehensive approach that includes extending the model to Pandu Bridge and assessing the impact of the second bridge is crucial for long-term predictions.
Bank Erosion Prediction at Dibrugarh Reach
Riverbanks vulnerable to erosion in the study area are shown in Figure 11. The erosion forecast was made under the assumption that existing bank protection works in the region were not considered in the model setup. The primary objective was to assess the vulnerability of the banks in the absence of any protection measures and then progressively quantify the impact of the existing protective works.
FIGURE 11
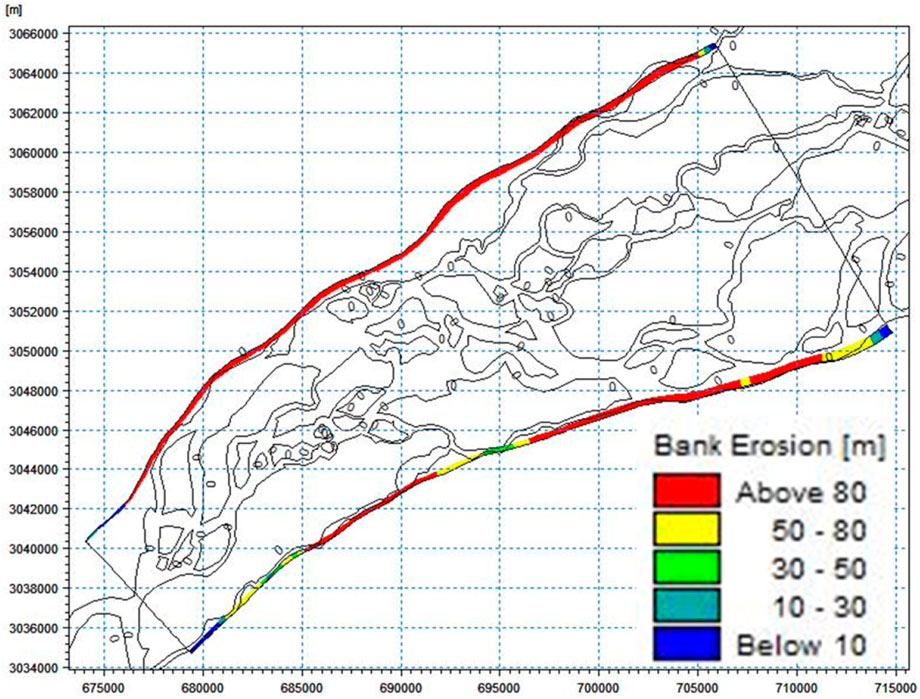
FIGURE 11. Bank erosion forecast for the next 5 years up to 2027 along the south bank at Dibrugarh.
A stretch of approximately 15 km along the south bank, spanning from Naghaghuly to Rohomaria (Easting 692000m to Easting 712000m, as illustrated in Figure 11), is identified as susceptible to bank erosion. This area may experience an annual erosion rate in the range of 10–15 m. The total bank erosion predicted for the next 5 years, resulting from the gradual effects of an ordinary low-magnitude flood in 2021, is estimated to be approximately 100 m, as visualized in Figure 12 (between chainage 20,000 to 36,000 m).
FIGURE 12
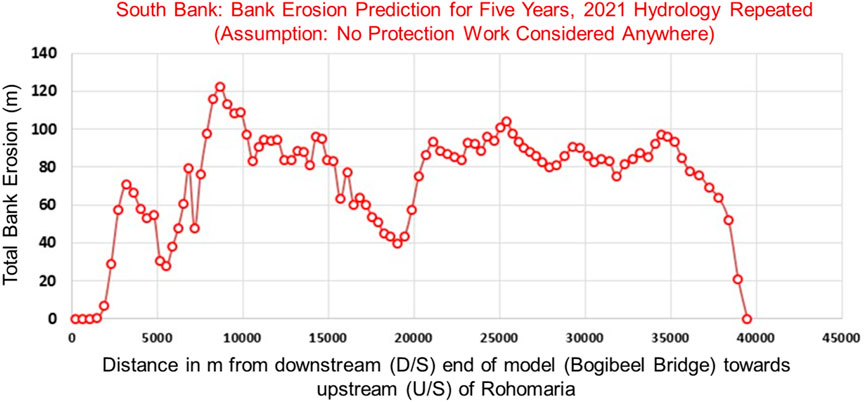
FIGURE 12. Bank erosion prone reach along south and north banks (forecasted total bank erosion for the next 5 years).
Additionally, there is another development downstream of Naghaghuly along the south bank, spanning from Easting 685000m–692000m (Figure 11). It is anticipated that a deep channel may evolve along this bank, a possibility previously discussed in Figure 9. This area could experience even more substantial bank erosion than the Naghaghuly reach, with predictions indicating erosion of up to 120 m over 5 years (Figure 12).
Conclusion
Two-dimensional (2D) morphological models were meticulously developed to simulate the behaviour of the Brahmaputra River in the Palasbari-Gumi reach and Dibrugarh reach. These comprehensive models are designed to address various critical aspects of river morphology, including bend scour, confluence scour, obstruction scour, and bank erosion. To construct the models, advanced techniques such as multi-block grid generation were employed, and it was built using data from topographic surveys conducted in 2022 and cross-section data provided by the Water Resource Department (WRD).
The spatial coverage of these models is extensive, encompassing a stretch of 57 km with a river width of approximately 20 km in the Palasbari-Gumi reach, and a river length of 43 km in the Dibrugarh reach. Calibration of these models were performed with reference to hydrological conditions from the year 2021, and rigorous validation were executed against flow data from June 2022. The model’s predictive capabilities exhibited remarkable accuracy in several critical aspects. Notably, the model’s predictions are closely aligned with measurements from Acoustic Doppler Current Profilers (ADCP), which are instruments used for measuring flow velocities in rivers. Peak model velocities showed deviations of less than 9% from the actual measurements, indicating the model’s proficiency in predicting flow dynamics.
Furthermore, the model demonstrated a high level of precision in estimating design flood levels, achieving an accuracy rate of 91% for the Palasbari-Gumi reach and 95% for the Dibrugarh reach under bankfull discharge conditions. This suggests that the model can reliably assess flood levels, which are vital for hydraulic and morphological analyses. The model’s competence extended to forecasting yearly sediment load, with predictions closely matching observed data. These achievements underscore the model’s effectiveness in capturing the complex dynamics of the Brahmaputra River, making it a valuable tool for studying and managing this dynamic and ever-changing natural system.
Palasbari-Gumi reach: The model provides insightful predictions for various critical parameters. Specifically, it estimates an annual sediment load of 257 million tons per year for the coarse sand fraction during 2021, under bankfull discharge conditions. It is worth noting that historical observations have reported a higher sediment load of around 400 million tons per year for the entire Brahmaputra, indicating that the model’s prediction represents a subset of the total sediment load in the river. The model further projects significant hydraulic design variables for the Palasbari and Gumi areas in 2022. These include average depths of 9.82 m and 5.87 m, respectively. Over a long-term horizon of a century, these depths are expected to increase to 11.49 m and 7.35 m for Palasbari and Gumi, respectively. Similarly, average water levels for 2022 are anticipated to be 47.73 m for Palasbari and 46.33 m for Gumi, with the potential to rise to 48.83 m and 47.54 m, respectively, by the end of the century.
The model also provides valuable insights into flow velocities, indicating that average speeds in 2022 are projected to be 1.4 m per second for Palasbari and 0.66 m per second for Gumi. Looking ahead to 2,122, these speeds may increase to 1.77 m per second and 0.73 m per second, respectively. This data is essential for understanding the dynamic nature of flow within these reaches. In terms of morphological changes, the model predicts bed scour depths ranging from 12 to 25 m during flood events along the Palasbari bend. In contrast, the Gumi bend is expected to experience relatively lower scour depths, typically falling within the range of 4–8 m. This information provides critical insights into the evolving morphology of the river under various hydrological scenarios. Furthermore, the model’s short-term (1 year) and medium-term (3 year) predictions do not indicate substantial development of the Gumi anabranch in the near future. These forecasts contribute to our understanding of the stability and changes in this dynamic river system.
Bank erosion forecasts for the south bank in the Palasbari-Gumi reach, spanning 1 year, 3 year, and 5 year scenarios, were conducted. These scenarios considered existing geo-bag protection at Palasbari and Gumi sites and extended protection along the entire Palasbari bend while maintaining existing Gumi work. Annual erosion rates ranged from 10 to 30 m, with some areas experiencing minimal yearly erosion below 5 m, primarily downstream of Palasbari and Gumi sites. Minor embayment development was observed immediately upstream of each site, with a maximum of 10 m of bank erosion. The protection of the entire Palasbari bend is expected to enhance morphological development between Palasbari and Gumi, leading to significant siltation upstream of Gumi but also causing increased bank erosion downstream of the Gumi protection works. This study offers a valuable methodology for planning and executing river training measures in highly braided rivers like the Brahmaputra by predicting morphological changes over a 2–3 year period.
Dibrugarh reach: A medium-term morphological prediction spanning 5 years has been generated to evaluate channel development and the vulnerability of bank erosion, particularly along the south bank of the Brahmaputra River. Based on model predictions and ADCP measurements from July 2021, it is evident that during this relatively ordinary low-magnitude flood event of 2021, maximum velocities along the south bank could exceed 3 m per second, with even the lowest velocities during the monsoon staying above the erosion threshold. Consequently, in extreme flood events like bankfull, 1 in 50 year, and 1 in 100 year events, the south bank is at risk of erosion.
An approximately 15 km stretch along the south bank, extending from Naghaghuly to Rohomaria, is identified as vulnerable to bank erosion, with the potential for annual erosion rates of 10–15 m. The total forecasted bank erosion over the next 5 years, resulting from the impact of the 2021 flood, is estimated to be around 100 m. Additionally, a concerning development is anticipated downstream of Naghaghuly, covering a 7–8 km stretch along the south bank. Here, the formation of a deep channel could lead to up to 120 m of bank erosion in 5 years. This prediction is based on detailed scientific analysis and modelling.
Future Work
Based on the findings and methodology presented in this study, several future actions and research directions can be considered:
• Model refinement: further refinement and enhancement of the existing MIKE-21C model can be pursued. Continuous calibration and validation with new data and more precise measurements can improve the model’s accuracy in predicting river behaviour.
• Long-term predictions: extend the predictive capabilities of the model to forecast morphological changes beyond the 5 year timescale. Understanding the river’s behaviour over more extended periods can aid in long-term planning for river management and protection.
• Climate change impact: investigate the potential impact of climate change on the Brahmaputra River. Changing weather patterns, altered monsoon seasons, and glacier melt can significantly influence river discharge and sediment loads, which should be factored into future predictions.
• Erosion mitigation strategies: develop and evaluate erosion mitigation strategies based on the model’s predictions. This could involve the strategic placement of protective measures, eco-friendly bank stabilisation techniques, or land use planning to minimise erosion’s impact.
• Transboundary collaboration: since the Brahmaputra River flows through multiple countries, collaboration with neighbouring nations on data sharing, research, and joint management strategies is essential to address common challenges and opportunities.
• Emergency response planning: develop emergency response plans for extreme flood events, considering the vulnerability of the south bank to erosion. These plans can help in disaster preparedness and response.
Data Availability Statement
The original contributions presented in the study are included in the article/supplementary material, further inquiries can be directed to the corresponding author.
Author Contributions
The author confirms being the sole contributor of this work and has approved it for publication.
Conflict of Interest
Author KUPA is employed by the company DHI (India) Water & Environment Pvt Ltd., New Delhi, India.
Publisher’s Note
All claims expressed in this article are solely those of the authors and do not necessarily represent those of their affiliated organizations, or those of the publisher, the editors and the reviewers. Any product that may be evaluated in this article, or claim that may be made by its manufacturer, is not guaranteed or endorsed by the publisher.
Acknowledgments
Author is grateful to Managing Director, DHI (India) Water and Environment Pvt Ltd., New Delhi, India for providing the necessary facilities to carry out this work.
Footnotes
1https://earthexplorer.usgs.gov/
2https://waterresources.assam.gov.in/
5http://www.nco.ncep.noaa.gov/pmb/products/gfs/
References
ASCE Manual of Practice (2006). “Sedimentation Engineering: Processes, Measurements, Modeling, and Practice,” in World Environmental and Water Resource Congress (Omaha, Nebraska, United States: ASCE Manual of Practice). doi:10.1061/40856(200)94
Ashley, T. C., McElroy, B., Buscombe, D., Grams, P. E., and Kaplinski, M. (2020). Estimating Bedload From Suspended Load and Water Discharge in Sand Bed Rivers. Water Resour. Res. 56, 1–25. doi:10.1029/2019WR025883
Ashmore, P. (2013). 9.17 Morphology and Dynamics of Braided Rivers. Treatise Geomorphol. 9, 289–312. doi:10.1016/B978-0-12-374739-6.00242-6
Basumatary, H., Sah, R. K., and Das, A. K. (2019). Analyzing Area Dynamics on a Protected Floodplain Using Long-Term Sequential Data: The Case of Kaziranga National Park. J. Indian Soc. Remote Sens. 47 (9), 1557–1566. doi:10.1007/s12524-019-01000-x
Best, J. L., Ashworth, P. J., Sarker, M. H., and Roden, J. E. (2007). “The Brahmaputra-Jamuna River, Bangladesh,” in Large Rivers: Geomorphology and Management. Editor A. Gupta (Hoboken, New Jersey: Wiley & Sons Ltd), 395–430. doi:10.1002/9780470723722.ch19
Borah, D. K. (2022).”The Brahmaputra River Flooding, Erosion, and Modeling for Sustainable Solutions,” in Proceedings in: World Environmental and Water Resources Congress 2022 (ASCE). doi:10.1061/9780784484258.053
Bristow, C. S. (1987). “Brahmaputra River: Channel Migration and Deposition,” in Recent Developments in Fluvial Sedimentology (No. 39, Pp. 63-74). Editors F. G. Ethridge, R. M. Flores, and M. D. Harvey (SEPM Special Publication, SEPM Society for Sedimentary Geology). doi:10.2110/pec.87.39.0063
Bürgler, M., Vetsch, D. F., Boes, R., and Vanzo, D. (2022). Systematic Comparison of 1D and 2D Hydrodynamic Models for the Assessment of Hydropeaking Alterations. River Res. Appl. 39, 460–477. doi:10.1002/rra.4051
Cilli, S., Billi, P., Schippa, L., Grottoli, E., and Ciavola, P. (2021). Bedload Transport and Dune Bedforms Characteristics in Sand-Bed Rivers Supplying a Retreating Beach of the Northern Adriatic Sea (Italy). J. Hydrology Regional Stud. 37, 100894. doi:10.1016/j.ejrh.2021.100894
Coleman, J. M. (1969). Brahmaputra River Channel Processes and Sedimentation. Sediment. Geol. 3, 129–239. doi:10.1016/0037-0738(69)90010-4
Coulthard, T. J., Hicks, D. M., and Van De Wiel, M. J. (2007). Cellular Modelling of River Catchments and Reaches: Advantages, Limitations, and Prospects. Geomorphology 90, 192–207. doi:10.1016/j.geomorph.2006.10.030
Czuba, J. A., and Foufoula-Georgiou, E. (2015). Dynamic Connectivity in a Fluvial Network for Identifying Hotspots of Geomorphic Change. Water Resour. Res. 51 (3), 1401–1421. doi:10.1002/2014wr016139
Das, T., Ashwini, T., and Sil, B. S. (2022). Riverbank Erosion and Vulnerability Assessment for the Alluvial Section of Barak River in North-East India by In-Situ Approach. Preprint. doi:10.21203/rs.3.rs-2154550/v1
De Vriend, H. (2001). “Long-Term Morphological Prediction,” in River, Coastal and Estuarine Morphodynamics. Editors G. Seminara,, and P. Blondeaux (Berlin, Heidelberg: Springer). doi:10.1007/978-3-662-04571-8_8
DHI (2017). MIKE 21C, Curvilinear Model for River Morphology, User Guide MIKE Powered by DHI. Available at: https://manuals.mikepoweredbydhi.help/2017/Water_Resources.
Doeschl, A. B., Ashmore, P. E., and Davison, M. (2006). “Methods for Assessing Exploratory Computational Models of Braided Rivers,” in Braided Rivers: Process, Deposits, Ecology and Management. Editors G. H. Sambrook-Smith, J. L. Best, C. S. Bristow, G. E. Petts, and I. Jarvis (Oxford, UK: Blackwell Publishing), 177–197.
Dutta, S., Medhi, H., Karmaker, T., Singh, Y., Prabu, I., and Dutta, U. (2010). Probabilistic Flood Hazard Mapping for Embankment Breaching. ISH J. Hydraulic Eng. 6, 15–25. doi:10.1080/09715010.2010.10515012
Engelund, F., and Hansen, E. (1967). A Monograph on Sediment Transport in Alluvial Streams. Teknisk Forlag Skelbrekgade 4 Copenhagen V, Denmark. Available at: http://resolver.tudelft.nl/uuid:81101b08-04b5-4082-9121-861949c336c9.
FAP24 (1996). River Survey Project: Morphological Characteristics of Main Rivers of Bangladesh. Final report-Annex 5. Dhaka: Flood Action Plan, Water Resources Planning Organization.
Flemming, B. (2022). The Limits to Growth: How Large Can Subaqueous, Flow-Transverse Bedforms Ultimately Become? Ocean. Dyn. 72, 801–815. doi:10.1007/s10236-022-01527-7
Gao, P., Li, Z., You, Y., Zhou, Y., and Piegay, H. (2022). Assessing Functional Characteristics of a Braided River in the Qinghai-Tibet Plateau, China. Geomorphology 403, 108180. doi:10.1016/j.geomorph.2022.108180
Gomes, V. C. F., Queiroz, G. R., and Ferreira, K. R. (2020). An Overview of Platforms for Big Earth Observation Data Management and Analysis. Remote Sens. 12 (8), 1253. doi:10.3390/rs12081253
Gorelick, N., Hancher, M., Dixon, M., Ilyushchenko, S., Thau, D., and Moore, R. (2017). Google Earth Engine: Planetary-Scale Geospatial Analysis for Everyone. Remote Sens. Environ. 202, 18–27. doi:10.1016/j.rse.2017.06.031
Goswami, D. C. (1985). Brahmaputra River, Assam, India: Physiography, Basin Denudation, and Channel Aggradation. Water Resour. Res. 21, 959–978. doi:10.1029/WR021i007p00959
Han, K., Sun, J., Lin, B., Huang, Z., and Shi, X. (2023). Large-Scale Modelling of Highly Braided and Laterally Confined Reach of a Sand-Bed River. Earth Surf. Process Landforms 48, 1557–1572. doi:10.1002/esp.5568
Hemati, M., Hasanlou, M., Mahdianpari, M., and Mohammadimanesh, F. (2021). A Systematic Review of Landsat Data for Change Detection Applications: 50 Years of Monitoring the Earth. Remote Sens. 13, 2869. doi:10.3390/rs13152869
Hu, Y., Yang, H., Zhou, H., and Lv, Q. (2023). A Review of Numerical Modelling of Morphodynamics in Braided Rivers: Mechanisms, Insights, and Challenges. Water 15, 595. doi:10.3390/w15030595
Jang, C. L., and Shimizu, Y. (2005). Numerical Simulation of Relatively Wide, Shallow Channels With Erodible Banks. J. Hydraulic Eng. 131, 565–575. doi:10.1061/(asce)0733-9429(2005)131:7(565)
Jang, C. L., and Shimizu, Y. (2007). Vegetation Effects on the Morphological Behavior of Alluvial Channels. J. Hydraulic Res. 45 (6), 763–772. doi:10.1080/00221686.2007.9521814
Jan Majcher, J., Quinn, R., Smyth, T., Plets, R., McGonigle, C., Westley, K., et al. (2022). Using Difference Modelling and Computational Fluid Dynamics to Investigate the Evolution of Complex, Tidally Influenced Shipwreck Sites. Ocean. Eng. 246, 110625. doi:10.1016/j.oceaneng.2022.110625
Javernick, L., Redolfi, M., and Bertoldi, W. (2018). Evaluation of a Numerical Model's Ability to Predict Bed Load Transport Observed in Braided River Experiments. Adv. Water Resour. 115, 207–218. doi:10.1016/j.advwatres.2018.03.012
Johary, R., Révillion, C., Catry, T., Alexandre, C., Mouquet, P., Rakotoniaina, S., et al. (2023). Detection of Large-Scale Floods Using Google Earth Engine and Google Colab. Remote Sens. 15, 5368. doi:10.3390/rs15225368
Karmakar, P., Das, P. K., Sarkar, S., Karmakar, S., and Mazumdar, D. (2010). “Association Study Between Lead and Zinc Accumulation at Different Physiological Systems of Cattle by Canonical Correlation and Canonical Correspondence Analyses,” in Proceedings of International Conference on Modelling, Optimization and Computing (ICMOC) (Maryland, United States: American Institute of Physics), 742–748. doi:10.1063/1.3516424
Karmaker, T., and Dutta, S. (2016). Prediction of Short-Term Morphological Change in Large-Braided River Using 2D Numerical Model. J. Hydraulic Eng. 142 (10), 1–13. doi:10.1061/(asce)hy.1943-7900.0001167
Kasprak, A., Brasington, J., Hafen, K., Williams, R. D., and Wheaton, J. M. (2019). Modelling Braided River Morphodynamics Using a Particle Travel Length Framework. Earth Surf. Dyn. 7, 247–274. doi:10.5194/esurf-7-247-2019
Khanh, N. T., Tuan, N. H., Nu, H. T. T., and Van, C. T. (2023). Application of 2D Hydro-Dynamic Model to Simulate the Suspended Sediment on the Tien River, Cao Lanh District, Dong Thap Province. J. Hydrometeorol. 16, 23–37. doi:10.36335/VNJHM.2023(16).77-88
Kleinhans, M. G. (2010). Sorting Out River Channel Patterns. Prog. Phys. Geogr. 34 (3), 287–326. doi:10.1177/0309133310365300
Lahiri, S. K., and Sinha, R. (2012). Tectonic Controls on the Morphodynamics of the Brahmaputra River System in the Upper Assam Valley, India. Geomorphology 169-170, 74–85. doi:10.1016/j.geomorph.2012.04.012
Lajeunesse, E., Devauchelle, O., Houssais, M., and Seizilles, G. (2013). Tracer Dispersion in Bedload Transport. Adv. Geosciences 37, 1–6. doi:10.5194/adgeo-37-1-2013
Lawal, M. A., Oshomoji, A. O., Akinlalu, A. A., Omosanya, K. O., Ndukwe, O. S., Adiat, K. A. N., et al. (2022). A Simplified GIS and Google Earth-Based Approach for Lineaments and Terrain Attributes Mapping in a Basement Complex Terrain. Sci. Rep. 12, 15801. doi:10.1038/s41598-022-20057-2
Leyland, J., Hackney, C. R., Darby, S. E., Parsons, D. R., Best, J. L., Nicholas, A. P., et al. (2017). Extreme Flood-Driven Fluvial Bank Erosion and Sediment Loads: Direct Process Measurements Using Integrated Mobile Laser Scanning (MLS) and Hydro-Acoustic Techniques. Earth Surf. Process. Landforms 42, 334–346. doi:10.1002/esp.4078
Li, Z., Lu, H., Gao, P., You, Y., and Hu, X. (2020). Characterizing Braided Rivers in Two Nested Watersheds in the Source Region of the Yangtze River on the Qinghai-Tibet Plateau. Geomorphology 351, 106945. doi:10.1016/j.geomorph.2019.106945
Liedermann, M., Tritthart, M., and Habersack, H. (2013). Particle Path Characteristics at the Large Gravel-Bed River Danube: Results From a Tracer Study and Numerical Modelling. Earth Surf. Process. Landforms 38 (5), 512–522. doi:10.1002/esp.3338
Lu, H., Li, Z., Hu, X., Chen, B., and You, Y. (2022). Morphodynamic Processes in a Large Gravel-Bed Braided Channel in Response to Runoff Change: A Case Study in the Source Region of Yangtze River. Arabian J. Geosciences 15, 377. doi:10.1007/s12517-022-09641-y
Malmaeus, J., and Hassan, M. (2002). Simulation of Individual Particle Movement in a Gravel Streambed. Earth Surf. Process. Landforms 27, 81–97. doi:10.1002/esp.305
Manning, R. (1895). On the Flow of Water in Open Channels and Pipes. Trans. Inst. Civ. Eng. Irel. 20, 161–209.
Métivier, F., Devauchelle, O., Chauvet, H., Lajeunesse, E., Meunier, P., Blanckaert, K., et al. (2016). Geometry of Meandering and Braided Gravel-Bed Threads From the Bayanbulak Grassland, Tianshan, P. R. China. Earth Surf. Dynam. 4, 273–283. doi:10.5194/esurf-4-273-2016
Moharrami, M., Javanbakht, M., and Attarchi, S. (2021). Automatic Flood Detection Using Sentinel-1 Images on the Google Earth Engine. Environ. Monit. Assess. 193, 248. doi:10.1007/s10661-021-09037-7
Mosselman, E. (2004). Discussion of Numerical Modeling of Bed Evolution in Channel Bends by Ahmed AK and Chaudhry. MH 128 (5), 507–514. doi:10.1061/(ASCE)0733-9429(2004)130:1(82)
Mosselman, E. (2012). “Modelling Sediment Transport and Morphodynamics of Gravel-Bed Rivers,” in Gravel-Bed Rivers: Processes, Tools, Environments. Editors M. Church, P. M. Biron, and A. G. Roy (Chichester: Wiley), 101–115.
Murray, A. B., and Paola, C. (1994). A Cellular Model of Braided Rivers. Nature 371, 54–57. doi:10.1038/371054a0
Mutanga, O., and Kumar, L. (2019). Google Earth Engine Applications. Remote Sens. 11, 591. doi:10.3390/rs11050591
Nandi, K. K., Pradhan, C., Padhee, S. K., Dutta, S., and Khatua, K. K. (2022). Understanding the Entropy-Based Morphological Variability and Energy Expenditure Mechanism of a Large-Braided River System. J. Hydrology 615, 128662. doi:10.1016/j.jhydrol.2022.128662
Nandi, K. K., Pradhan, C., Padhee, S. K., Dutta, S., and Khatua, K. K. (2023). Identifying the Stability Trajectory of a Large-Braided Brahmaputra River Using Reach-Scale Process-Based Approach. J. Hydrology 626 (B), 130329. doi:10.1016/j.jhydrol.2023.130329
Nicholas, A. (2013). Morphodynamic Diversity of the World’s Largest Rivers. Geology 41 (4), 475–478. doi:10.1130/G34016.1
Olsen, N. R. B. (2003). Three-Dimensional CFD Modeling of Self-Forming Meandering Channel. J. Hydraulic Eng. 129 (5), 366–372. doi:10.1061/(ASCE)0733-9429(2003)129:5(366)
Pareta, K. (2020). Effect of Laxmanpur Barrage on the River System - a Case Study Through Multi-Temporal Satellite Remote Sensing Data. Indian J. Eng. 17 (48), 443–449.
Pareta, K. (2021). Morphological Study of Brahmaputra River in Assam Based on Historical Landsat Satellite Imagery From 1996 to 2020. Am. J. Environ. Sustain. Dev. 6 (2), 40–53. Available at: http://www.aiscience.org/journal/paperInfo/ajesd?paperId=5293.
Pareta, K. (2022). River Morphology of Braided Brahmaputra River, Assam. India: LAP Lambert Academic Publishing. Available at: https://www.lappublishing.com/catalogue/details/gb/978-620-5-50905-0/rivermorphology-of-braided-brahmaputra-river.
Pareta, K. (2023). Hydrological Modelling of Largest Braided River of India Using MIKE Hydro River Software With Rainfall Runoff (RR), Hydrodynamic (HD) and Snowmelt Modules. J. Water Clim. Change 14 (4), 1–25. doi:10.2166/wcc.2023.484
Pareta, K., and Pareta, U. (2021). Effects of Bank Protection Structures on River Morphology. Int. J. Environ. Plan. Manag. 7 (1), 21–35. Available at: http://www.aiscience.org/journal/paperInfo/ijepm?paperId=5232.
Pareta, K., and Pareta, U. (2023). Recent Development in Geomorphology Including Case Studies of Indian Territories. Republic of Moldova, Chisinau: LAP Lambert Academic Publishing, 1–361.
Pathan, S. A., and Sil, B. S. (2022). Rainfall Induced Soil Erosion and Sediment Yield Assessment in Upper Brahmaputra River Basin. J. Geol. Soc. India 98, 1437–1446. doi:10.1007/s12594-022-2191-y
Pirot, G., Julien, S., and Philippe, R. (2014). Simulation of Braided River Elevation Model Time Series With Multiple-Point Statistics. Geomorphology 214, 148–156. doi:10.1016/j.geomorph.2014.01.022
Pradhan, C., Nandi, K. K., Bharti, R., and Dutta, S. (2023). Developing Process-Based Geomorphic Indicators for Understanding River Dynamics of a Highly Braided System: Implications for Designing Resilience-Based Management Strategies. CATENA 232, 107411. doi:10.1016/j.catena.2023.107411
Prasujya, G., and Nayan, S. (2021). Spatio-Temporal Study of Morpho-Dynamics of the Brahmaputra River along its Majuli Island Reach. Environ. Challenges 5, 100217–100311. doi:10.1016/j.envc.2021.100217
Raff, J. L., Goodbred, S. L., Pickering, J. L., Sincavage, R. S., Ayers, J. C., Hossain, M. S., et al. (2023). Sediment Delivery to Sustain the Ganges-Brahmaputra Delta under Climate Change and Anthropogenic Impacts. Nat. Commun. 14, 2429. doi:10.1038/s41467-023-38057-9
Saadona, A., Abdullahb, J., Muhammadc, N. S., Ariffinb, J., and Julien, P. Y. (2021). Predictive Models for the Estimation of Riverbank Erosion Rates. CATENA 196, 104917. doi:10.1016/j.catena.2020.104917
Sah, R. K., Kumar, N. K., Das, A., and Lahiri, S. (2022). Major Elements of Morphological Dynamics in the Brahmaputra River. Preprint. doi:10.22541/au.164554212.20537069
Saikia, S., and Laskar, J. J. (2022). Fine Grained Braided River Sedimentation in Brahmaputra River, Majuli, Assam, India. J. Geol. Soc. India 98, 1417–1427. doi:10.1007/s12594-022-2189-5
Sarker, M. H., and Thorne, C. R. (2006). “Morphological Response of the Brahmaputra-Padma-Lower Meghna River System to the Assam Earthquake of 1950,” in Braided Rivers: Process, Deposits, Ecology, and Management. Editors H. Gregory, S. Smith, L. Best, C. S. Bristow, and G. E. Petts (Wiley), 289–310. doi:10.1002/9781444304374.ch14
Sarker, M. H., Thorne, C. R., Aktar, M. N., and Ferdous, M. R. (2014). Morpho-Dynamics of the Brahmaputra-Jamuna River, Bangladesh. Geomorphology 215, 45–59. doi:10.1016/j.geomorph.2013.07.025
Sarker, S. (2022). Essence of MIKE 21C (FDM Numerical Scheme): Application on the River Morphology of Bangladesh. Open J. Model. Simul. 10, 88–117. doi:10.4236/ojmsi.2022.102006
Sarker, S., Sarker, T., Leta, O. T., Raihan, S. U., Khan, I., and Ahmed, N. (2023). Understanding the Planform Complexity and Morphodynamic Properties of Brahmaputra River in Bangladesh: Protection and Exploitation of Riparian Areas. Water 15, 1384. doi:10.3390/w15071384
Schumm, S. A., and Parker, R. S. (1973). Implications of Complex Response of Drainage Systems for Quaternary Alluvial Stratigraphy. Nat. Phys. Sci. 243, 99–100. doi:10.1038/physci243099a0
Schuurman, F., and Kleinhans, M. G. (2011). “Self-Formed Braided Bar Pattern in a Numerical Model,” in Proceedings of the 7th IAHR conference on river, estuarine and coastal morphodynamics (Beijing, China: AGU), 1647–1657.
Singh, V. P., Sharma, B., Shekhar, C., and Ojha, P. (2004). The Brahmaputra Basin Water Resources. Kluwer Academic Publishers. ISBN 1-4020-1737-5.
Spasojevic, M., and Holly, F. M. (2008). “Two- and Three-Dimensional Numerical Simulation of Mobile-Bed Hydrodynamics and Sedimentation,” in Sedimentation Engineering: Processes, Measurements, Modeling, and Practice (Reston, VA, USA: American Society of Civil Engineers), 683–761.
Stecca, G., and Hicks, D. M. (2022). Numerical Simulations of Confined Braided River Morphodynamics: Display of Deterministic Chaos and Characterization through Turbulence Theory. JGR Earth Surf. 127 (3). doi:10.1029/2021JF006409
Stecca, G., Measures, R., Hoyle, J., and Hicks, D. M. (2023). Modelling the Impact of Dams and Exotic Vegetation in New Zealand Braided Rivers. Vienna, Austria: EGU General Assembly, 24–28. EGU23-2150. doi:10.5194/egusphere-egu23-2150
Stevens, L. E., Johnson, R. R., and Estes, C. (2022). “Characteristics and Process Interactions in Natural Fluvial–Riparian Ecosystems: A Synopsis of the Watershed-Continuum Model,” in River Basin Management - under a Changing Climate. Editors R. L. Ray, D. G. Panagoulia, and N. S. Abeysingha (London, United Kingdom: IntechOpen Limited). Available at: https://www.intechopen.com/chapters/84147.
Sun, J., Lin, B., and Tang, H. (2015). Development and Application of a Braided River Model With Non-Uniform Sediment Transport. Adv. Water Resour. 81, 62–74. doi:10.1016/j.advwatres.2014.12.012
Takebayashi, H., and Okabe, T. (2009). Numerical Modelling of Braided Streams in Unsteady Flow. Proc. Institution Civ. Engineers-Water Manag. 162 (3), 189–198. doi:10.1680/wama.2009.00011
Talukdar, G., Bhattacharjya, R. K., and Sarma, A. K. (2023). Understanding the Effect of Long Term and Short-Term Hydrological Components on Landscape Ecosystem. Ecol. Inf. 77, 102267. doi:10.1016/j.ecoinf.2023.102267
Tamiminia, H., Salehi, B., Mahdianpari, M., Quackenbush, L., Adeli, S., and Brisco, B. (2020). Google Earth Engine for Geo-Big Data Applications: A Meta-Analysis and Systematic Review. ISPRS J. Photogrammetry Remote Sens. 164, 152–170. doi:10.1016/j.isprsjprs.2020.04.001
Thomas, W. A., and Chang, H. (2008). “Computational Modeling of Sedimentation Processes,” in Sedimentation Engineering. Editor J. J. G. Garcia (Reston, VA: American Society of Civil Engineers), 649–681.
Tucker, G. E., and Bradley, D. N. (2010). Trouble With Diffusion: Reassessing Hillslope Erosion Laws With a Particle-Based Model. J. Geophys. Res. Earth Surf. 115, F00A10. doi:10.1029/2009jf001264
Unsworth, C. A., Nicholas, A. P., Ashworth, P. J., Best, J. L., Lane, S. N., Parsons, D. R., et al. (2020). Influence of Dunes on Channel-scale Flow and Sediment Transport in a Sand Bed Braided River. J. Geophys. Res. Earth Surf. 125, e2020JF005571. doi:10.1029/2020JF005571
van der Wal, M. (2020). Bank Protection Structures along the Brahmaputra-Jamuna River, a Study of Flow Slides. Water 12, 2588. doi:10.3390/w12092588
Van De Wiel, M. J., Coulthard, T. J., Macklin, M. G., and Lewin, J. (2011). Modelling the Response of River Systems to Environmental Change: Progress, Problems, and Prospects for Palaeo-Environmental Reconstructions. Earth-Science Rev. 104 (1-3), 167–185. doi:10.1016/j.earscirev.2010.10.004
van Rijn, L. C. (1984). Sediment Transport, Part-I: Bed Load Transport. J. Hydraulic Eng. 110, 1431–1456. doi:10.1061/(ASCE)0733-9429(1984)110:10(1431)
Velastegui-Montoya, A., Montalván-Burbano, N., Carrión-Mero, P., Rivera-Torres, H., Sadeck, L., and Adami, M. (2023). Google Earth Engine: A Global Analysis and Future Trends. Remote Sens. 15, 3675. doi:10.3390/rs15143675
Wang, Y., Xia, J., Deng, S., Zhou, M., Wang, Z., and Xu, X. (2022). Numerical Simulation of Bank Erosion and Accretion in a Braided Reach of the Lower Yellow River. CATENA 217, 106456. doi:10.1016/j.catena.2022.106456
Webb, E. K. (1995). Simulation of Braided Channel Topology and Topography. Water Resour. Res. 31, 2603–2611. doi:10.1029/95wr01952
Weisscher, S. A. H., Boechat-Albernaz, M., Leuven, J. R. F. W., Dijk, W. M. V., Shimizu, Y., and Kleinhans, M. G. (2020). Complementing Scale Experiments of Rivers and Estuaries With Numerically Modelled Hydrodynamics. Earth Surf. Dyn. 8, 955–972. doi:10.5194/esurf-8-955-2020
White, W. R., Milli, H., and Crabe, A. D. (1975). Sediment Transport Theories: A Review. London: Proceedings of the Institute of Civil Engineers, 265–292. Part 2, No. 59, Available at: https://pubs.usgs.gov/wri/1989/4026/report.pdf.
Wilcock, P. R., and McArdell, B. W. (1993). Surface-Based Fractional Transport Rates: Mobilization Thresholds and Partial Transport of a Sand-Gravel Sediment. Water Resour. Res. 29, 1297–1312. doi:10.1029/92WR02748
Williams, R. D., Brasington, J., and Hicks, D. M. (2016a). Numerical Modelling of Braided River Morphodynamics: Review and Future Challenges. Geogr. Compass 10, 102–127. doi:10.1111/gec3.12260
Williams, R. D., Measures, R., Hicks, D. M., and Brasington, J. (2016b). Assessment of a Numerical Model to Reproduce Event-Scale Erosion and Deposition Distributions in a Braided River. Water Resour. Res. 52, 6621–6642. doi:10.1002/2015wr018491
Wu, X., Zhang, Z., Xiong, S., Zhang, W., Tang, J., Li, Z., et al. (2023). A Near-Real-Time Flood Detection Method Based on Deep Learning and SAR Images. Remote Sens. 15, 2046. doi:10.3390/rs15082046
Yang, C. T. (1976). Minimum Unit Stream Power and Fluvial Hydraulics. J. Hydraulic Div. ASCE 102 (7), 919–934. doi:10.1061/JYCEAJ.0004589
Keywords: river morphology, hydrodynamics, erosion prediction, MIKE 21C, Brahmaputra River
Citation: Pareta K (2024) Morphological Model for Erosion Prediction of India’s Largest Braided River Using MIKE 21C Model. Earth Sci. Syst. Soc. 4:10075. doi: 10.3389/esss.2024.10075
Received: 23 February 2023; Accepted: 04 January 2024;
Published: 15 January 2024.
Edited by:
Kathryn Goodenough, British Geological Survey-The Lyell Centre, United KingdomReviewed by:
Shehnaj Pathan, Assam Kaziranga University, IndiaGaurav Talukdar, Indian Institute of Technology Guwahati, India
Ketan Nandi, Indian Institute of Technology Guwahati, India
Copyright © 2024 Pareta. This is an open-access article distributed under the terms of the Creative Commons Attribution License (CC BY). The use, distribution or reproduction in other forums is permitted, provided the original author(s) and the copyright owner(s) are credited and that the original publication in this journal is cited, in accordance with accepted academic practice. No use, distribution or reproduction is permitted which does not comply with these terms.
*Correspondence: Kuldeep Pareta, kpareta13@gmail.com, kupa@dhigroup.com