 I. de Jonge-Anderson
 J. R. Underhill
- 1Institute of GeoEnergy Engineering (IGE), School of Energy, Geoscience, Infrastructure & Society, Heriot-Watt University, Edinburgh, United Kingdom
- 2Interdisciplinary Centre for Energy Transition, School of Geosciences, King’s College, University of Aberdeen, Aberdeen, United Kingdom
Opportunities exist to re-purpose depleted gas fields in the Southern North Sea as CO2 storage sites if, where and when they meet the right set of geological, engineering, and non-technical criteria. Fields positioned on the western edge of the basin are attractive as they lie close to the major industrial emitters of East England which need to decarbonise if the UK’s Net Zero targets are to be met. Having stopped production in 2018, Pickerill has CO2 storage potential as it is a proven trap from which around 440 Bcf of gas has been produced and it is located near the coastline. We use a public-domain 3D seismic dataset, wireline logs, core reports and production data to assess its CO2 storage potential. The Rotliegend Group reservoir (Leman Sandstone Formation) is a mixed aeolian/fluvial succession with variable thickness (25 m–80 m), high net-to-gross (0.9–1.0), moderate average porosity (9%–17%) and fair-average permeability (>1 mD). The seal is Zechstein Group evaporites and carbonates which thin and swell in response to their post-depositional mobility (halokinesis), further affecting and deforming the overburden. The structure is defined to the south by a WNW-ESE-striking fault system, but the north of the field is characterised mostly by dip closure of the reservoir. NW-SE-striking faults transect the field and segment the structure into several compartments, three of which appear particularly good candidates for CO2 storage and have a combined CO2 storage capacity of 32 MtCO2. If combined with nearby satellite fields, there is potential for the development of a CO2 storage cluster capable of sequestering 60 MtCO2, however, this potential is challenged by the planned development of an offshore wind farm. Turbines fixed to the seabed over the field would restrict where new CO2 injection wells might be drilled and efforts to measure, monitor and verify the CO2 plume using conventional towed-streamer seismic. There is an urgent need to resolve the competition for offshore acreage to ensure that attractive CO2 storage sites like Pickerill are not disadvantaged but can play a full part in complementing alternative renewable energy sources within the energy transition.
Introduction
Several major industrial clusters occur in the UK, all of which face an immediate challenge to decarbonise if the country is going to be climate-compatible and meet its Net Zero emission targets. Carbon Capture Utilisation and Storage (CCUS) has the potential to be a technology to enable this.
Two of the largest clusters are on the northeast coast of England at Humberside and Teesside, facing the Southern North Sea. The Southern North Sea is well-placed to host CO2 storage sites not only geographically, but as it is a mature gas province housing many fields either fully depleted or nearing their end of field life. However, some fields face issues relating to their subsurface geology (e.g., structural compartmentalisation, low-permeability reservoirs or thinning of the top-seal) and/or existing offshore infrastructure (e.g., legacy well concerns). Further to this, increasing competition for offshore space has resulted in a series of questions around how energy transition projects (such as CO2 storage and offshore wind generation) can co-exist or otherwise (Bentham et al., 2014; Robertson and McAreavey, 2021; Ørsted, 2022).
Seven CO2 storage licences have been awarded by the North Sea Transition Authority (NSTA) to-date, four of which lie in the Southern North Sea:
(1) Licence CS001 (Figure 1A), hosting the Endurance structure: a closed aquifer with a Triassic reservoir-seal pair consisting of the Bunter Sandstone Formation and the Rot Clay and Rot Halite Member caprock. The licensee, Northern Endurance Partnership, target an initial CO2 sequestration rate of 4 MtCO2/yr, with potential expansion to 10 MtCO2/yr (BP, 2022).
(2) Two further licences (CS006, CS007) hosting four Triassic closures similar to Endurance (Hollinsworth et al., 2022) were awarded to BP and Equinor in 2022. These licences lie immediately to the east of CS001 (Figure 1A) and could form an extension to the Endurance development (BP, 2022).
(3) CS005 is located on the Inde Shelf (Figure 1A) and pertains to the “V Net Zero” project, which includes CO2 storage within the depleted Viking and Victor Rotliegend Group gas fields. The licensee, Harbour Energy, target 11 MtCO2/yr by 2030.
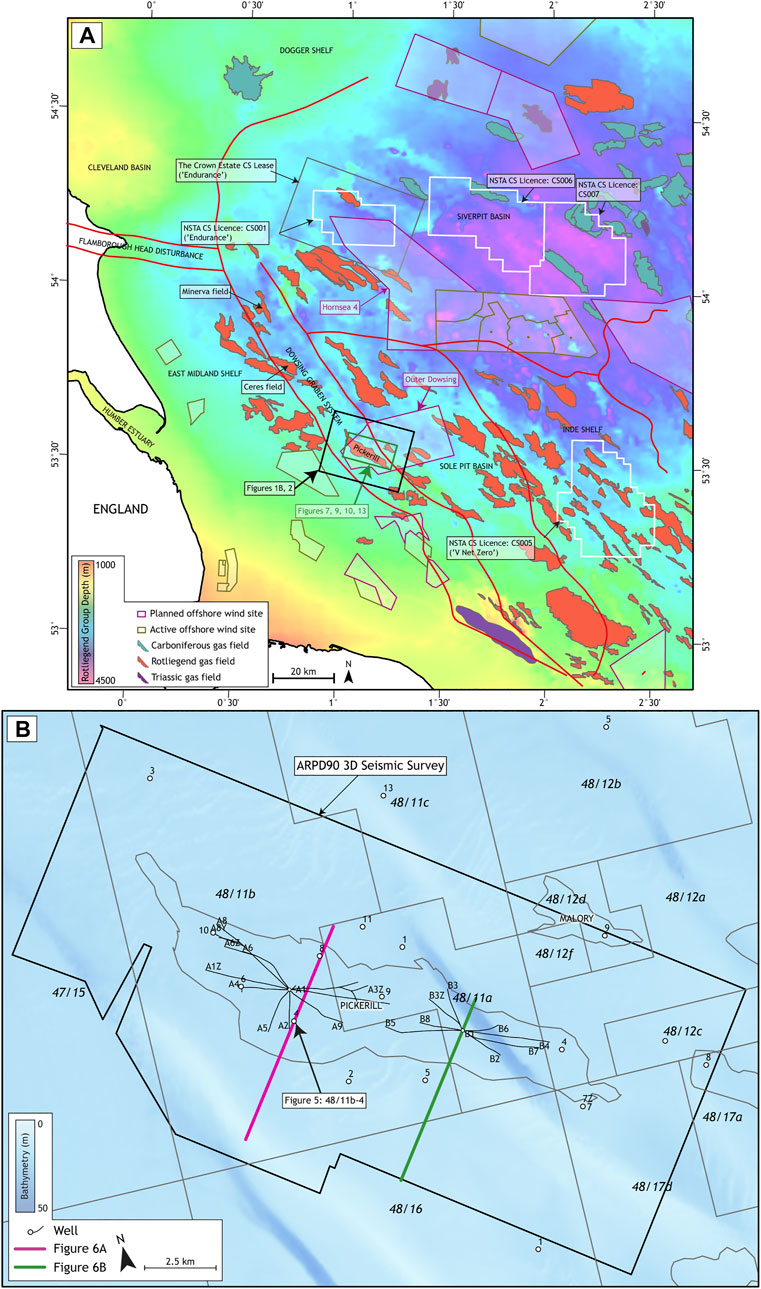
FIGURE 1. (A) Map depicting the area offshore to the east coast of England and illustrating the main structural zones, gas fields (coloured according to stratigraphic age of reservoir), CO2 storage licences and permits and wind farms. The location of maps shown in Panel (B) Figures 2, 7, 9, 10, 13 are also highlighted for reference. The depth to Rotliegend Group which forms the basemap to the image is from Gast et al. (2010). CS: CO2 storage, NSTA: North Sea Transition Authority. (B) Map showing the location of the Pickerill field, UKCS reference blocks, wells, cross-sections and the ARPD90 3D seismic volume.
By 2030, CO2 sequestration at CS001 and CS005, assuming their targeted injection rates are achieved, would result in the UK government achieving its target of 20–30 MtCO2/yr (HM Government, 2021). However, it is estimated that 75–175 MtCO2/yr is required by 2050 to meet net-zero carbon emissions (NSTA, 2021). Even if these two projects are still operational by 2050, further sites will clearly be needed.
The Pickerill field is located on the western edge of the Southern North Sea, approximately 150 km from the Humber Estuary (Figure 1A). It is positioned below the Dowsing Graben System; a NW-SE-striking fault zone that separates the East Midlands Shelf (west) from the Sole Pit Basin (east). Several depleted or producing gas fields lie in the vicinity of the Pickerill field, which are also affected by this fault zone and include the Minerva, Ceres and Lancelot fields (Figure 1A). However, the Pickerill field’s produced gas volumes (439 Bcf) make it not only the largest depleted field within the fault zone, but the third largest in the Southern North Sea when existing CO2 storage licences are excluded. Despite this, any future re-use of the Pickerill field as a CO2 storage site could be curtailed by plans to construct a wind farm (“Outer Dowsing”) directly over it (Figure 1A), posing logistical challenges to the drilling of CO2 wells and seismic monitoring.
Sufficient gas volumes were produced at Pickerill to warrant a critical assessment of the field to determine if it could form a viable CO2 storage site. We focused mainly on geoscientific criteria including mapping of the structure and overburden using 3D seismic data, metrics of reservoir quality using petrophysical analysis and routine core analysis reports, and the integration of well production data.
Regional Geological Background
The regional (structural and stratigraphic) background and exploration history of the Southern North Sea are well documented within several overview publications including Cameron et al. (1992), Glennie (1998), Glennie and Underhill (1998), Underhill (2003), Evans et al. (2003) and Doornebal and Stevenson (2010). For this paper, we review the key geological events that impacted the structural and stratigraphic features that are specific to the Pickerill field.
Although crystalline basement rocks have not been penetrated in the Southern North Sea, they are believed to be of Lower Palaeozoic (Caledonian) age and related to the plate cycle that saw the closure of the Tornquist Sea. The associated deformation created a NW-SE zone of structural weakness that would later be re-activated at various stages in the Southern North Sea’s geological history (Glennie and Underhill, 1998). The eventual collapse of the Caledonian foreland initiated crustal extension over NW-SE-striking “Tornquist” rift-related extensional basins, in which thick sequences of Devonian and Carboniferous sediments were deposited (Leeder, 1988; Besly, 1998), sourced from the Caledonian landmass to the north. To date, no Southern North Sea wells have penetrated the entire Carboniferous succession and few Devonian well penetrations exist, located near the Mid North Sea High.
During the Carboniferous, the UK was positioned on the southern margin of the Laurentia continent, separated from Gondwana by the Rheic Ocean, the subduction and closure of which would ultimately form the Variscan mountains. During the late Carboniferous (Pennsylvanian), a large foreland basin developed to the north of these mountains, and the principal sediment source direction switched from the north (Caledonian) to the south (Variscan). Thick accumulations of fluvio-deltaic Westphalian and Stephanian sediments were deposited within the foredeep, however, as the Variscan deformation front migrated further northwards during the latest Carboniferous, the area experienced structural inversion which led to the uplift and folding of Carboniferous strata in addition to the variable removal of the Westphalian-Stephanian succession (Leeder and Hardman, 1990; Coward, 1993; Corfield et al., 1996).
The Anglo-Polish Trough or Southern Permian Basin was initiated during the middle-late Permian by a phase of renewed rifting, accompanied by volcanism, across an extensive area to the north of the Variscan front spanning much of NW Europe from eastern England to Poland (Glennie and Underhill, 1998; Underhill, 2003). Continued activity on late Carboniferous fault systems (Glennie, 1997) led to further reactivation of the NW-SE fault pattern, in addition to N-S and W-E striking “link-up” faults to accommodate strike-slip motions (Oudmayer and Jager, 1993). During the middle Permian (Guadalupian), an arid desert covered most of the Southern Permian Basin, consisting of central playa lakes, flanked by mixed aeolian/fluvial systems (Gast et al., 2010) in which the Rotliegend Group was deposited. The latter would come to be a prolific gas-bearing interval across NW Europe. An extensive dune belt formed within the centre of the Southern Permian Basin, but the peripheral regions (such as the western fringe of the Southern North Sea) were progressively onlapped and increasingly influenced by river systems draining off the marginal Pennine High and London-Brabant Massif (George and Berry, 1993). This depositional configuration was brought to an abrupt halt during the late Permian (Lopingian) when a series of marine transgressions of the Boreal Sea to the north resulted in a distinct facies change with the deposition of the Zechstein Group. This sequence of carbonates and evaporites (anhydrites and soluble salts) provide a regional super-seal to the Rotliegend Group gas accumulations.
The deposition of the Bunter Shale Formation and Bunter Sandstone Formation marked the renewal of continental deposition during the early Triassic. The middle-late Triassic Haisborough Group comprises various argillaceous sequences with blocky halite intervals (Rot, Muschelkalk and Keuper halites). These intervals were the product of periodic marine incursions from the Tethyan Sea to the south (Bachmann et al., 2010), culminating with a fully marine connection established during the early Jurassic. Thickness variations observed within the Haisborough Group indicate that extensional activity within Dowsing Graben System was initiated during the late Triassic (Grant et al., 2019). Subsequent phases of extension would affect the area during the late Jurassic-early Cretaceous, resulting in substantial Mesozoic depocentres including the Cleveland, Sole Pit and Broad Fourteens basins (Glennie and Underhill, 1998).
By the late Albian, the rise in sea level and drowning of immediate hinterlands cut-off sediment supply into the Southern North Sea and this brought a shift to pelagic sedimentation with the deposition of the Chalk Group (Oakman and Partington, 1998). The Chalk Group is relatively thin over the Dowsing Graben System following Cenozoic uplift and tilting. Several phases of uplift affected the area during the late Mesozoic-Cenozoic in association with Alpine-Atlantic plate movements resulting in the inversion of several Mesozoic basins. Uplift also affected the area during the Neogene leading to a marked down-to-the-east tilt being imparted on the basin (Brackenridge et al., 2020).
Brief Introduction to the Pickerill Field
The Pickerill field straddles four UKCS Blocks (48/11a, 48/11b, 48/12b and 48/17b) (Figure 1B) and sits immediately south-west of a NW-SE-striking zone of major structural deformation that marks the eastern edge of the Dowsing Graben System and incorporates overburden faulting and salt mobility (halokinesis) (Figures 1A, 2). It was discovered within Block 48/11b when Conoco (now ConocoPhillips), drilled their 48/11b-4 (1984) exploration and 48/11b-6 (1985) appraisal wells and found entirely gas-bearing Rotliegend Group (Leman Sandstone Formation).
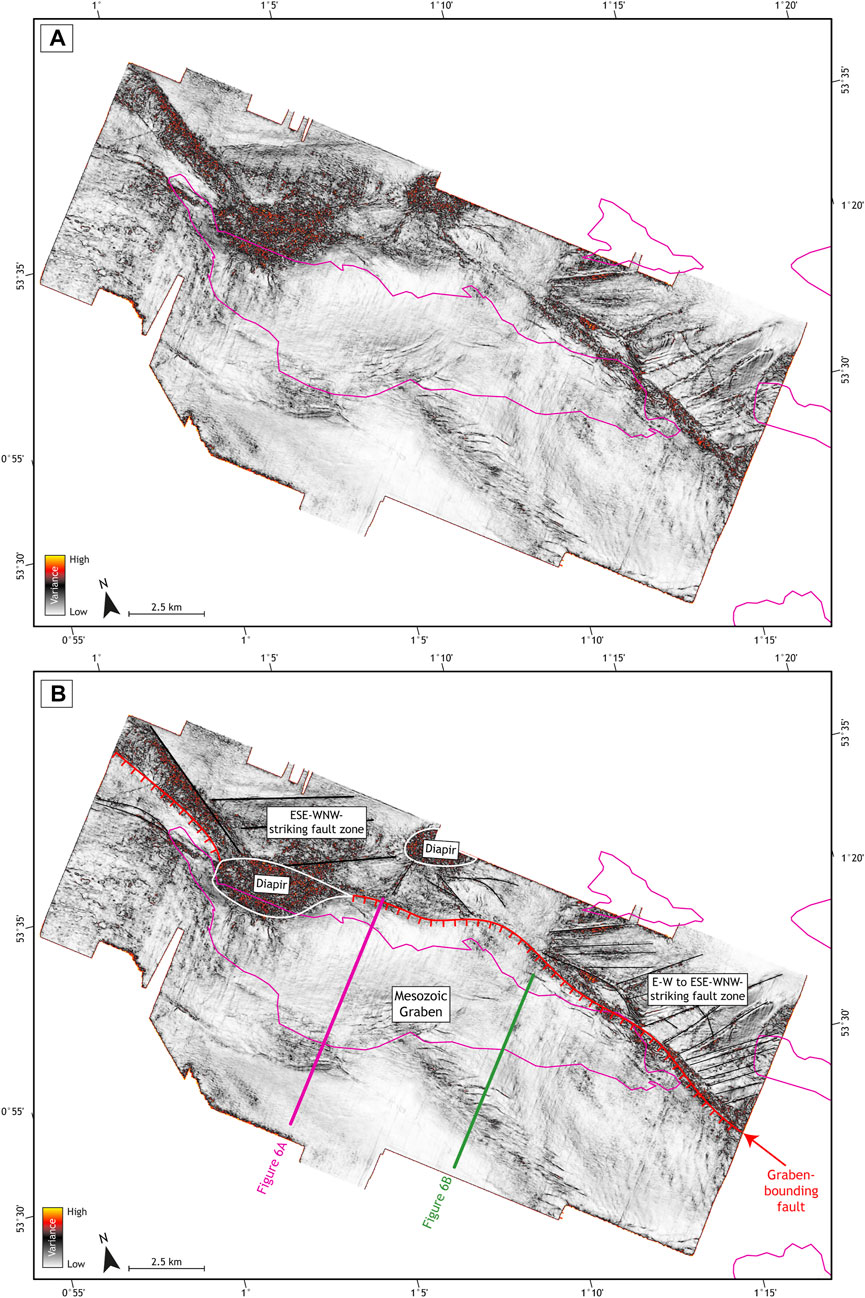
FIGURE 2. Un-interpreted (A) and interpreted (B) coherency (variance) timeslices extracted from the ARPD90 3D seismic cube at 500 ms. The timeslice illustrates the structural deformation (faulting and salt diapirism) that is present within the overburden to the Pickerill field.
Although the initial Annex B award assumed that the field was a single entity, subsequent exploration and appraisal drilling found that the field is structurally complex and instead consisted of multiple fault-bound pressure compartments. In 1986, Arco discovered gas within their 48/11a-7 (B1) well but with a different gas pressure gradient than that within Block 11b (Figure 3) thus the field was considered to hold separate west (11b) and east (11a) accumulations. Block 48/12b was drilled by British Gas (now Centrica) in 1987, who encountered gas within their 48/12b-4 well and the gas pressure gradient there-in implied that it was in communication with the 11a wells and thus it was considered an extension to the eastern accumulation. Subsequent drilling in the neighbouring block (48/17b) by Mobil (now ExxonMobil) took place in 1988 but the well (48/17-7/7Z) did not flow on testing and was not in pressure communication with the rest of the field.
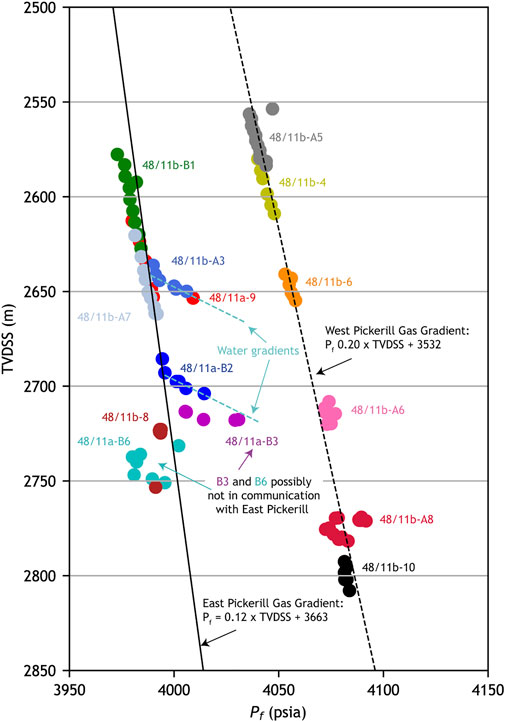
FIGURE 3. Formation pressure gradients (Pf) for selected Pickerill field wells. Two distinct gas pressure gradients can be identified. Two shallow gas-water-contacts can also be observed within 48/11b-A3 and 48/11a-B3. TVDSS: True Vertical Depth Sub-Sea.
Development drilling commenced from two platforms; the A Platform which is in block 48/11b licence and targets mainly (but not exclusively) the western accumulation and the B Platform, which is in block 48/11a and targets the eastern accumulation. Many surprises were encountered during the development drilling phase of the field, including perched gas-water-contacts, poor reservoir quality and a dry well, all described in detail by Werngren et al. (2003). The field was brought onstream in 1992 and delivered 439 Bcf of gas up until 2017 (Figure 4). Most of this volume was extracted during a period between 1993 and 1999, after which production steadily declined, with the field delivering <5 Bcf/yr in its final 10 years of life (Figure 4).
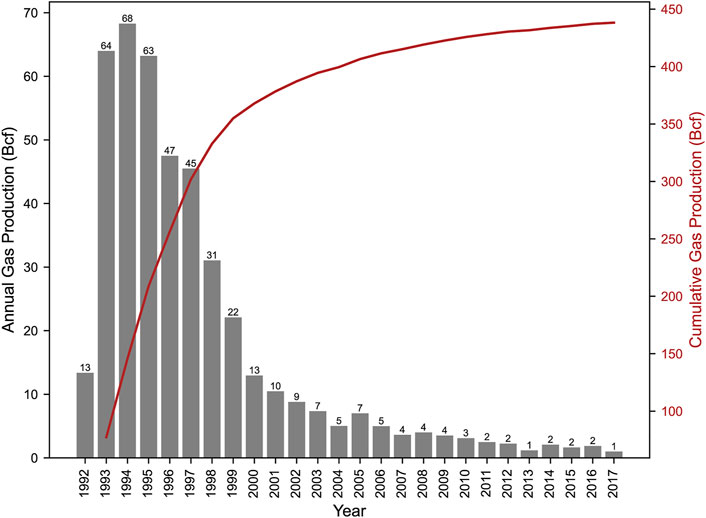
FIGURE 4. Annual (grey bars) and cumulative (red line) gas production from the Pickerill field. Around 440 Bcf was produced from the Pickerill field in total. Production data accessed from NSTA (2022b).
In light of this complex drilling history, we chose to focus our efforts on determining whether any of the individual structural compartments merit consideration as CO2 storage sites based on their geological and production characteristics.
Datasets and Study Methodology
Subsurface Database
The datasets used within this study were accessed from the UK National Data Repository (NSTA, 2022a) and included a 3D seismic volume, digital wireline logs (for the 30 wells drilled in the field) and the results of core analysis (for 11 wells). The seismic volume used was the ARPD90 3D survey which covers the entire field (Figure 1B). The survey was acquired in 1990 by Geco (now WesternGeco) and consisted of 199 lines shot along a NE-SW orientation. It was processed (including a post-stack time-migration) by CGG in 1991, resulting in a 3D volume comprising 1924 inlines and 965 crosslines with a spacing of 12.5 m. It uses a zero-phase, negative polarity convention where a “soft” event corresponds to a seismic peak. At reservoir depth, the survey exhibits a dominant frequency of c. 30 Hz which when taken with a typical Rotliegend Group interval velocity of c. 4,300 m/s, results in a vertical resolution of c. 35 m.
Methodology
Seismic Interpretation, Depth Conversion and Associated Uncertainty
Well-to-seismic ties were assessed by using the well-established method of creating synthetic traces at well locations using wireline logs and a Ricker wavelet (Figure 5). This allowed us to select the main impedance boundaries for seismic interpretation (Figure 6). Depth conversion was performed using a layer-cake velocity model combining two-way-time surfaces and velocity functions derived from wells. The Chalk Group was assigned a uniform interval velocity of 2,800 m/s and the Mesozoic succession was assigned a velocity gradient of V = 1.13 * TVDSS + 1717. An interval velocity map was created for the Zechstein Group, which allowed us to account for areas of high-velocity (c. 6,000 m/s; where carbonates and anhydrites comprise most of the Zechstein Group) and low-velocity (c. 3,500 m/s, where thick salts are present) intervals. The resulting velocity model predicted the Top Rotliegend Group depth with residual errors mostly of 2%.
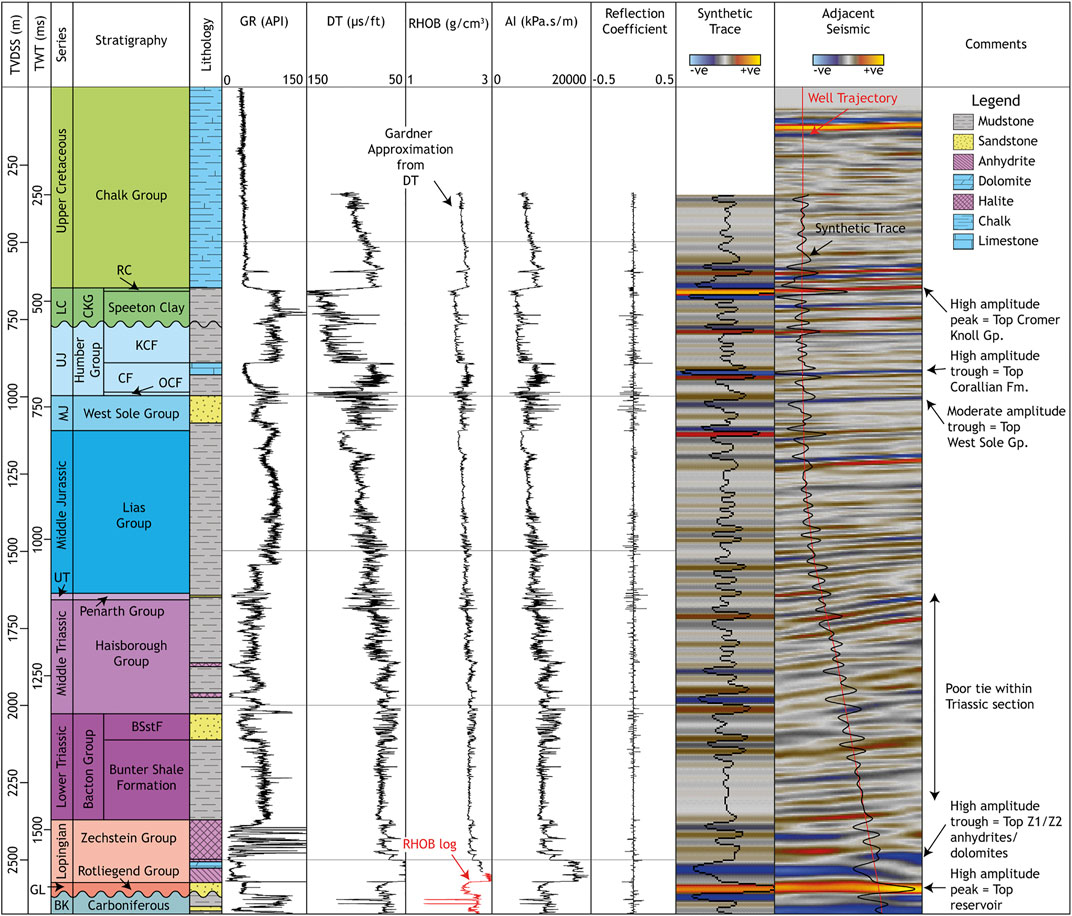
FIGURE 5. Stratigraphic chart and seismic tie for the Pickerill field discovery well 48/11b-4, the location of which is shown in Figure 2A. AI, Acoustic Impedance; BK, Bashkirian; BSstF, Bunter Sandstone Formation; CF, Corallian Formation; CKG, Cromer Knoll Group; DT, Compressional Sonic Slowness; GL, Guadalupian; GR, Gamma Ray; KCF, Kimmeridge Clay Formation; LC, Lower Cretaceous; MJ, Middle Jurassic; OCF, Oxford Clay Formation; RC, Red Chalk; RHOB, Bulk Density; TVDSS, True Vertical Depth Sub Sea; TWT, Two-way time; UJ, Upper Jurassic; UT, Upper Triassic.
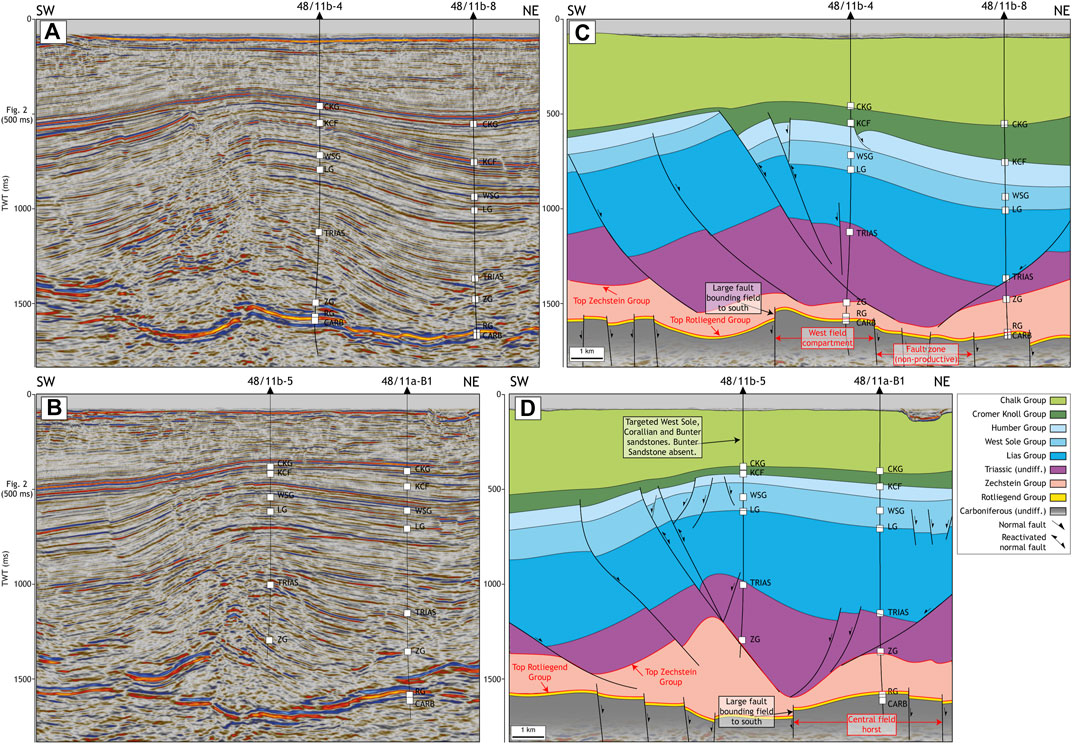
FIGURE 6. Un-interpreted (A,B) and interpreted (C,D) SW-NE striking seismic panels through the western (A,B) and eastern (C,D) parts of Pickerill field. The location of the panels are shown in Figure 1B. CARB, Top Carboniferous (Base Permian Unconformity); CKG, Cromer Knoll Group; KCF, Kimmeridge Clay Formation; LG, Lias Group; RG, Rotliegend Group; TRIAS, Top Triassic; WSG, West Sole Group; ZG, Zechstein Group.
The structural deformation evident within the shallow overburden (expressed as high seismic variance within Figure 2) has detrimental impacts on the seismic imaging at depth and can make for challenging interpretation of the top reservoir and top seal reflectors. In some areas, such as underneath zones of thickened salt and diapirs (e.g., to the north-west of the field: Figure 2), the Top Rotliegend Group (reservoir) reflector is discontinuous and low amplitude (Figures 7A,B) leading to some uncertainty in the mapping around these areas. Similar areas of poor data quality are owed to thinning of the Zechstein Group (Stassfurt Halite Formation) and rafting of the high-amplitude Plattendolomit Formation, which are also evident from seismic variance and amplitude maps of the Top Rotliegend Group reflector (Figures 7A,B).
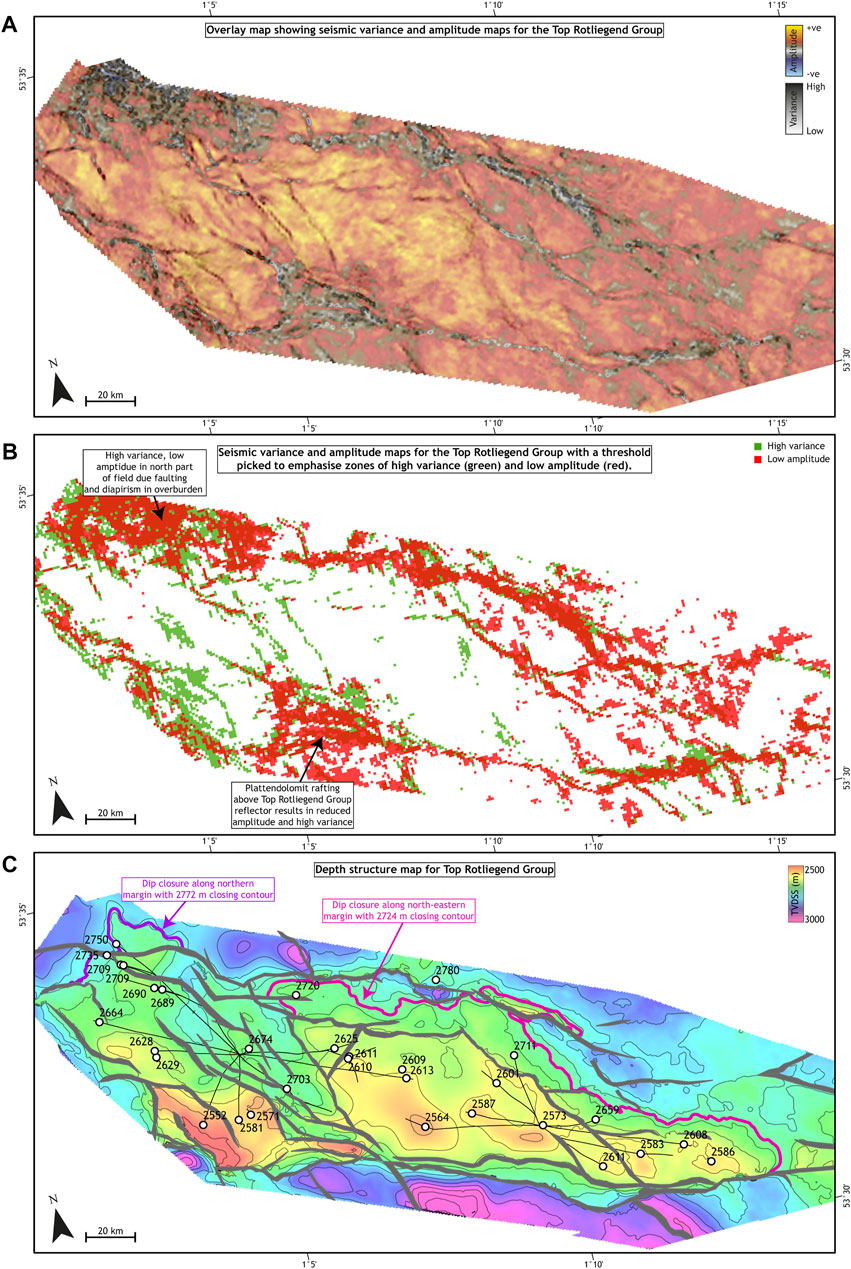
FIGURE 7. (A) Seismic amplitude and variance maps for the Top Rotliegend Group (top reservoir) overlain with transparency. (B) As (A) but with a colour threshold designed to highlight high variance (green) and low amplitude (red). (C) Corresponding depth structure map with interpreted fault polygons.
Modelling CO2 Storage Capacity
Defining the CO2 capacity of a structure or aquifer is a complex process that involves the integration of the subsurface geology, reservoir simulations and various non-technical factors. Consequently, different subsets of CO2 capacity calculations have been proposed (Bachu et al., 2007; Bradshaw et al., 2007; Kopp et al., 2009).
Our investigation of the Pickerill field includes a simple calculation of CO2 storage capacity assuming that the produced gas (at reservoir conditions) can be replaced with the same mass of CO2. While this method is fairly well adopted for depleted gas fields (Bachu and Shaw, 2003; Holloway et al., 2006; Bachu et al., 2007) there are some assumptions and drawbacks that should be highlighted. It firstly assumes that no alteration has occurred to the reservoir during prior gas extraction (such as water invasion, fracturing or near-well formation damage) such that the entire pore space initially occupied by methane molecules is available for CO2 molecules. The drive mechanism for the Pickerill field is unclear, and any water invasion will reduce the pore space available for CO2 injection and result in this method overestimating CO2 capacity, but similar nearby Rotliegend Group gas fields were depleted without aquifer support (Garland, 1991; Stuart, 1991; Smith and Starcher, 2003; Offer, 2020).
We also assume in our calculations that the reservoir is at hydrostatic pressure when it will actually be at much lower pressure following gas depletion. This will result in us overestimating the density of the initial injected CO2; however, it would be expected that CO2 injection would ultimately lead to re-pressurisation of the reservoir. Despite these drawbacks, in the absence of a working Rotliegend Group CO2 storage exemplar, and the dynamic data associated with it, we believe the approach remains valid in preliminary assessments of CO2 capacity.
The method was proposed by Bachu and Shaw (2003) and is calculated as:
where ρCO2r is the expected CO2 density within the reservoir in kg/m3, VPG is the volume of produced gas in m3 and FVF is the gas formation volume factor, typically expressed as a ratio that quantifies the expansion of gas from the reservoir to surface conditions. MCO2 was calculated using the VPG for each Pickerill development well; provided by the NSTA’s production data portal (NSTA, 2022b) and the value for FVF was taken from Werngren et al. (2003). While the phase and density of CO2 is an important and sensitive parameter for shallow structures, within deep structures (>2,000 m), the CO2 will probably be held as a supercritical fluid with a density of c. 670 kg/m3. Assuming a geothermal gradient similar to that of the East Midlands Shelf (de Jonge-Anderson et al., 2022), hydrostatic pressure conditions (10 MPa/km), and a reservoir depth of 2,634 m, CO2 resides as a supercritical phase with a density of 673 kg/m3 (Span and Wagner, 1996; Lemmon et al., 2021).
Stratigraphic and Structural Characteristics
Stratigraphy and Seismic Character
A typical stratigraphic sequence at Pickerill field is exemplified within discovery well 48/11b-4 (Figure 5). The Top Rotliegend Group (reservoir) reflector is marked by a high-amplitude seismic peak as the boundary between the hard dolomites and anhydrites at the base of the Zechstein Group and the soft sandstone generates a strong impedance contrast. Where the overburden lacks significant faulting and/or dipping reflectors, the Top Rotliegend Group is continuous and high-amplitude and can be tracked with confidence. However, in areas with significant faulting, salt swells/diapirs, or rafting of the Top Plattendolomit Formation reflector, the Top Rotliegend Group appears discontinuous and low amplitude, adding uncertainty to mapping of the reservoir.
The seismic character of the Zechstein Group (seal) is characterised by low amplitude, chaotic halite intervals and high amplitude, sub-continuous carbonate intervals. Halokinesis has resulted in a mixture of thickened, halite-rich intervals and thinned, carbonate-rich intervals present across the field, which produces seismic imaging and interpretation challenges. The Top Plattendolomit Formation (a key seismic marker in some areas of the field, and across the wider Southern North Sea region) is absent within 48/11b-4, though we do observe a seismic trough at the base of the Zechstein Group sequence; owed to the presence of a hard interval comprising the Hauptdolomit, Basalanhydrit and Werraanhydrit formations. The Top Zechstein Group is marked as a seismic trough owed to the impedance boundary between soft Bunter Shale Formation shales and harder Zechstein Group halites, but this marker is discontinuous over the field.
We see less clear and correlatable seismic markers within the Triassic stratigraphy in 48/11b-4. The Top Triassic reflector (Penarth Group) does not present an obvious seismic reflector. Some seismic troughs at the base of the Haisborough Group can be attributed to hard, thin halite intervals such as a Muschelkalk Halite Member, but these do not correlate clearly with the adjacent seismic signature.
The shallow overburden is marked by some clearer reflectors including the Top Corallian Formation (hard, high-amplitude, continuous), Base-Cretaceous Unconformity (soft, high-amplitude, sub-continuous) and Top Cromer Knoll Group (soft, high-amplitude, continuous). The shallowest interval is marked by the Chalk Group; a unit with a distinctive low Gamma Ray (GR) signature, a linear velocity gradient and a lack of internal seismic character.
Structural Character
The overburden to the Pickerill field is characterised by a complex extensional system including a graben hosting thickened Triassic-Jurassic sequences and listric faulting (Figure 6). The faults mostly tip-out at the base of the Cromer Knoll Group and detach within Zechstein Group halites, but some appear to only affect either Jurassic or Triassic intervals, detaching possibly within argillaceous units within the Lias Group or Haisborough Group respectively. Gentle folding of the base Chalk Group reflector immediately over the graben is possibly evidence of Cenozoic inversion across the faults, though they retain normal displacements.
While the Top Zechstein Group reflector is strongly discontinuous over the field, it appears to thin within the fault hangingwalls with some swelling within their respective footwalls (Figure 6). One such swell has folded the Mesozoic sequences into an anticline hosting the Triassic Bunter Sandstone reservoir which was targeted by the 48/11b-5 well, located immediately south of the Pickerill field (Figure 6B). Salt withdrawal over the central portion of the field sees the Zechstein Group thin to <100 m, though there does not appear to be any areas where the sub-salt and suprasalt weld.
The Zechstein Group acts as a significant detachment layer that decouples the Mesozoic-Cenozoic deformation described above from the Upper Paleozoic succession. The Top Rotliegend Group horizon is dissected by high-angle normal faults that dip, mostly, to the northeast and strike NW-SE and WNW-ESE. Major faults can be picked by identifying offset at the Top Rotliegend Group horizon (Figure 6), but more subtle faults are only visible through the study of seismic attributes (Figures 7A,B). In this instance, the faults can be recognised as linear features exhibiting low seismic amplitude and high seismic variance (Figure 7B).
These faults tip out at the base of the Zechstein Group and are probably basement rooted (though seismic reflectivity beneath the Top Rotliegend Group reflector is poor). The displacements associated with the faults are fairly small (<30 m), except for a series of large faults (<400 m throw) along the southern and western margins of the field (Figures 6, 7C).
CO2 Storage Evaluation of Pickerill Field
Reservoir Quality
The presence of a porous and permeable reservoir is crucial to a CO2 storage site’s viability. As Pickerill is a depleted gas field, a reservoir formation is clearly present, however, as the physical properties of supercritical CO2 differ from methane (e.g., lower buoyancy), a productive gas reservoir does not necessarily make for a prospective CO2 storage reservoir. The reservoir interval at Pickerill is the Permian, Rotliegend Group, Leman Sandstone Formation (LSF). While the LSF consists almost entirely of sandstone, reservoir quality is variable and appears to be controlled by a combination of primary depositional facies changes and burial diagenesis. In the west of the field, aeolian sandstones dominate the sedimentary succession and display excellent reservoir properties (typically exhibiting porosities of 15%–18% and permeabilities of 10–100 mD) (Figure 8A). Towards the top of the LSF, the aeolian sandstones have been re-worked following the late Permian marine transgression marked by the Kupferschiefer (Marl Slate). This flooding event removed sedimentary fabric but also led to carbonate cementation, which restricts porosity in the uppermost part of the LSF to <5% (Figure 8).
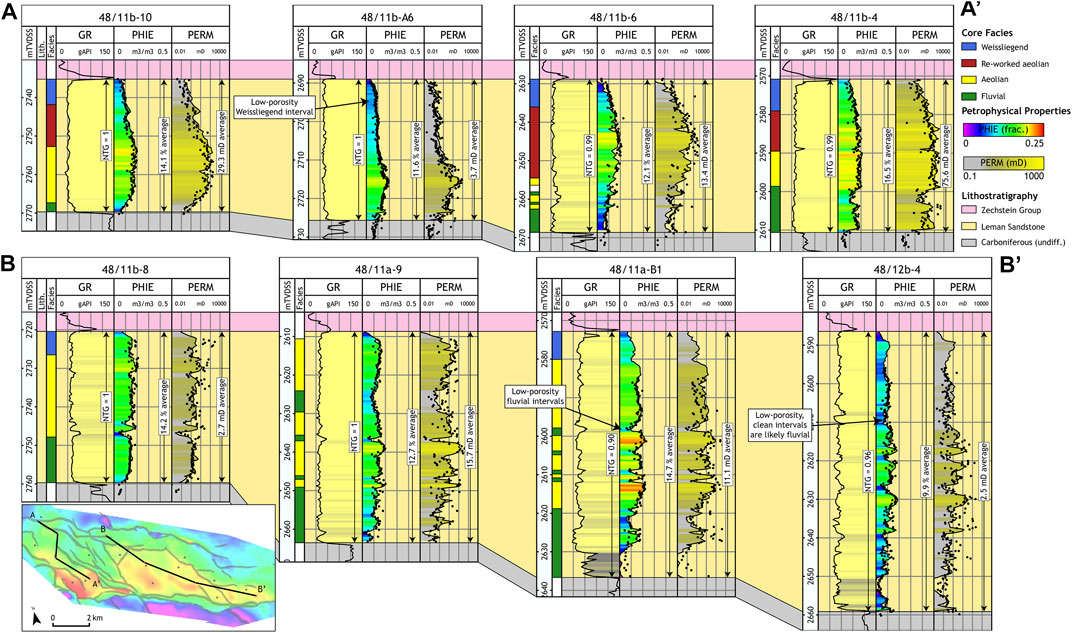
FIGURE 8. NW-SE oriented well correlations through the western (A) and eastern (B) parts of the Pickerill field and focusing on the Rotliegend Group stratigraphic interval. Net-to-gross is calculated as the fraction of the reservoir with Volume of Shale <25%. Average porosity is calculated using an arithmetic average but average permeability is calculated using a harmonic average. The depth to Top Rotliegend Group is shown in the inset map, which can also be viewed in Figure 7C. GR, Gamma Ray; PERM, Permeability; NTG, Net-to-gross; PHIE, Effective porosity.
Fluvial sandstones (sheet-flood, channel, crevasse splay) are found at the base of the LSF and generally show more restricted reservoir quality. Within these poorly sorted and occasionally micaceous intervals, porosity is generally <10% and permeability <1 mD.
A complex reservoir quality distribution can be observed at Pickerill field, which is driven mostly by variations in sedimentary facies. The gross LSF interval broadly thickens eastward across the Pickerill field (Figures 8, 9A), which the exception of locally thicker sequences within 48/11a-B3Z and 48/11a-B5 wells (Figure 9A). While the western compartment exhibits a fairly uniform thickness of between 35 and 40 m, the unit thickens to 70 m within the eastern compartment. The best reservoir quality is found in the south-west of the field, with degradation to the east and to the north (Figure 9B). This deterioration can be partly explained by an eastward reduction in the relative contribution of the aeolian facies, and a northward increase in the extent of the low porosity Weissliegend interval. In wells located in the west of the field (transect A-A’ (Figure 8A) and 48/11b-8 (Figure 8B)), most of the LSF succession is composed of aeolian or re-worked aeolian sediments with the Weissliegend interval at the top and a low porosity fluvial interval at the base. In wells located to the east of the field (transect B-B’ excluding 48/11b-8 (Figure 8B)), the Weissliegend interval is less extensive, but there is an increasing fluvial contribution (48/11a-9 and 48/11a-B1) within the middle of the LSF, which does not markedly reduce the NTG, but does reduce the porosity. Ultimately, the best reservoir quality is found within the south of the field where the Weissliegend is less prevalent, and aeolian dunes dominate the sedimentary succession (e.g., 48/11b-4; Figure 8A).
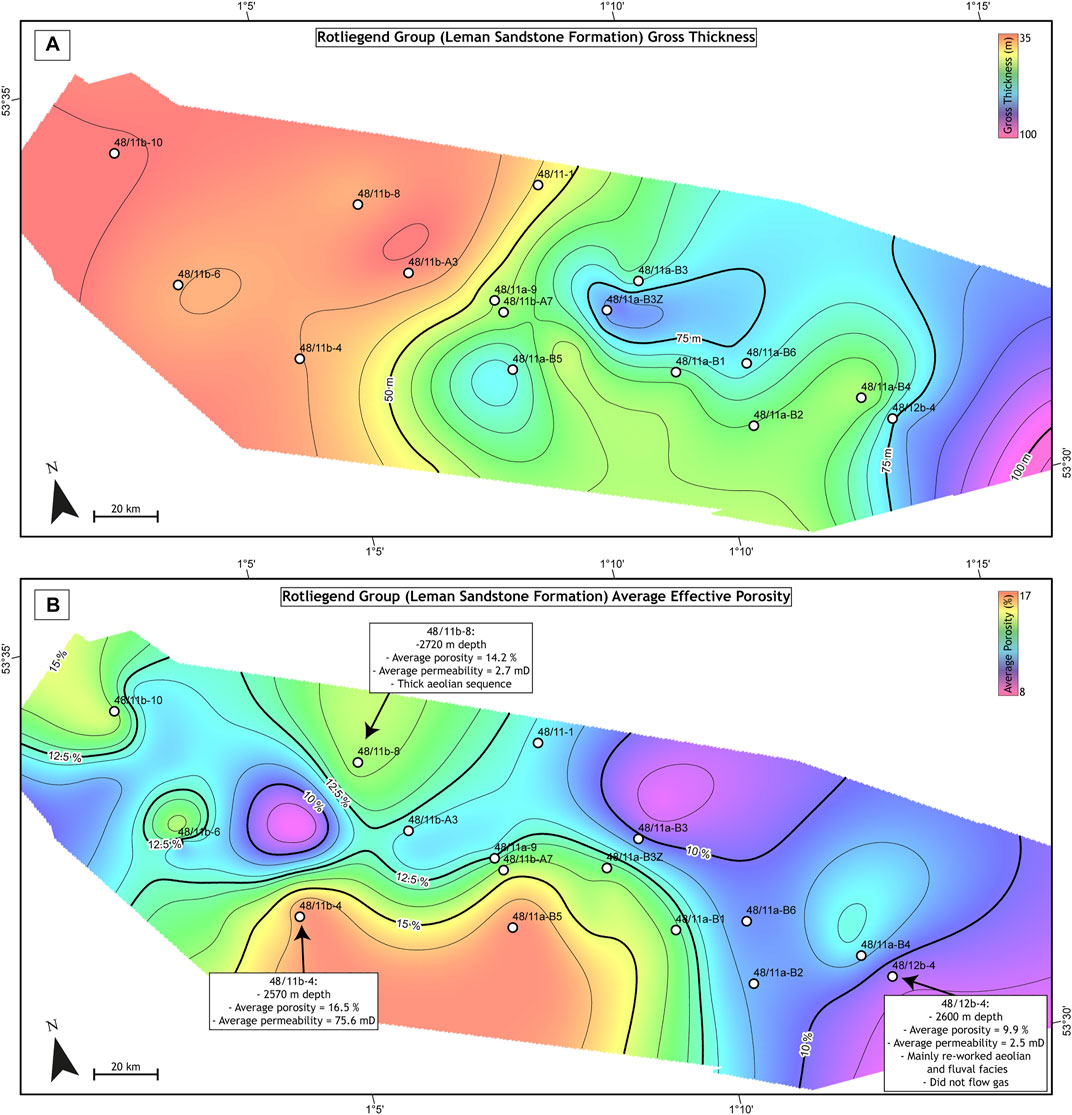
FIGURE 9. Maps of gross reservoir thickness (A) and average effective porosity (B) created by the gridding of well data points. Gross reservoir thickness is measured as the true vertical thickness from Top Rotliegend Group to Top Carboniferous. The porosity is measured as the arithmetic average of the effective porosity log as modelled within each well (see Figure 8 for examples).
Seal Integrity
A low-permeability, laterally extensive sealing formation is another important aspect to consider in the assessment of a prospective CO2 storage site. While the regional Zechstein Group super-seal is present over the field, halokinesis has led to swelling and welding within the unit (Figure 10B) and coincides with (and probably initiated) extensional faulting in the Mesozoic overburden. An inverted graben directly overlies the field (Figure 6), but a more complex NW-SE-oriented fault zone lies immediately to the east, which also hosts at least two salt diapirs near to the northeast flank of the field (Figure 2). Over the field itself, the Zechstein Group is thin (Figure 10B), following the withdrawal of highly mobile halite intervals (possibly having flowed to the northeast where our mapping of the Top Zechstein Group reflector shows a significant swell (Figure 10A) and there are at least two diapirs (Figure 2)). The unit forms a structural low down at around 2,600 m (Figure 10A), coupled with a thinning to <100 m (but without welding entirely) over the central and western parts of the field (Figure 10B). To the east, the Zechstein Group thickens to around 400–500 m due to the presence of a salt pillow.
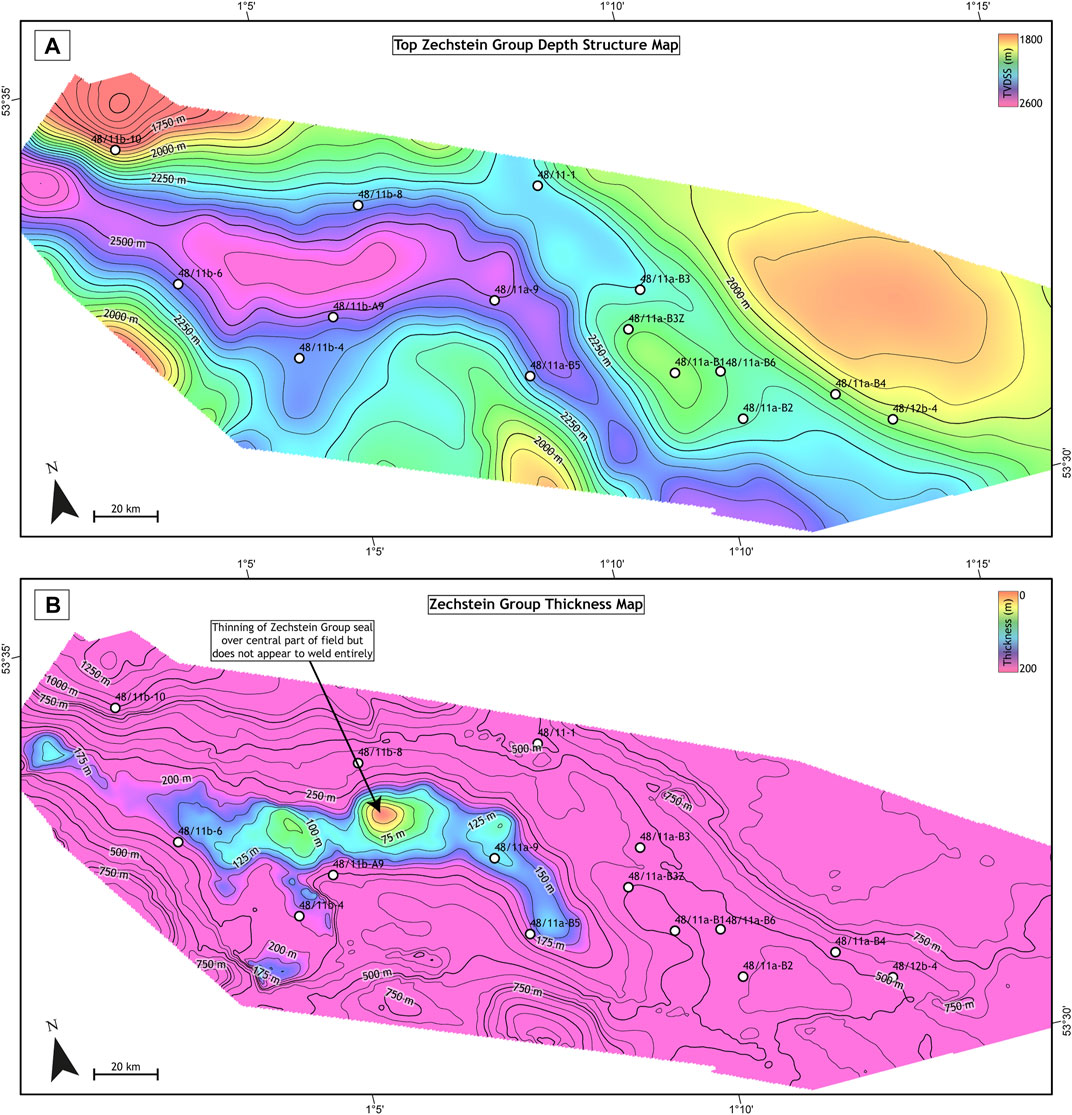
FIGURE 10. Top Zechstein Group depth structure (A) and Zechstein Group thickness (B) maps.
The thickness changes illustrated in Figure 10B are owed to the mobilisation of the Aller, Leine and Stassfurt Halite Formations (Figure 11), which represent three major marine flooding and evaporation cycles (Z2-Z4) across the Southern Permian Basin. The Aller (Z4) and Leine (Z3) Halite Formations are absent over the main area of salt withdrawal and the Stassfurt (Z2) Halite Formation thins to c. 5 m. However, beneath these halites, a relatively uniform sequences of anhydrite and dolomites (Zechsteinkalk—Werraanhydrit Formations (Z1) and Hauptdolomit—Basalanhydrit Formations (Z2)), form a 60–70 m blanket over the Leman Sandstone Formation reservoir. The top of this sequence corresponds to a high amplitude seismic trough at the base of the Zechstein Group (Figure 5). The well 48/11a-9 encountered a 55 m gas column beneath just 5 m of halite (Stassfurt Halite Formation) (Figure 11), which implies that thick halite sequences are not necessarily required for methane trapping and that the tight units beneath are sufficient as a long-term seal.
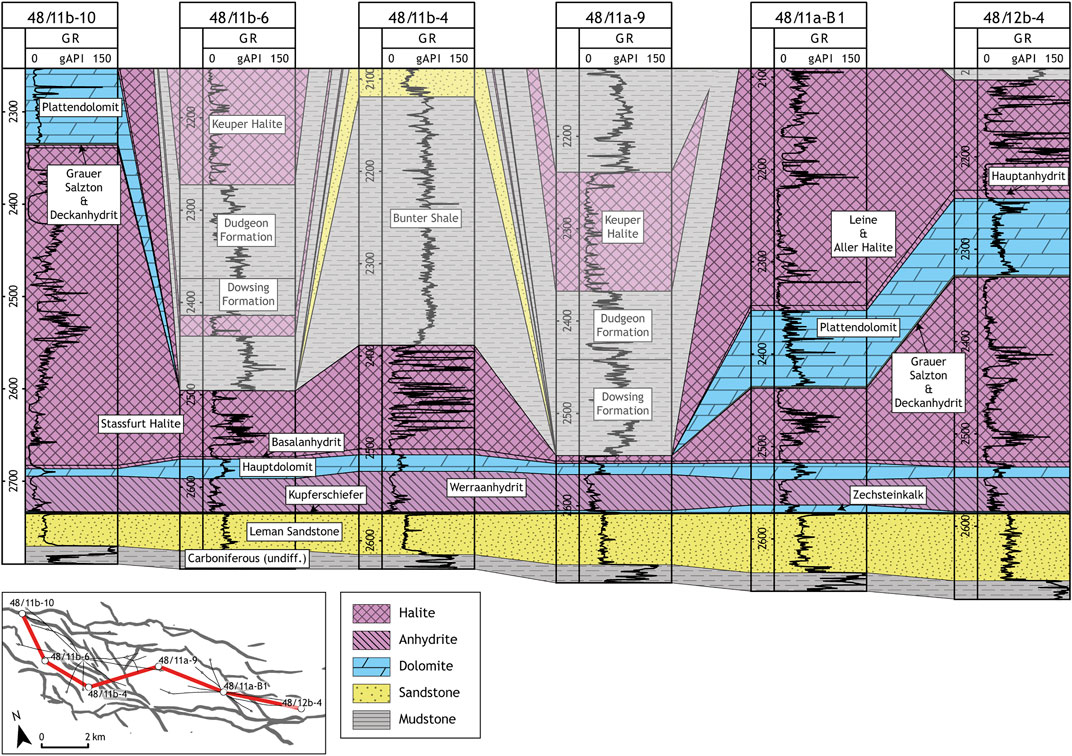
FIGURE 11. NW-SE oriented well correlation flattened at Top Rotliegend Group. Carbonates and evaporites at the base of the Zechstein Group (Zechsteinkalk—Basalanhydrit Formations) are present across the entire field with a combined thickness of 60–70 m. The discovery of a gas column in 48/11a-9, which has a Zechstein Group section consisting of only c. 5 m of salt implies that the underlying dolomites and anhydrites are a sufficient seal for methane. In the main withdrawal area, the Leine and Aller Halite Formations and the Plattendolomit Formation are completely absent, and the Stassfurt Halite Formation thins out almost completely. The wells are plotted in TVDSS (m).
While thinning of the seal can be a concern for the CO2 storage prospectivity of Pickerill field, possibly leading to touchdown of the overburden to the sub-salt reservoirs and creating leakage pathways, there does not appear to be any locations where the supra- and sub-salt sections weld. Sub-salt faults do not appear to extend beyond the upper halite intervals of the Zechstein Group though the seismic expression of the unit is very poor over the central part of the field, leading to some uncertainty in this observation. A pathway to the supra-salt would risk seal integrity as the listric faulting in the overburden (Figure 6) has resulted in a variable Triassic supercrop to the Zechstein Group and the distribution and thickness of the argillaceous Bunter Shale Formation (a secondary seal, if the Zechstein Group is absent) is also unclear.
Structural Compartmentalisation and Production History
The main technical challenge to the CO2 storage potential of the Pickerill field is the compartmentalisation within the structure, which has led to variable gas recoveries from production wells. However, from the analysis of geological structure (Figure 7C), fluid contacts and pressure gradients (Figure 3) and gas well productivity (Figures 12A,C), we were able to identify three compartments (Figure 13) that offer good potential.
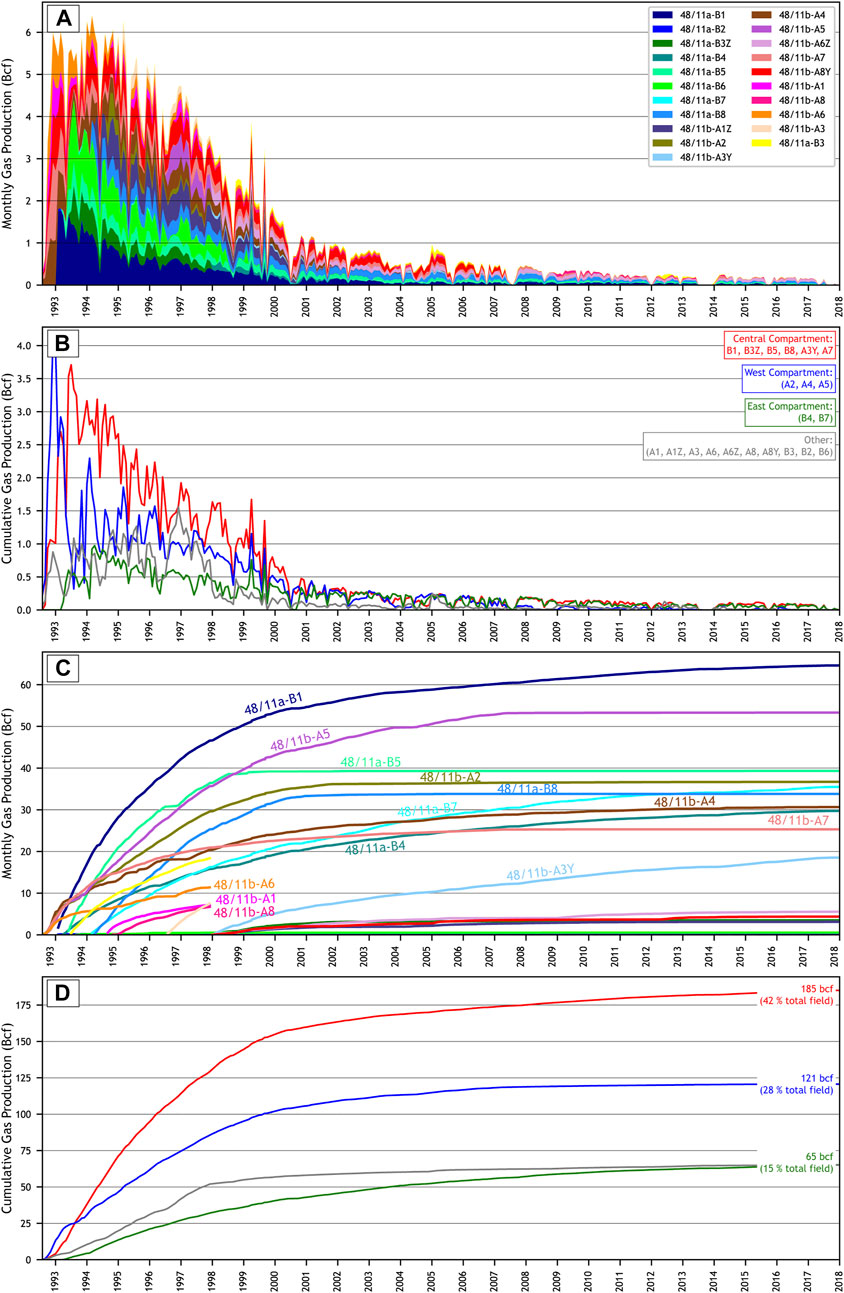
FIGURE 12. A series of charts illustrating the gas production from Pickerill field both by well (A,C) and compartment (B,D). (A) Monthly gas production by Pickerill field development well. (B) Monthly gas production filtered by compartment. (C) Cumulative gas production by Pickerill field development well. (D) Cumulative gas production filtered by compartment. Production data accessed from NSTA (2022b).
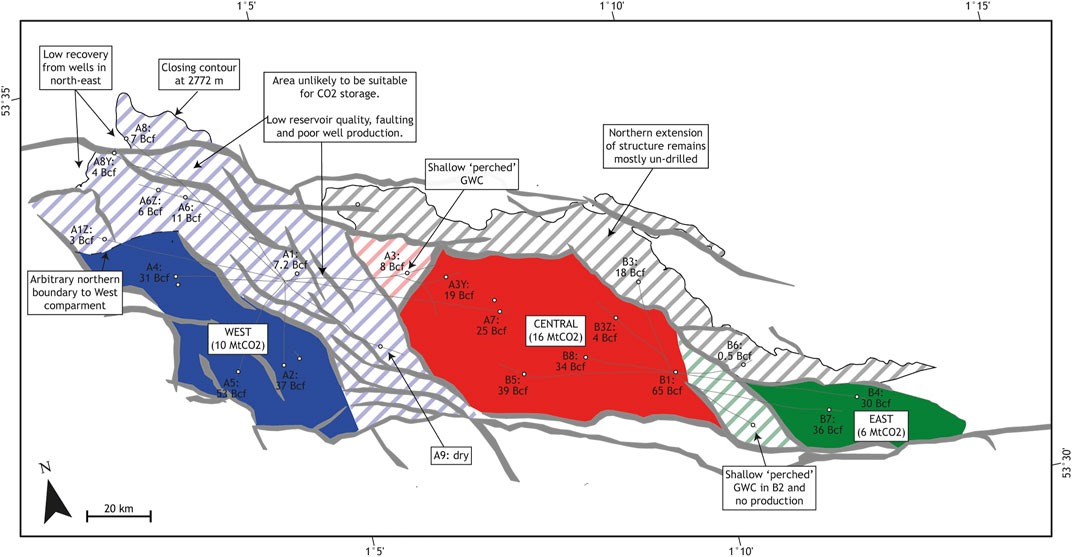
FIGURE 13. Reservoir compartments within Pickerill field identified using results of structural mapping, fluid contacts and pressure gradients and well production profiles. The greatest CO2 storage potential lies in the Central, West, and East compartments. The remaining areas are characterised by low gas recoveries, faulting or local degradations reservoir quality. Production wells are annotated by their cumulative gas production.
The largest structural compartment and most productive part of the field is a structural high (horst) in the central-east part of the structure (we term “Central”) (Figures 6B, 7B, 13). It hosts five highly productive gas wells (B1, B5, B8, A7, A3Y), which have combined to deliver 42% of the entire gas volume of the field (Figure 12D). While a closing contour of 2,724 m can be observed along the downthrown block at its northern margin (Figure 7C) (which also aligns with the gas-water-contact in well 48/11b-8), the northern part is mostly undrilled. Furthermore, pressures recorded in wells B3 and B6 show a slight deviation from the main East Pickerill trend (Figure 3) which may indicate the fault bounding the northern edge of the Central compartment is sealing (Figure 13).
A further structural high (“West”) provides another excellent candidate for CO2 storage. The area offers the best reservoir quality in the field (Figure 9B) and despite only being developed using three wells (A2, A4 and A5), it has delivered 28% of the field’s total production (Figure 12D). A deeper extension to this area lies to the north, and it was targeted by production wells drilled later into the field’s life (A6, A6Z, A8 and A8Y). However, the production from these wells has been limited (Figure 12C; Table 1), the area is structurally complex (Figure 7C) and some of these wells necessitated side-tracking due to poor reservoir quality (Werngren et al., 2003). Therefore, we do not include this northern extension in our West compartment (despite falling within closure). We have placed an arbitrary northern boundary to the West compartment between A4 (highly productive) and A1Z (less productive) wells (Figure 13). Similarly, the graben structure that separates West from Central (Figures 6A, 7B) is considered unviable as it hosts a well that encountered a tight reservoir (A1: Werngren et al., 2003) and a dry hole (A9).
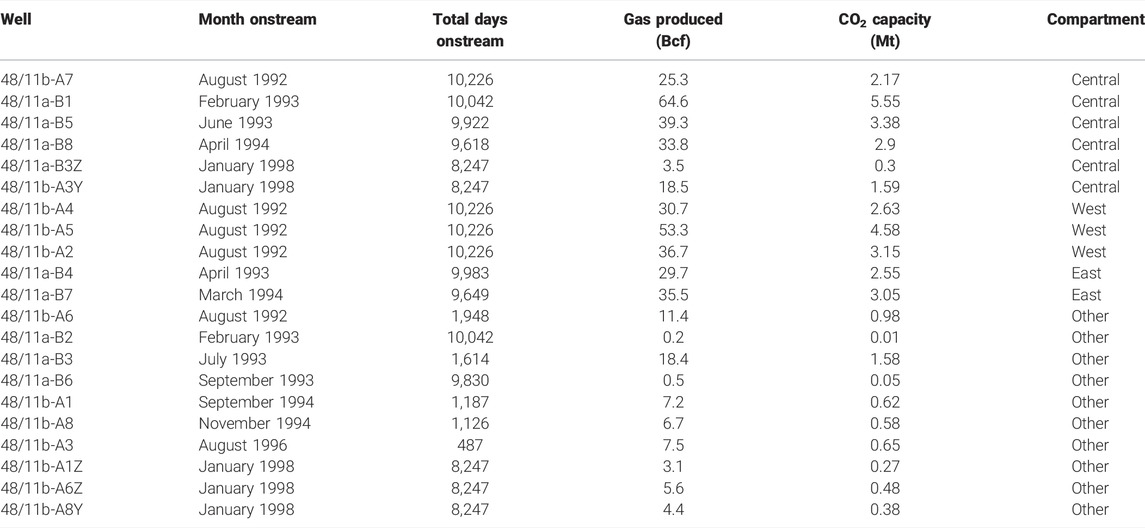
TABLE 1. Summary of the production wells drilled within the Pickerill field, and their potential CO2 capacity (Eq. 1) based on cumulative gas production (assumes a FVF of 222 sm3/rm3 and a ρCO2 of 673 kg/m3). Production data accessed from NSTA (2022b).
The third compartment (“East”) hosts two highly productive wells (B4 and B7) and is separated from Central by a series of NW-SE-striking faults and a well that encountered a shallow gas-water-contact and did not produce (B2) (Figure 13). In common with the Central compartment, the southern margin is defined by fault closure and the northern margin is possibly defined by fault seal, separating it from the downthrown northern extension to the structure. Formation pressure data was unavailable for the wells drilled within this compartment; therefore, it is difficult to assess if the block is in pressure communication with the Central compartment.
CO2 Capacity
Our analysis shows that the Central, West and East compartments at Pickerill pose an opportunity for CO2 storage based on their lack of (seismic scale) internal faulting, good reservoir quality and a competent sealing formation. To assess the mass of CO2 that might be sequestered within these compartments, we analysed the gas production from wells drilled in each (Table 1). The gas recovery by well at Pickerill is variable (Table 1; Figure 12C), however, wells drilled in these three compartments mostly recovered >20 Bcf. Wells drilled in other parts of the field where we consider there to be less potential for CO2 storage, generally recovered <10 Bcf (Table 1).
The equivalent mass of CO2 that could be hypothetically injected into each well based on its recovered gas volumes was calculated using Eq. 1 and assuming a common FVF of 222 sm3/rm3 and CO2 density of 673 kg/m3. This approach introduces a series of assumptions and simplifications which were discussed in the Methodology section of this study. This calculation resulted in values of between 3–5 MtCO2 per well (Table 1), for those drilled in the three productive compartments. Bringing these results together, we calculated a total CO2 capacity for the field of 32 MtCO2 which is split as 16 MtCO2 within the Central compartment, 10 MtCO2 within the West compartment and 6 MtCO2 within the East compartment.
The Triassic Bunter Sandstone Formation is a highly prospective unit for CO2 storage within the Southern North Sea, however, we do not observe a potential for storage within this formation at the Pickerill field. The Bunter Sandstone Formation is absent within many of the wells drilled in Pickerill field, including 48/11b-5 (Figure 6B), which targeted a four-way dip closure at Jurassic and Triassic level to the south-west of the field.
Outer Dowsing Offshore Wind Project
This encouraging CO2 storage potential could be curtailed by the construction of an offshore wind development on the seabed directly overlying the Pickerill field. The Crown Estate granted initial permission in 2021 to Corio Generation and TotalEnergies for their Outer Dowsing Offshore Wind Project (ODOWP) (The Crown Estate, 2021), which spans 500 km2 of the Southern North Sea (Figure 1) and could deliver 1.5 GW offshore wind capacity. Final permissions are expected to be granted in 2022 (Green Investment Group, 2021).
The proposed footprint of the ODOWP overlaps with the Pickerill, Malory, Mordred and Galahad fields (Figure 14). While full geological evaluations for the three latter fields was not conducted, CO2 capacity estimates were calculated using the same approach to that used for Pickerill field. This resulted in a capacity of at least 28 MtCO2 (Figure 14). Provided the ODOWP development proceeds on this basis, this CO2 storage potential will be substantially impacted. The potential CO2 storage operations most strongly affected would be the drilling of injection/production wells and surveying (in particular, towed streamer seismic). Rigs require space above a CO2 storage site to drill CO2 injection, brine production or relief wells. While injection and production drilling would progress during the early stages of a storage project, relief wells are a well control measure and safety exclusion zones would need to be left clear, should drilling be required, for the duration of injection. Fixed wind turbines would also have implications for efforts to monitor the CO2 plume. Monitoring would be achieved through repeated (4D) seismic surveys, but traditional towed-streamer surveying would not be possible if the vessel was required to divert around the turbines. Any seismic monitoring would instead need to be undertaken using more costly seabed-based techniques such as ocean-bottom node surveying (Robertson and McAreavey, 2021).
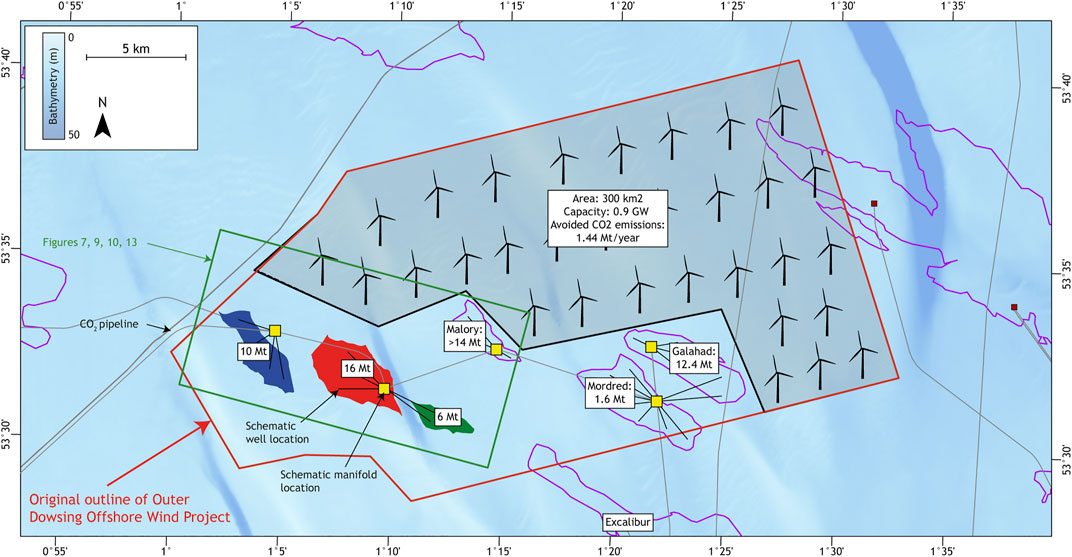
FIGURE 14. An illustration of the possible configuration of a CO2 storage cluster and the Outer Dowsing Offshore Wind Project. The footprint of the wind energy project has been reduced to 300 km2 to ensure no overlap with the depleted fields and the estimated capacity reduced proportionally to 0.9 GW. The quoted CO2 emissions saved is an estimate versus electricity generation from natural gas (IEA, 2020). The CO2 capacities of Mordred, Malory and Galahad are calculated using Eq. 1, by taking their cumulative gas production to date and assuming the same pressure conditions as Pickerill. Locations of pipelines, manifolds, well trajectories and turbine locations are schematic.
The juxtaposition of awarding preliminary planning to a wind development directly over a prospective CO2 store is a prime example of the need for holistic thinking and regulatory alignment within the decarbonisation space. Regulators for offshore wind (The Crown Estate) and offshore CO2 storage (NSTA) have an important role to play in ensuring that proposed projects represent the most appropriate use of the seabed and subsurface geology. If both overlapping projects were to progress, cooperation between the project operators would be essential in ensuring stages of their respective developments are aligned and any disputes are handled appropriately. Despite previous academic work (Bentham et al., 2014) and regulatory reports (Robertson and McAreavey, 2021) on this matter, CO2 storage and offshore wind co-location remains a challenge. A recent example of this can be observed in the Southern North Sea where Northern Endurance Partnership’s Endurance CO2 storage project overlaps with Ørsted’s planned Hornsea 4 wind development and the two operators disagree over whether co-existence is possible (Ørsted, 2022).
However, there remains an opportunity for the operators of the ODOWP to make minor design modifications to ensure that it does not impact the fields’ significant CO2 storage potential. If the footprint of the ODOWP is adjusted to avoid the Pickerill, Mordred, Galahad and Malory fields, the size of the development reduces to 300 km2 (Figure 14), and assuming the original 1.5 GW capacity is evenly distributed across the development, this would scale down to 0.9 GW. It has been estimated that for every 1 GW of offshore wind capacity, 1.6 MtCO2/year of CO2 emissions are avoided versus the equivalent power generation from natural gas (IEA, 2020). This equates to 1.44 MtCO2/year for our revised, 300 km2 footprint for the ODOWP. We calculated that a CO2 cluster consisting of the Pickerill, Malory, Mordred and Galahad fields (shown schematically in Figure 14) could hold 60 MtCO2, which, on this basis, might be equivalent to c. 40 years of electricity generation from the ODOWP therefore it seems pragmatic that space should be allowed for both decarbonisation projects to proceed to harness the full extent of the seabed and subsurface.
Conclusion
• The depleted Pickerill field is an attractive candidate for CO2 storage as it has produced around 440 Bcf of gas and lies in shallow water relatively close to the east coast of England.
• However, the structure is highly faulted, and WNW-ESE and NW-SE-striking fault sets separate the greater Pickerill structure into several pressure-isolated sub-compartments, of which three (West, Central and East) have sufficient capacity to be meaningful CO2 storage sites.
• Reservoir quality is mostly facies-controlled, with the most porous and permeable intervals attributed to aeolian sediments, though the vertical extent of diagenetic processes (cementation) at the top of the reservoir also reduces reservoir quality and varies over the field.
• Evaporites and carbonates belonging to the Zechstein Group form an effective seal, and while the Zechstein Group thins to less than 100 m over the central portion of the field, it does not weld entirely and has proven effective for gas trapping.
• The three compartments have a combined potential capacity of c. 32 MtCO2 and when combined with potential nearby satellite fields, the area could be developed as a storage cluster capable of sequestering 60 MtCO2. This is equivalent to 2 years’ worth of the UK government’s targeted CO2 sequestration by 2030, but the area’s viability could be curbed by the imminent development of an offshore wind farm.
• It is suggested that the design of the wind farm is amended to enable the CO2 storage opportunity to be realised, something that demands cooperation between the regulatory bodies, the wind farm operator and the gas field/CO2 storage licensee.
Data Availability Statement
Publicly available datasets were analyzed in this study. Seismic and well data is available from the UK National Data Repository. Field production is available from the North Sea Transition Authority's Open Data website. Requests to access the datasets should be directed to https://ndr.nstauthority.co.uk and https://www.nstauthority.co.uk/data-centre/nsta-open-data/.
Author Contributions
The study was conceptualised by JU who provided discussion, contributed to the writing and manuscript/figure review throughout. IdJ-A conducted the analysis, drafted the figures and was the main author.
Funding
We acknowledge funding from the Net Zero Technology Centre (NZTC), which supported IdJ-A’s contribution to the work.
Acknowledgments
The work included in this paper forms part of a wider research project undertaken at Heriot-Watt University (the team for which includes the authors, Dr. Allan D. Hollinsworth and Dr. Rachel J. Jamieson) to critically evaluate CO2 storage sites as part of a road map for the UK Continental Shelf. The interpretations have drawn upon data made available to the public through the NSTA’s National Data Repository (NDR). We are grateful to Schlumberger (Petrel, Techlog), ESRI (ArcPro) and Petrosys (Petrosys PRO) for the donation of software licenses to Heriot-Watt University, all of which have permitted the interpretation, analysis and presentation of seismic and wireline log data. The authors would also like to thank reviewers Davide Gamboa and Christopher Lloyd and associate editor Mark Ireland for their critical review and discussions on the content of the paper.
Conflict of Interest
The authors declare that the research was conducted in the absence of any commercial or financial relationships that could be construed as a potential conflict of interest.
Publisher’s Note
All claims expressed in this article are solely those of the authors and do not necessarily represent those of their affiliated organizations, or those of the publisher, the editors and the reviewers. Any product that may be evaluated in this article, or claim that may be made by its manufacturer, is not guaranteed or endorsed by the publisher.
References
Bachmann, G. H., Geluk, M. C., Warrington, G., Becker-Roman, A., Beutler, G., Hagdorn, H., et al. (2010). “Triassic,” in Petroleum Geological Atlas of the Southern Permian Basin Area. Editors J. C. Doornebal,, and A. G. Stevenson (Houten: EAGE), 149–173.
Bachu, S., Bonijoly, D., Bradshaw, J., Burruss, R., Holloway, S., Christensen, N. P., et al. (2007). CO2 Storage Capacity Estimation: Methodology and Gaps. Int. J. Greenh. Gas Control 1 (4), 430–443. doi:10.1016/S1750-5836(07)00086-2
Bachu, S., and Shaw, J. (2003). Evaluation of the CO2 Sequestration Capacity in Alberta’s Oil and Gas Reservoirs at Depletion and the Effect of Underlying Aquifers. J. Can. Pet. Technol. 42. doi:10.2118/03-09-02
Bentham, M., Pearce, J., Kirk, K., Hovorka, S., van Gessel, S., Pegler, B., et al. (2014). Managing CO2 Storage Resources in a Mature CCS Future. Energy Proc. 12, 5310–5324. doi:10.1016/j.egypro.2014.11.563
Besly, B. M. (1998). “Carboniferous,” in Petroleum Geology of the North Sea (Blackwell Science Ltd.), 104–136. doi:10.1002/9781444313413.ch4
BP (2022). Endurance Storage Development Plan. Available at https://assets.publishing.service.gov.uk/government/uploads/system/uploads/attachment_data/file/1079825/NS051-SS-REP-000-00010-Storage_Development_Plan.pdf (Accessed August 5, 2022).
Brackenridge, R. E., Underhill, J. R., Jamieson, R. J., and Bell, A. (2020). Structural and Stratigraphic Evolution of the Mid North Sea High Region of the UK Continental Shelf. Pet. Geosci. 26, 154–173. doi:10.1144/petgeo2019-076
Bradshaw, J., Bachu, S., Bonijoly, D., Burruss, R., Holloway, S., Christensen, N. P., et al. (2007). CO2 Storage Capacity Estimation: Issues and Development of Standards. Int. J. Greenh. Gas Control 1, 62–68. doi:10.1016/S1750-5836(07)00027-8
Cameron, T. D. J., Crosby, A., Balson, P. S., Jeffrey, D. H., Lott, G. K., Bulat, J., et al. (1992). The Geology of the Southern North Sea. United Kingdom Offshore Regional Report. British Geological Survey. London: HMSO.
Corfield, S. M., Gawthorpe, R. L., Gage, M., Fraser, A. J., and Besly, B. M. (1996). Inversion Tectonics of the Variscan Foreland of the British Isles. J. Geol. Soc. 153 (1), 17–32. doi:10.1144/gsjgs.153.1.0017
Coward, M. P. (1993). The Effect of Late Caledonian and Variscan Continental Escape Tectonics on Basement Structure, Paleozoic Basin Kinematics and Subsequent Mesozoic Basin Development in NW Europe. Pet. Geol. Conf. Ser. 4, 1095–1108. doi:10.1144/0041095
de Jonge-Anderson, I., Hollinsworth, A. D., Underhill, J. R., and Jamieson, R. J. (2022). A Geological Assessment of the Carbon Storage Potential of Structural Closures in the East Midlands Shelf, United Kingdom Southern North Sea. AAPG Bull. 106 (9), 1827–1853. doi:10.1306/03232221118
Doornebal, J. C., and Stevenson, A. G. (2010). Petroleum Geological Atlas of the Southern Permian Basin Area. Houten: EAGE.
Evans, D. J., Graham, C., Armour, A., and Bathust, P. (2003). The Millenium Atlas: Petroleum Geology of the Central and Northern North Sea. London: Geological Society.
Garland, C. R. (1991). The Amethyst Field, Blocks 47/8a, 47/9a, 47/13a, 47/14a, 47,15a, UK North Sea. Geol. Soc. Lond. Mem. 14, 387–393. doi:10.1144/GSL.MEM.1991.014.01.48
Gast, R. E., Dusar, M., Breitkreuz, C., Gaupp, R., Schneider, J. W., Stemmerik, L., et al. (2010). “Rotliegend,” in Geological Atlas of the Southern Permian Basin Area. Editors J. C. Doornenbal,, and A. G. Stevenson (Houten: EAGE Publications), 101–121.
George, G. T., and Berry, J. K. (1993). A New Lithostratigraphy and Depositional Model for the Upper Rotliegend of the UK Sector of the Southern North Sea. Geol. Soc. Lond. Spec. Publ. 73, 291–319. doi:10.1144/GSL.SP.1993.073.01.18
Glennie, K., and Underhill, J. R. (1998). “Origin, Development and Evolution of Structural Styles,” in Petroleum Geology of the North Sea. Editor K. Glennie (London: Blackwell Science Ltd), 42–84. doi:10.1002/9781444313413.ch2
Glennie, K. W. (1997). Recent Advances in Understanding the Southern North Sea Basin: a Summary. Geol. Soc. Lond. Spec. Publ. 123, 17–29. doi:10.1144/GSL.SP.1997.123.01.03
Grant, R. J., Underhill, J. R., Hernández-Casado, J., Barker, S. M., and Jamieson, R. J. (2019). Upper Permian Zechstein Supergroup Carbonate-Evaporite Platform Palaeomorphology in the UK Southern North Sea. Mar. Pet. Geol. 100, 484–518. doi:10.1016/j.marpetgeo.2017.11.029
Green Investment Group (2021). GIG and Total Successful in Securing Seabed Lease Rights to Jointly Develop 1.5 GW Offshore Wind Project. Available at: https://www.greeninvestmentgroup.com/en/news/2021/gig-and-total-successful-in-securing-seabed-lease-rights-to-jointly-develop-1-point-5-gw-offshore-wind-project.html (Accessed April 11, 2022).
HM Government (2021). Net Zero Strategy: Build Back Greener. Available at https://www.gov.uk/government/publications/net-zero-strategy (Accessed August 8, 2022).
Hollinsworth, A. D., de Jonge-Anderson, I., Underhill, J. R., and Jamieson, R. J. (2022). Geological Evaluation of Suprasalt Carbon Storage Opportunities in the Silverpit Basin, United Kingdom Southern North Sea. AAPG Bull. 106 (9), 1791–1825. doi:10.1306/03232221119
Holloway, S., Vincent, C. J., Bentham, M. S., and Kirk, K. L. (2006). Top-Down and Bottom-Up Estimates of CO2 Storage Capacity in the United Kingdom Sector of the Southern North Sea Basin. Environ. Geosci. 13, 71–84. doi:10.1306/eg.11080505015
IEA (2020). Annual Direct CO2 Emissions Avoided Per 1 GW of Installed Capacity by Technology and Displaced Fuel. Paris: IEA. Available at: https://www.iea.org/data-and-statistics/charts/annual-direct-co2-emissions-avoided-per-1-gw-of-installed-capacity-by-technology-and-displaced-fuel (Accessed April 11, 2022).
Kopp, A., Class, H., and Helmig, R. (2009). Investigations on CO2 Storage Capacity in Saline Aquifers-Part 2: Estimation of Storage Capacity Coefficients. Int. J. Greenh. Gas Control 33, 277–287. doi:10.1016/j.ijggc.2008.10.001
Leeder, M. R., and Hardman, M. (1990). Carboniferous Geology of the Southern North Sea Basin and Controls on Hydrocarbon Prospectivity. Geol. Soc. Lond. Spec. Publ. 55, 87–105. doi:10.1144/GSL.SP.1990.055.01.04
Leeder, M. R. (1988). Recent Developments in Carboniferous Geology: A Critical Review with Implications for the British Isles and N.W. Europe. Proc. Geol. Assoc. 99, 73–100. doi:10.1016/S0016-7878(88)80001-4
Lemmon, E. W., McLinden, M. O., and Friend, D. G. (2021). “Thermophysical Properties of Fluid Systems,” in NIST Chemistry WebBook, NIST Standard Reference Database Number 69. Editors P. J. Linstrom,, and W. G. Mallard (Gaithersburg, MD: National Institute of Standards and Technology), 20899.
NSTA (2021). The Future of the UK Continental Shelf. Available at: https://www.nstauthority.co.uk/media/7828/reuters-presentation-october-2021.pdf (Accessed April 11, 2022).
NSTA (2022a). UK National Data Repository. Available at: https://ndr.nstauthority.co.uk/ (Accessed April 11, 2022).
NSTA (2022b). UKCS Production. Available at: https://www.nstauthority.co.uk/data-centre/nsta-open-data/production/ (Accessed April 11, 2022).
Oakman, C. D., and Partington, M. A. (1998). “Cretaceous,” in Petroleum Geology of the North Sea: Basic Concepts and Recent Advances. Editor K. W. Glennie. 4th ed. (Oxford, UK: Blackwell Science), 294–349. doi:10.1002/9781444313413.ch9
Offer, D. J. (2020). The Juliet Field, Block 47/14b, UK North Sea. Geol. Soc. Lond. Mem. 52, 217–225. doi:10.1144/M52-2017-14
Ørsted (2022). Hornsea Project Four: Position Statement between Hornsea Project Four and BP. Available at: https://infrastructure.planninginspectorate.gov.uk/wp-content/ipc/uploads/projects/EN010098/EN010098-001067-Hornsea%20Project%20Four%20-%20Position%20Statement%20with%20BP.pdf (Accessed April 11, 2022).
Oudmayer, B. C., and Jager, J. de. (1993). Fault Reactivation and Oblique-Slip in the Southern North Sea, 4. London: Geological Society, 1281–1290. Petroleum Geology Conference series. doi:10.1144/0041281
Robertson, S., and McAreavey, J. (2021). CCUS & Offshore Wind Overlap Study Report. Available at: https://www.thecrownestate.co.uk/media/3898/ccus-offshore-wind-overlap-study-report.pdf (Accessed June 24, 2022).
Smith, B., and Starcher, V. (2003). The Mercury and Neptune Fields, Blocks 47/9b, 47/4b, 47/5a, 42/29, UK North Sea. Geol. Soc. Lond. Mem. 20, 777–787. doi:10.1144/GSL.MEM.2003.020.01.65
Span, R., and Wagner, W. (1996). A New Equation of State for Carbon Dioxide Covering the Fluid Region from the Triple Point Temperature to 1100 K at Pressures up to 800 MPa. J. Phys. Chem. Reference Data 25, 1509–1596. doi:10.1063/1.555991
Stuart, I. A. (1991). The Rough Gas Storage Field, Blocks 47/3d, 47/8b, UK North Sea. Geol. Soc. Lond. Mem. 14, 487–484. doi:10.1144/GSL.MEM.1991.014.01.59
The Crown Estate (2021). Offshore Wind Leasing Round 4 Signals Major Vote of Confidence in the UK’s Green Economy. Available at: https://www.thecrownestate.co.uk/en-gb/media-and-insights/news/2021-offshore-wind-leasing-round-4-signals-major-vote-of-confidence-in-the-uk-s-green-economy/ (Accessed April 11, 2022).
Underhill, J. R. (2003). “The Tectonic and Stratigraphic Framework of the United Kingdom’s Oil and Gas Fields,” in United Kingdom Oil and Gas Fields: Commemorative Millennium Volume 20. Editors J. Gluyas,, and H. M. Hichens (Bath: The Geological Society), 17–59. doi:10.1144/GSL.MEM.2003.020.01.04
Werngren, O. C., Manley, D., and Heward, P. (2003). “The Pickerill Field, Blocks 48/11a, 48/11b, 48/12b, 48/17b, UK North Sea,” in United Kingdom Oil and Gas Fields: Commemorative Millennium Volume 20. Editors J. Gluyas,, and H. M. Hichens (Bath: The Geological Society), 799–809. doi:10.1144/GSL.MEM.2003.020.01.67
Keywords: offshore wind energy, Rotliegend Group, Southern North Sea, depleted gas field, Southern Permian Basin, Anglo Polish Trough, Outer Dowsing Wind Farm, Pickerill
Citation: de Jonge-Anderson I and Underhill JR (2022) Use of Subsurface Geology in Assessing the Optimal Co-Location of CO2 Storage and Wind Energy Sites. Earth Sci. Syst. Soc. 2:10055. doi: 10.3389/esss.2022.10055
Received: 13 April 2022; Accepted: 18 July 2022;
Published: 25 August 2022.
Edited by:
Mark Thomas Ireland, Newcastle University, United KingdomReviewed by:
Davide Gamboa, Portuguese Institute for Sea and Atmosphere (IPMA), PortugalChristopher Lloyd, The University of Manchester, United Kingdom
Copyright © 2022 de Jonge-Anderson and Underhill. This is an open-access article distributed under the terms of the Creative Commons Attribution License (CC BY). The use, distribution or reproduction in other forums is permitted, provided the original author(s) and the copyright owner(s) are credited and that the original publication in this journal is cited, in accordance with accepted academic practice. No use, distribution or reproduction is permitted which does not comply with these terms.
*Correspondence: I. de Jonge-Anderson, i.anderson@hw.ac.uk, orcid.org/0000-0002-9438-8194