 Karl Ljung
 Simon Lin
- 1Department of Geology, Lund University, Lund, Sweden
- 2Centre for Environmental and Climate Science, Lund University, Lund, Sweden
Small ponds constructed for nutrient retention, biodiversity conservation or recreation also store large amounts of carbon. The potential role of small ponds for carbon storage and greenhouse gas emissions have been highlighted both in the scientific literature and in management plans. The role of small ponds in the global carbon budget is likely significant, but the potential has not been fully explored. Here we present measurements of yearly sedimentary carbon accumulation and carbon stocks in six small, constructed and restored ponds in southern Sweden. The ponds were constructed or restored during the last 20 years primarily for nutrient retention. The sediment cores span the time from the construction of the ponds until today. The ponds had high carbon accumulation, with mean total carbon stocks in the top 6 cm of sediment of 836 g C m−2 and a yearly mean C accumulation rate of 152 g C m−2 yr−1. The total amount of restored wetlands within the restoration program studied here has a total area of 480 ha, and upscaling the carbon stocks to the whole area of restored ponds and wetlands gave a total carbon stock of 4.013 × 10⁶ kg C in the top 6 cm of the sediments. If considering the potential increase of CO2 and CH4 from the ponds it is likely that the constructed ponds studied here are net carbon sources. We compared our results with published measurements of CO2 and CH4 emissions from small ponds in Sweden. This shows that the CO2 equivalent emissions could be between 1.8 and 37.5 times higher than the sedimentary carbon accumulation. Our data indicate that small constructed ponds are potential net carbon sources. Therefore, we suggest that using small, constructed, or restored ponds as carbon mitigation strategy must be done with caution, and the potential for increased methane emissions must be considered.
Introduction
Lakes and ponds are abundant on Earth and the organic matter stored in these environments make up a significant part of the global carbon budget (Downing et al., 2006). The construction of small ponds and impoundments have been used to limit nutrient leaking (Fleischer et al., 1994; Jansson, Leonardson, and Fejes 1994; Carstensen et al., 2020), increase biodiversity (Fleming-Singer and Horne 2006; Davies et al., 2008) and provide recreational and cultural values (Moore and Hunt, 2012). Ponds also store carbon in bottom sediments and are effective in removing carbon from the water and the atmosphere through deposition of autochthonous and allochthonous organic matter and it has been suggested that they can function as carbon sinks on decadal to centennial scales (Euliss et al., 2006; Taylor et al., 2019; Gilbert et al., 2021). Organic material reaches the ponds primarily through surface run off and streams and by primary productivity in the pond. It has been shown that carbon storage in lakes has increased significantly during the last 100 years and today these environments store up to 0.12 Pg C yr−1 globally (Anderson et al., 2020). In artificial lakes and reservoirs the carbon storage can be as high (Downing et al., 2008). The high carbon storage in small ponds has prompted the interest of using artificial and restored ponds as carbon mitigation measure (Battin et al., 2009; Malak et al., 2021).
In Sweden, drainage of both forests and agricultural land has been extensive since at least the middle ages (Krug, 1993; Jacks, 2019). This led to a substantial loss of small ponds and wetlands in most of Sweden, with severe consequences for biodiversity and nutrient transportation. During the last decades efforts to restore previously drained ponds and wetlands, as well as constructing new ponds have been intensified (Graversgaard et al., 2021). In Sweden a total of between 12,000–15,000 ha of ponds and wetlands have been restored since the 1980s (Graversgaard et al., 2021). The restoration efforts have been focused both on ponds in agricultural landscapes and in mire rewetting programs. The purpose has mostly been driven by the need to restore the nutrient retention capacity of the landscape and limit eutrophication in lakes and the Baltic Sea, and to restore biodiversity in the landscape.
Here we present a study of carbon burial in small (<10 ha) artificial or restored ponds in southern Sweden (Lund municipality) within the Kävlingeån river and Höje å river catchments (Figure 1). In these two river catchments 159 wetlands and ponds with a total area of 480 ha have been constructed or restored since the 1990s (Ekologgruppen, 2013; Ekologgruppen, 2015). All ponds usied in the study have known construction date that allowed us to calculate the carbon accumulation rates and estimate the total carbon storage. We have upscaled our results to the total potential carbon storage within the river catchment and relate this to the potential greenhouse gas emissions from the ponds. Our aim is to give reliable estimates of the potential for carbon storage in artificial ponds and evaluate the effect of this as a climate mitigation effort.

FIGURE 1. Map Showing the location of the study sites (A,B). The Kävlingeån and Höje å river catchments are highlighted on the map (B). The red rectangle (B) shows the location of the detailed map of the study area (C). The aerial photographs show the ponds with coring spots are indicated by “x” and “o”. The maps are derived from VattenAtlas.se and satellite images from Google maps, Maxar Technologies.
Materials and Methods
Site Selection and Sampling
Five constructed and one restored pond were sampled for the study. All ponds are situated within Lund municipality in Höje å river and Kävlingeån river catchments (Figure 1). Since the early 1990s the wetland restoration programs “Kävlingeån river program” and “Höje å river program” have been creating and restoring ponds and wetlands within the river catchments, with the aims to promote biodiversity, trap nutrients, restore the natural hydrology and create recreational spaces (Lindahl and Söderqvist, 2004; Ekologgruppen, 2013). Currently, the Kävlingeån river and Höje å river catchments have approximately 370 and 110 ha of restored wetlands respectively. The six studied wetlands range in size from 0.2 to 60 ha (Ekologgruppen, 2013; Ekologgruppen, 2015). The ponds were created or restored by digging new ponds or by deepening of the inlet or damming of the outlet.
The studied ponds are situated within agricultural land and are either bordered by pastures or arable land. The ponds range in size from 1.1 to 60 ha and have catchments ranging from 84 to 23,900 ha (Table 1). All ponds are situated in open land that is either used as arable land (H78, K30A1, K86), or pastures (H49, H47, K340). The littoral vegetation is generally limited, and the shorelines were mostly open with no overhanging or shadowing vegetation. Ponds H49, K30A1 and K86 had denser and higher shore vegetation dominated by Phragmites sp. and Typha latifolia, with scattered Salix sp. and Alnus sp. The ponds had no floating vegetation at the time of sampling. The water depths of the ponds were between 65 and 170 cm at the time of sampling. The highest water levels in the ponds are during winter and spring and the water depths represent maximum, or near maximum, levels. The ponds have open water throughout the year during normal conditions but might dry out during extreme drought. Pond K340 was restored by rerouting drainage and flooding rather than by excavating the pond, and it is situated in an area that is prone to flooding during winter resulting in that it is sometimes connected to a larger flooded area.
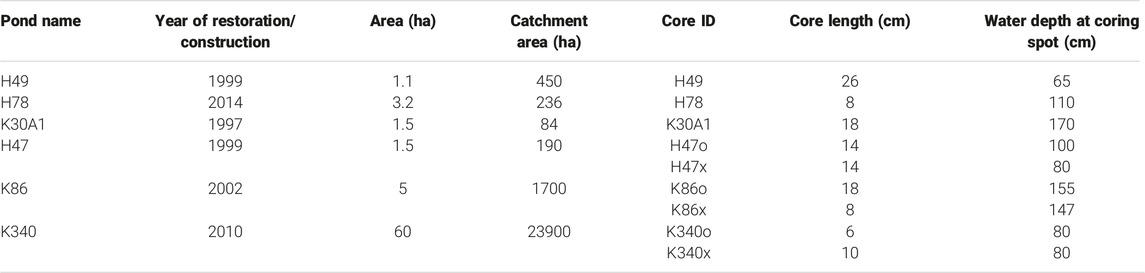
TABLE 1. Characteristics of the sampled ponds and cores. Pond K340 was restored, all other ponds were constructed. Pond names and areas were derived from Ekologgruppen (https://www.ekologigruppen.se), who were responsible for the restoration and construction of the ponds, and the database Vattenatlas.se.
Sediment sampling of the ponds was done in February–March 2020. Sediment cores were retrieved from the deepest part of the ponds, usually in the central part. In ponds H47 and K86 duplicate cores were taken from separate sub-basins. Pond K340 has a very uniform bottom topography, and the two cores are from the central part, it was however not possible to penetrate with the Russian corer and retrieve any underlying minerogenic sediments in Pond K340. From ponds H49, H78 and K30A1 single cores were retrieved from the deepest parts.
Sampling was done from a rubber dinghy using a gravity corer with a 50 cm coring tube (inner dimension 58 cm2) (Renberg and Hansson, 2008). The water depth was surveyed by soundings using a weighted line, and the deepest basin was chosen for sampling. We used a Russian sediment corer to establish the sediment depths of the sampled basins and to make sure that our gravity core samples reached the start of organic sediment accumulation. The lower basal minerogenic layers were not sampled, and we assume that the start of organic carbon accumulation coincides with the construction of the ponds. The gravity cores were subsampled in the field in 2-cm sections. The sediment volume was calculated using the inner diameter of the sampling cylinder and sample height (2 cm). All subsamples were weighed immediately after returning to the laboratory and kept frozen until freeze dried and homogenized. Water content and dry bulk density was calculated by weighing the wet and freeze-dried sediments and using the sample volume.
Carbon and Nitrogen Measurements
Carbon and nitrogen content was measured with an elemental analyser (COSTECH ECS4010). Freeze dried and homogenized samples were weighed in Ag capsules. Inorganic carbon was removed by treatment with 2 M hydrochloric acid in the capsules following the procedure in (Brodie et al., 2011). After HCl treatment, the samples were dried on a hot plate and the capsules were closed and wrapped in tin capsules. The instrument was calibrated with acetanilide and the performance of the measurements checked with proceeding blanks and soil reference material. The precision of the instrument was better than 1% on reported values based on replicated reference samples.
Calculation of Carbon Stocks, Carbon Storage and Carbon Accumulation Rates
The results are reported as percentage carbon and nitrogen of the dried sediment and calculated carbon density (mg C cm−3). Carbon density was calculated using Eq. 1:
Where C represents carbon and DBD dry bulk density.
Carbon stocks (g C m−2) were calculated for the entire cores and for the upper 6 cm to allow comparison between cores. We used the upper 6 cm rather than 10 cm that is often used, because this is the depth of our shortest core (Gilbert et al., 2021).
For the estimation of total carbon storage in the studied ponds uniform sediment depths across the ponds were assumed. In ponds with two cores, the sediment depths and carbon stocks were averaged for the calculation. Assuming uniform sediment depths in each pond is a simplification with the implication that our calculations gives an upper maximum value of the carbon storage since we have sampled the ponds’ central parts with highest sediment depths. Carbon storage was upscaled for the total area of restored ponds in the Kävlinge river catchment and Höje river catchment by multiplying the carbon stocks with the area of the restored ponds available in the database at Vattenatlas.se (VattenAtlas, 2022). Yearly average carbon accumulation rates were calculated using sediment depth and time since construction. Error bars for average carbon stocks were calculated as standard deviations based on the variability of the full cores or upper 6 cm. Error bars for total carbon storage were calculated as the standard deviation for each core.
Relationships between carbon stocks, and pond characteristics (pond area, catchment area and age), were explored using linear regressions, and significance of correlations were tested using Pearson correlation coefficients.
Results
The depths of the recovered sediment sequences ranges from 6 to 25 cm (Figure 2). The sediments of the cores consisted of gyttja with variable minerogenic content. The amount of visible coarse organic matter was generally low in the cores. The DBD ranged from 0.09 to 0.75 g cm−3 (Figure 2). The lowest DBD were consistently found in the topmost samples of the cores, and the trend in all cores except H78 decreased towards the top. In H78 the highest DBD was found in the second sample from the bottom.
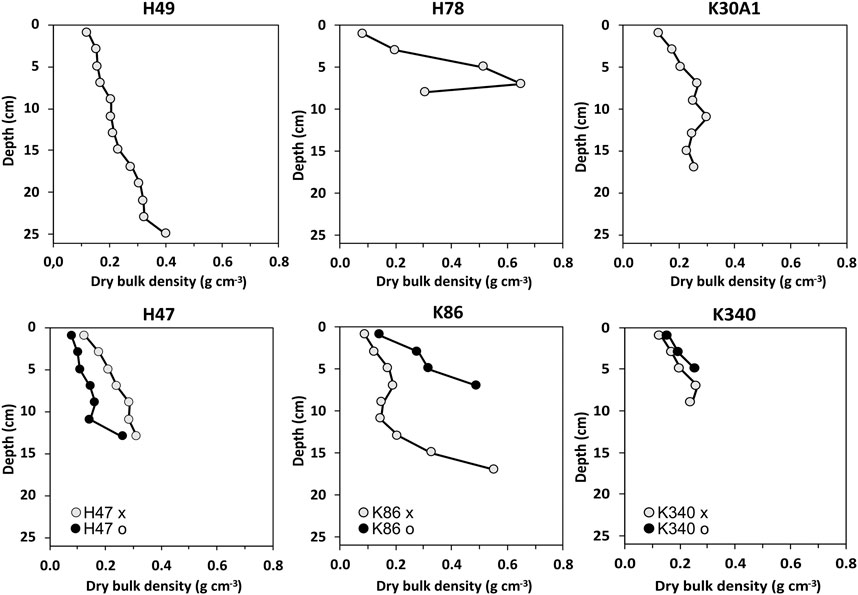
FIGURE 2. Dry bulk density of the studied cores. Depth denotes depth below the sediment surface.
The carbon concentrations ranged from 1.1% to 33.4% in the studied cores (Figure 3). The highest carbon concentrations were observed in the cores from Pond K340, with carbon concentrations between 19.0% and 33.4%. In cores H49, K30A01, H47o, K86x and K86o the carbon concentration generally increased towards the top, with highest values in the top 0–4 cm. Carbon concentrations in cores H47x, H78, K340o and K340x were notably different with maximum carbon concentrations observed in the lower sections of the cores (Figure 3).

FIGURE 3. Down core carbon concentration and C/N ratios from the studied ponds. Depth denotes the depth below the sediment surface. Note the different scale for carbon concentration for pond K340.
The down-core patterns in duplicated cores from the same ponds were similar, but the average concentrations were different (Figure 3). The average carbon concentration of duplicate cores in K86 and H47differed by a factor of 2.4, and in cores from K340 by a factor of 1.3.
The C/N ratios ranged between 9.6 and 23 in all cores. The highest C/N ratios were generally found in the lower half of the cores, with a generally decreasing trends upwards (Figure 3). The lowest C/N ratios were found in the topmost 4 cm in all cores (Figure 3). In pond H47 the C/N of the two cores were similar in the topmost and bottom most samples, but the average C/N of H47x was higher with maximum values of 13.2 compared to 11.6 in H47o. The short core K86o had an average C/N of 14.4 compared to 13.0 for the K86x. The C/N of the topmost samples in the two cores from K340 were similar at 15.0 and 15.2, but the downcore pattern differed with K340o having a range of 15.2–19.1 and K340x a range of 15.0–15.8.
Carbon Density
Carbon densities ranged between 2.7 and 65 mg C cm−3 (Figure 4). Generally, the down-core variability in carbon density was smaller than the variability in carbon concentration. Particularly the higher carbon concentrations towards the top observed in the cores from H47, H49 and K86 were smoothed out in the carbon density, likely because of the increasing compaction of the sediments with increasing depth. The carbon densities in the cores from H78 and K340 showed larger variability and highest values in the lower sections. The cores from pond K340 had the highest observed carbon densities ranging between 25 and 65 mg C cm−3.
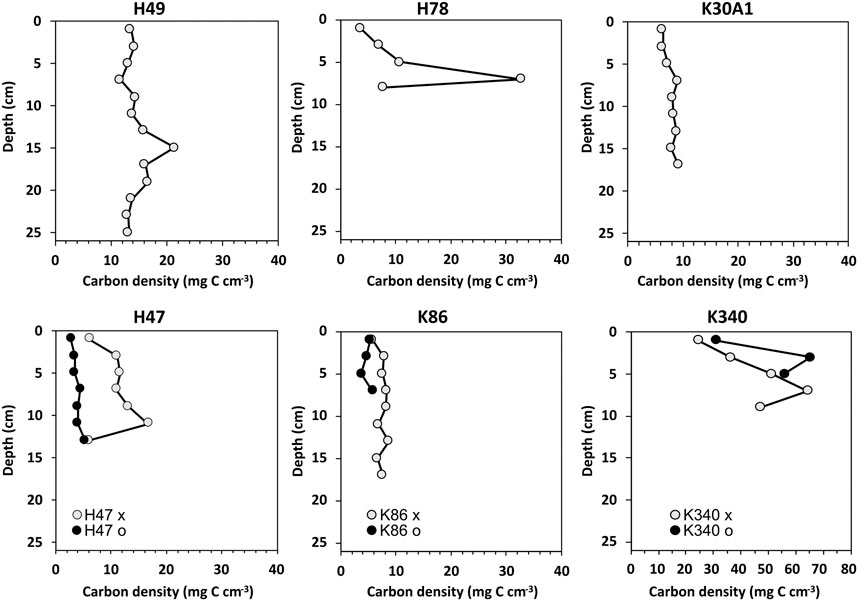
FIGURE 4. Carbon densities from the studied cores. Note the different scale for the cores from pond K340.
Carbon Stocks and Total Carbon Storage
Carbon stocks were calculated for full cores and the top 6 cm (Figure 5). Highest average carbon stocks for the total sediment depths were found in cores from ponds H49 and K340, with stocks of 3,829 ± 639 and 4,469 ± 1,509 g C m−2 respectively. The high total carbon stocks in H49 are explained by the deeper sediments of this core, and the high stocks in cores from K340 by the high carbon concentration of the sediments. The core from pond H78 had the lowest average total-sediment-depth carbon stocks of 1,079 ± 1,052 g C m−2.
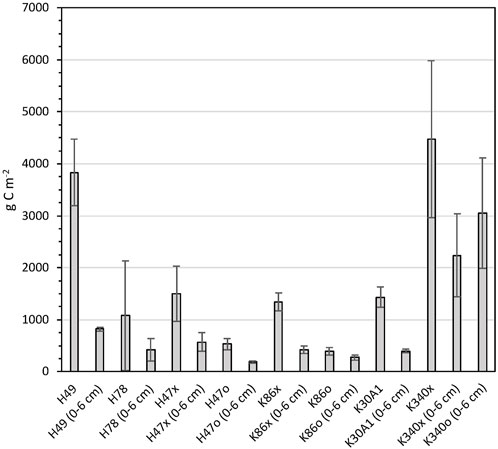
FIGURE 5. Carbon stocks calculated for the full sediment sequences and top 6 cm of the studied ponds. Error bars show standard deviations calculated for each core.
Highest carbon stocks in the upper 6 cm were found in pond K340 with 2,239 ± 795 and 3,048 ± 1,064 g C m−2 in the two respective cores and lowest stocks in the cores from H47 and K86 with 188 ± 22 to 571 ± 182 g C m−2 (Figure 5). The relative difference in carbon stocks between cores were smaller in the upper 6 cm compared to the full cores.
The sedimentary carbon storage in each pond was calculated for the upper 6 cm and the full cores by multiplying carbon stocks and area for each pond. In ponds with two cores, the average carbon stock of the two cores was used for the upscaling. The total cumulative carbon storage of all studied ponds was 1,638 ± 587 ton C in the upper 6 cm and 2,412 ± 828 ton C for the total sediment depth in the studied ponds (Table 2). The carbon storage for the total sediment depth must be considered a rough estimate since it is assuming uniform sediment depths the ponds.
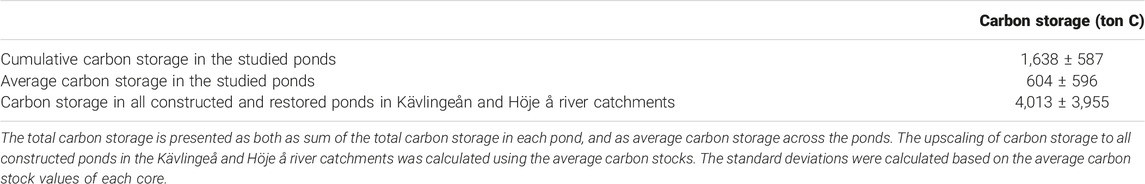
TABLE 2. Total carbon storage (0–6 cm) of the studied ponds and upscaled carbon storage in the Kävlingeå and Höje å river catchments.
The carbon storage in the upper 6 cm was upscaled to the total area of restored ponds in the Kävlingeån river catchment and Höje å river catchment by multiplying the average carbon stocks in the upper 6 cm of the studied ponds, 836 ± 824 g C m−2 yr−1, with the total area, 480 ha, of restored ponds within the two catchments (Ekologgruppen, 2013; Ekologgruppen, 2015;). This gives an estimated total carbon storage in the upper 6 cm of restored ponds in the Kävlingeån and Höje å river catchments of 4,013 ± 3,955 ton C.
Carbon Accumulation Rates
Yearly carbon accumulation rates ranged from 22 ± 4 to 447 ± 151 g C m−2 yr−1 (Figure 6). The highest carbon accumulation rates were found in K340x, and the lowest in H47o and K86o. The carbon accumulation rates differed both between cores within the same pond and between ponds with the largest absolute difference in carbon accumulation rates was found between K340x-o and the other ponds.

FIGURE 6. Carbon accumulation rates for the studied ponds. The total carbon accumulation and years since construction or restoration were used for calculating accumulation rates. The error bars show standard deviations derived from the carbon stock calculations from each core.
Statistical Relationships
Statistically significant correlations were found between carbon stocks in the upper 6 cm and pond area and catchment area (Table 3; Figure 7). The correlations between carbon stocks in the upper 6 cm and water depth and pond age were negative, but not statistically significant (Table 3). The correlations between the pond characteristics (area, catchment area, water depth and age) with total carbon stocks and carbon accumulation rates yielded very similar results with similar statistical correlations (data not shown).

TABLE 3. Pearson product moment correlation coefficients of carbon stocks in the upper 6 cm of the sediment cores and pond characteristics (pond area, water depth, catchment area and age).
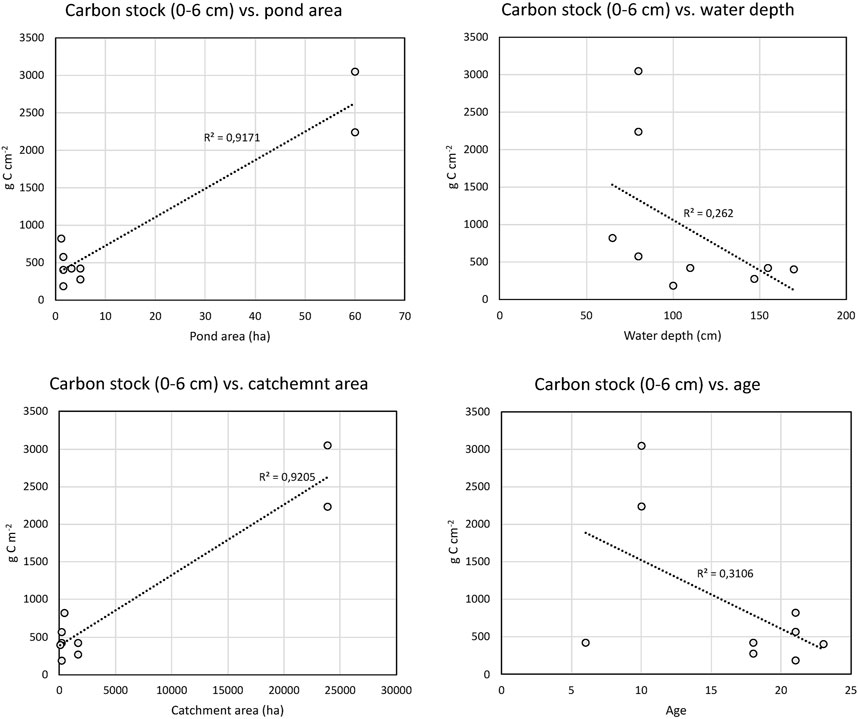
FIGURE 7. Linear regression of carbon stocks in the top 6 cm and pond characteristics. The R2 of the linear regressions are shown in the figures.
Discussion
Evolution of Carbon Accumulation
The carbon concentrations in four of the six ponds generally increased over time (H49, K30A1, H47, K86), while the remaining two ponds (H78 and K340) had lower carbon concentrations in the topmost samples than further down (Figure 3). The C/N ratios of 10–23 are lower than most terrestrial organic matter (C/N > 20) but higher than reported values for phytoplankton (C/N < 10) (Meyers and Ishiwatari, 1993; Meyers, 1997). High deposition of particulate organic matter with terrestrial source is a common feature for small ponds (Cole et al., 2007), and can explain the high C/N in H49. For all ponds except K340 the carbon concentrations and C/N ratios are typical for lacustrine sediments, with a mixture of autochthonous and allochthonous organic matter deposition (Meyers, 1997).
The cores from K340 have high carbon concentrations (>20%) and high C/N (14–19) that are within the range of soil organic matter and peat (Meyers and Ishiwatari, 1993). The pond was restored by flooding of a larger area with peat soils in 2010. It is subjected to seasonal flooding that increases its size substantially, but during normal seasonal variability the coring site remains a pond, even if it cannot be completely ruled out that it can dry out completely during very dry periods. It was only possible to retrieve very short cores (6 and 10 cm) and both cores had high carbon concentrations in a layer in the mid to lower part of the cores and high C/N (Figure 3). Therefore, it is possible that these sediment sequences also contain underlying peat soils, and not only represents the post restoration sediments. These factors could contribute to the high carbon stocks in K340.
Short-lived erosion events can lead increased deposition of minerogenic and terrestrial organic matter causing lower carbon concentrations and higher C/N in lake sediments (e.g., Yang et al., 2021). It is possible that the peaks and variability observed in the cores from H49 and H78 can be explained by fluctuating erosion rates bringing in minerogenic and terrestrial organic matter (Figure 3).
The differences in sediment depth, carbon concentration and C/N between cores from the same pond and between ponds are likely explained by local variability in sediment focusing, current exposure and water depth. Sediment focusing can move sediment from shallower to deeper parts of lakes and this has been shown to cause differences in carbon accumulation rates within ponds (Hilton and Gibbs, 1984; Mackay et al., 2012). This is likely one important factor explaining the observed in-pond variability.
The downcore carbon densities showed generally lower variability than the downcore carbon concentrations, and the difference in carbon density between the topmost and lower most samples were also generally smaller (Figures 3, 4). With ponds H78 and K340 being notable exceptions where larger variability and high carbon densities were observed in the lowermost part of the cores. The lower variability is explained by the calculation of carbon densities that compensates for differences in concentration caused by sediment compaction and variable minerogenic content.
The onset of organic matter deposition after restoration was rapid, as indicated by the sharp boundaries between the organic sediments and underlying minerogenic sediments, and there is no indication of prolonged periods of unstable soils delivering minerogenic matter to the ponds. It is therefore unlikely that the upwardly increasing carbon concentrations were caused by declining minerogenic deposition due to unstable sediments in the ponds, or unstable soils around the ponds. It is also considered unlikely that land-use has changed significantly and consistently enough to explain the consistent pattern of upwardly increasing carbon concentration and decreasing C/N.
Rather than changes in delivery of minerogenic matter or productivity of the ponds, but it is likely that post depositional degradation is responsible for the downward decreasing carbon concentrations. Post-depositional degradation of lake sediments has been shown to cause C and N losses of 23% for and 35% respectively in first 27 years after sedimentation (Gälman et al., 2008). The different degradation rates of C and N cause the C/N to increase with age. All studied cores except H47x, K340x and K340o had increasing carbon concentrations toward the top, and all cores had decreasing C/N ratios toward the top. These patterns fits well with the post-depositional degradation pattern described by Gälman et al. (2008). Taken together with the lack of evidence for changes in erosion rates or land-use, it can therefore be concluded that the general down-core patterns of decreasing carbon concentration and rising C/N is largely determined by degradation, with exception of the short-lived peaks.
The ages of the cores range between 6 years for the youngest (H78) and 23 years for the oldest (K30A1) and the sediments can therefore be assumed to not have reached stable carbon content in the lower part (Gälman et al., 2008). This implies ongoing degradation of a large portion of the carbon stocks in the ponds, and in a future climate with higher temperatures there is an increased risk of higher degradation rates (Gudasz et al., 2015). The ongoing degradation also means that the carbon stocks in the sediment sequences might not be sustained over time, and that the common practice of calculating carbon stocks for the upper parts of sediment sequences might overestimate the future carbon storage potential in ponds.
Carbon Stocks and Storage
The observed carbon densities of 3–65 mg C cm−3 carbon stocks of 189–3,048 g C m−2 for the upper 6 cm of the sediment are within the range of previous studies (Kortelainen et al., 2004; Taylor et al., 2019; Gilbert et al., 2021). Carbon densities can differ greatly between sites even in fairly small regional settings (Gilbert et al., 2021), which is also observed here.
Significant correlations were only found between pond and catchment size, carbon stocks (Table 3; Figure 7). The strong correlations are driven by the large size and high carbon stocks of K340, and if these values are excluded no significant correlations were observed. The relationship between water depth and carbon stocks, although not statistically significant, indicate that shallow ponds have higher carbon content. If excluding K340, the correlation between size and carbon stocks is also weakly negative, although not statistically significant. This could indicate that the smaller ponds tend to have higher carbon stocks, which is in agreement with previous studies indicating that smaller lakes and ponds have higher carbon burial rates (Downing et al., 2008; Downing, 2010). Only a weak, statistically non-significant correlation between carbon stocks and time could be found (Table 3; Figure 7). If using the total carbon stock no relationship was observed (linear regression R2 of 0.08). The lack of correlation with the total carbon stock and time is somewhat surprising, since it could be expected that older ponds have had longer time to build up higher stocks, and this has also been shown in earlier studies of small constructed ponds (Goeckner et al., 2022). The lack of correlation with pond age might indicate that other pond characteristics in these settings and time scales are more important for carbon stocks. However, the low sample size used here can also explain the lack of correlations.
Potential for Increased Greenhouse Gas Emissions From Ponds
Microbial degradation of organic matter in ponds and wetlands produces CH4 and CO2 that is emitted to the atmosphere (Rudd and Hamilton 1978; Tranvik et al., 2009; Holgerson and Raymond, 2016; Peacock et al., 2021). The total CH4 global emissions from lakes and ponds is estimated to correspond to as much as 25% of the terrestrial carbon sink (Bastviken et al., 2011), and it is shown that CH4 emissions from constructed ponds are significant (Peacock et al., 2021). Thus, for constructed ponds to be net carbon sinks, the carbon storage must be higher than the additional CO2 and CH4 emissions from organic matter degradation in the ponds.
Methane emissions were not measured in the studied ponds, and therefore we compare our carbon storage with published values of CH4 and CO2 emissions from similar ponds in Sweden. The closest measurements of CH4 emissions from ponds with similar characteristics are from Stadmark and Leonardsson (2005), who measured diffuse CH4 emission in three constructed ponds situated within 50 km from our study sites. The CH4 emissions in these ponds during summer months were on average 10 mg CH4 m−2 h−1 (Stadmark and Leonardson, 2005). Assuming 24 h and 100 days of active methane production this gives a yearly emission of 24 g CH4 m−2 yr−1. This is within the range of diffusive emissions of 0.1–44.3 g CH4 m−2 yr−1 reported for constructed ponds around Uppsala in Sweden (Peacock et al., 2021). However, in the dataset from Uppsala only two out of nine studied ponds had CH4 emissions above 10 g CH4 m−2 yr−1. In addition to the diffusive CH4 emissions, ebullition is a major source of CH4 emissions from ponds and it is often the single most important source of CH4 in small ponds (Natchimuthu et al., 2014; van Bergen et al., 2019). In Swedish ponds ebullition rates of 257 mg CH4 m−2 day−1 have been reported (Peacock et al., 2021), and ebullition rates of 270–470 mg CH4 m−2 day−1 have been reported from temperate artificial ponds (Herrero Ortega et al., 2019; van Bergen et al., 2019). Based on the estimated diffusive emissions from Stadmark and Leonardson (2005) and an ebullition emission corresponding to 75% of the total emissions, it can be assumed that the total emissions from the ponds could be in the order of 100 g CH4 m−2 yr−1.
In addition to the CH4 emissions, ponds also emit CO2. In Swedish ponds and ditches the rate of CO2 emission rates ranges from −36–1,138 g CO2 m−2 yr−1 (Peacock et al., 2021). These rates are similar to emissions rates reported from other temperate regions (van Bergen et al., 2019). Here we use the average CO2 emission rate of 465 g CO2 m−2 yr−1 measured in the ponds reported in Peacock et al. (2021) as typical emission rates that are also representative for the ponds studied here.
For comparison between sedimentary carbon accumulation and GHG emissions, we converted the yearly carbon accumulation in the ponds and the CH4 emissions (diffusive and ebullition) to CO2 equivalents (CO2eq). For the conversion to CO2eq of carbon storage in the ponds we used the mass difference between CO2 and carbon (44/12). For the conversion of CH4 to CO2eq we used a conversion factor of 25 for a 100 year time horizon (Forster et al., 2007). Converting the yearly carbon storage in the ponds gives a range of 79–1,639 g C (CO2eq). The combined estimated yearly CO2 and CH4 emission gives a total of 2,965 g C (CO2eq) m−2 yr−1. Thus, the potential CH4 emissions from the ponds are 1.8–37.5 times larger than the yearly carbon accumulation. Thus, if the assumed CO2 and CH4 emissions are representative for our studied ponds, these are net carbon sources. This observation is in contrast to previous studies that report that the CH4 emissions correspond to only a small fraction of the sedimentary carbon accumulation in constructed ponds, and that sedimentary carbon storage is a significant carbon sink (Mendonça et al., 2017; Taylor et al., 2019). But in agreement with the conclusions from recent studies showing that constructed ponds are net GHG sources (van Bergen et al., 2019; Peacock et al., 2021). However, given the large variability of CH4 emissions in small constructed ponds (Peacock et al., 2021), these estimates should be treated as very rough estimates for the ponds in this study.
The implication of the high CO2 and CH4 emissions in relation to the carbon burial is that small, constructed ponds cannot be treated as carbon sinks without a thorough analysis of the potential GHG emissions. Generally small waterbodies have higher CH4 emissions than larger lakes (Bastviken et al., 2011; Holgerson and Raymond 2016), and constructed ponds have higher emissions than natural lakes (Downing et al., 2008; Mendonça et al., 2017). The constructed ponds are often situated in agricultural environments with high nutrient input that often makes the lakes eutrophic with poor oxygen status which promotes both storage of autochthonous carbon and high methanogenesis. The shallow depths of small ponds promote methanogenesis and lead to short residence time and limiting the oxidation of CH4 in the water column. But small restored or constructed ponds can also have high carbon storage that can potentially offset the increased CH4 emissions (Smith et al., 2002).
Longevity of Carbon Storage and Relation to Local Anthropogenic CO2 Emissions
The longevity of the constructed ponds is difficult to predict, but we estimate the remaining time until the ponds are completely infilled by assuming constant sedimentation rate since the time of construction and continued accumulation of sediment up to the present water table. This gives estimates of the time until the ponds are completely infilled of between 50 and 150 years. These estimates are very rough since we assume constant sedimentation rate, and homogeneous sediment accumulation. The infilling and shallowing of the ponds will likely change the sediment delivery and preservation, for example, making the ponds shallower and more prone to drying out, which potentially limits the organic carbon storage. The shallower depths will also affect sediment throughflow and sediment preservation, which has been shown to be major controlling factors on carbon storage in ponds (Ferland et al., 2014). However, water depth and carbon stocks are negatively correlated, although not statistically significant, in the studied ponds and this might indicate a more complex relationship with pond depth. It is therefore likely that the carbon storage capacity of the ponds will decrease when almost completely infilled, but that the carbon accumulation until then might be high.
One aspect of infilling is the future management of the ponds. One possible management scenario is that the ponds are restored by excavating the sediments. If the ponds are re-excavated and the organic rich sediments are allowed to degrade the carbon will be released to the atmosphere, and the ponds can be treated only as temporary carbon storage (Mendonça et al., 2017). Generally, the long-term fate of organic rich sediments in constructed ponds is largely unknown and warrant a thorough site-specific investigation to determine the potential for carbon sequestration.
The carbon storage upscaled to all ponds within Lund municipality was compared to the total emissions from the municipality. Lund municipality has about 125,000 (2020) inhabitants and a total CO2 emission of 244,866 ton CO2eq (Neij et al., 2020). Assuming the same average carbon burial in all constructed ponds within the municipality, with a total area of 147 ha, gives a total of 79–1,639 ton CO2eq. Thus, the increased carbon storage in constructed ponds within the Lund municipality makes up 0.03%–0.67% of the total carbon emissions from the municipality, if the potentially enhanced CO2 and CH4 emissions are ignored. This is still a significant amount of carbon storage and the area of constructed ponds within Lund municipality is about 1/3 of the total area of constructed ponds within the Kävlingeån river and Höje å river catchments. If also considering the potential for increased GHG emissions from the ponds, the ponds are likely carbon sources, and it can be questioned if creating ponds in this setting is a useful measure for carbon emission offset. But the sedimentary carbon storage in constructed ponds can be treated as an offset to the increased GHG emissions from the ponds. In some cases, this offset can potentially turn the ponds into net carbon sinks, but this cannot be generally assumed. Other highly valuable benefits from constructed ponds, such as nutrient retention, biodiversity, and recreation, still makes it reasonable to construct ponds, and it can be argued that these benefits make the net increase in GHG emissions acceptable. However, if ponds are constructed as a carbon mitigation strategy, the full carbon budgets of the ponds need to be considered.
Conclusion
Newly constructed and restored ponds for nutrient retention also store substantial amounts of carbon. In this study we have measured carbon storage in six restored ponds in Lund municipality in south Sweden. The ponds store a total of 4,013 ton C carbon and have an average yearly accumulation of 152 g C m−2 yr−1. However, for accurate carbon budget estimations, the potential CH4 and CO2 production from the restored ponds must also be considered and our comparison with emissions measurements from similar constructed ponds shows that the ponds studied here are likely net carbon sources. Our conclusion is therefore, that constructed ponds in the settings studied here are likely not a viable carbon mitigation strategy if the potential increases of CH4 and CO2 are accounted for. Our results also show the need for better constraining both sedimentary carbon accumulation and greenhouse gas emissions in ponds.
Data Availability Statement
The raw data supporting the conclusion of this article will be made available by the authors, without undue reservation.
Author Contributions
KL conceived and planned the project. Field work and laboratory work was done jointly by KL and SL. Data summary and interpretations were done by KL and SL. The manuscript was written by KL and SL.
Conflict of Interest
The authors declare that the research was conducted in the absence of any commercial or financial relationships that could be construed as a potential conflict of interest.
Publisher’s Note
All claims expressed in this article are solely those of the authors and do not necessarily represent those of their affiliated organizations, or those of the publisher, the editors and the reviewers. Any product that may be evaluated in this article, or claim that may be made by its manufacturer, is not guaranteed or endorsed by the publisher.
Acknowledgments
Landowners who granted access to their lands and provided help during the sampling are greatly thanked. We thank Kristina Fontell and Linda Birkedal at Lund municipality who participated in the initiation of the study, and Ekologgruppen who provided information and background data on the studied ponds. Two reviewers are thanked for providing critical comments that greatly improved the manuscript.
References
Anderson, N. J., Heathcote, A. J., and Engstrom, D. R.Globocarb data contributors (2020). Anthropogenic Alteration of Nutrient Supply Increases the Global Freshwater Carbon Sink. Sci. Adv. 6 (16), eaaw2145. doi:10.1126/sciadv.aaw2145
Bastviken, D., Tranvik, L. J., Downing, J. A., Crill, P. M., and Enrich-Prast, A. (2011). Freshwater Methane Emissions Offset the Continental Carbon Sink. Science 331 (6013), 50. doi:10.1126/science.1196808
Battin, T. J., Luyssaert, S., Kaplan, L. A., Aufdenkampe, A. K., and Tranvik, L. J. (2009). The Boundless Carbon Cycle. Nat. Geosci. 2 (9), 598–600. doi:10.1038/ngeo618
Brodie, C. R., Casford, J. S. L., Lloyd, J. M., Leng, M. J., Heaton, T. H. E., Kendrick, C. P., et al. (2011). Evidence for Bias in C/N, Δ13C and Δ15N Values of Bulk Organic Matter, and on Environmental Interpretation, from a Lake Sedimentary Sequence by Pre-analysis Acid Treatment Methods. Quat. Sci. Rev. 30 (21–22), 3076–3087. doi:10.1016/j.quascirev.2011.07.003
Carstensen, M. V., Hashemi, F., Hoffmann, C. C., Zak, D., Audet, J., and Kronvang, B. (2020). Efficiency of Mitigation Measures Targeting Nutrient Losses from Agricultural Drainage Systems: A Review. Ambio 49 (11), 1820–1837. doi:10.1007/s13280-020-01345-5
Cole, J. J., Prairie, Y. T., Caraco, N. F., McDowell, W. H., Tranvik, L. J., Striegl, R. G., et al. (2007). Plumbing the Global Carbon Cycle: Integrating Inland Waters into the Terrestrial Carbon Budget. Ecosystems 10 (1), 172–185. doi:10.1007/s10021-006-9013-8
Davies, B., Biggs, J., Williams, P., Whitfield, M., Nicolet, P., Sear, D., et al. (2008). Comparative Biodiversity of Aquatic Habitats in the European Agricultural Landscape. Agric. Ecosyst. Environ. 125 (1), 1–8. doi:10.1016/j.agee.2007.10.006
Downing, J. A., Cole, J. J., Middelburg, J. J., Striegl, R. G., Duarte, C. M., Kortelainen, P., et al. (2008). Sediment Organic Carbon Burial in Agriculturally Eutrophic Impoundments over the Last Century. Glob. Biogeochem. Cycles 22 (1). doi:10.1029/2006GB002854
Downing, J. A. (2010). Emerging Global Role of Small Lakes and Ponds: Little Things Mean a Lot. Limnética 29 (1), 0009–0024. doi:10.23818/limn.29.02
Downing, J. A., Prairie, Y. T., Cole, J. J., Duarte, C. M., Tranvik, L. J., Striegl, R. G., et al. (2006). The Global Abundance and Size Distribution of Lakes, Ponds, and Impoundments. Limnol. Oceanogr. 51 (5), 2388–2397. doi:10.4319/lo.2006.51.5.2388
Euliss, N. H., Gleason, R. A., Olness, A., McDougal, R. L., Murkin, H. R., Robarts, R. D., et al. (2006). North American Prairie Wetlands Are Important Nonforested Land-Based Carbon Storage Sites. Sci. Total Environ. 361 (1), 179–188. doi:10.1016/j.scitotenv.2005.06.007
Ferland, M. E., Prairie, Y. T., Teodoru, C., and del Giorgio, P. A. (2014). Linking Organic Carbon Sedimentation, Burial Efficiency, and Long-Term Accumulation in Boreal Lakes. J. Geophys. Res. Biogeosciences 119 (5), 836–847. doi:10.1002/2013JG002345
Fleischer, S., Gustafson, A., Joelsson, A., Pansar, J., and Stibe, L. (1994). Nitrogen Removal in Created Ponds. Ambio 23 (6), 349–357.
Fleming-Singer, M. S., and Horne, A. J. (2006). Balancing Wildlife Needs and Nitrate Removal in Constructed Wetlands: The Case of the Irvine Ranch Water District’s San Joaquin Wildlife Sanctuary. Ecol. Eng. 26 (2), 147–166. doi:10.1016/j.ecoleng.2005.09.010
Forster, P., Ramaswamy, V., and Artaxo, P. (2007). “Changes in Atmospheric Constituents and in Radiative Forcing. Chapter 2,” in Climate Change 2007: The Physical Science Basis. Editors S. Solomon, D. Qin, M. Manning, Z. Chen, M. Marquis, K. B. Averytet al. (Cambridge, UK: Cambridge University Press).
Gälman, V., Rydberg, J., de-Luna, S. S., Bindler, R., and Renberg, I. (2008). Carbon and Nitrogen Loss Rates during Aging of Lake Sediment: Changes over 27 Years Studied in Varved Lake Sediment. Limnol. Oceanogr. 53 (3), 1076–1082. doi:10.4319/lo.2008.53.3.1076
Gilbert, P. J., Taylor, S., Cooke, D. A., Deary, M. E., and Jeffries, M. J. (2021). Quantifying Organic Carbon Storage in Temperate Pond Sediments. J. Environ. Manag. 280 (2), 111698. doi:10.1016/j.jenvman.2020.111698
Goeckner, A. H., Lusk, M. G., Reisinger, A. J., Hosen, J. D., and Smoak, J. M. (2022). Florida’s Urban Stormwater Ponds Are Net Sources of Carbon to the Atmosphere Despite Increased Carbon Burial over Time. Commun. Earth Environ. 3 (1), 53–58. doi:10.1038/s43247-022-00384-y
Graversgaard, M., Jacobsen, B. H., Hoffmann, C. C., Dalgaard, T., Odgaard, M. V., Kjaergaard, C., et al. (2021). Policies for Wetlands Implementation in Denmark and Sweden – Historical Lessons and Emerging Issues. Land Use Policy 101 (2), 105206. doi:10.1016/j.landusepol.2020.105206
Gudasz, C., Sobek, S., Bastviken, D., Koehler, B., and Tranvik, L. J. (2015). Temperature Sensitivity of Organic Carbon Mineralization in Contrasting Lake Sediments. J. Geophys. Res. Biogeosciences 120 (7), 1215–1225. doi:10.1002/2015JG002928
Herrero Ortega, S., González-Quijano, C. R., Casper, P., Singer, G. A., and Gessner, M. O. (2019). Methane Emissions from Contrasting Urban Freshwaters: Rates, Drivers, and a Whole-City Footprint. Glob. Change Biol. 25 (12), 4234–4243. doi:10.1111/gcb.14799
Hilton, J., and Gibbs, M. M. (1984). The Horizontal Distribution of Major Elements and Organic Matter in the Sediment of Esthwaite Water, England. Chem. Geol. 47 (1), 57–83. doi:10.1016/0009-2541(84)90099-8
Holgerson, M. A., and Raymond, P. A. (2016). Large Contribution to Inland Water CO2 and CH4 Emissions from Very Small Ponds. Nat. Geosci. 9 (3), 222–226. doi:10.1038/ngeo2654
Jacks, G. (2019). Drainage in Sweden -the Past and New Developments. Acta Agric. Scand. Sect. B — Soil & Plant Sci. 69 (5), 405–410. doi:10.1080/09064710.2019.1586991
Jansson, M., Leonardson, L., and Jonas, F. (1994). Denitrification and Nitrogen Retention in a Farmland Stream in Southern Sweden. Ambio 23 (6), 326–331.
Kortelainen, P., Pajunen, H., Rantakari, M., and Saarnisto, M. (2004). A Large Carbon Pool and Small Sink in Boreal Holocene Lake Sediments. Glob. Change Biol. 10 (10), 1648–1653. doi:10.1111/j.1365-2486.2004.00848.x
Krug, A. (1993). “Drainage History and Land Use Pattern of a Swedish River System — Their Importance for Understanding Nitrogen and Phosphorus Load,” in Nutrient Dynamics and Retention in Land/Water Ecotones of Lowland, Temperate Lakes and Rivers. Developments in Hydrobiology. Editors A. Hillbricht-Ilkowska, and E. Pieczyńska (Dordrecht: Springer Netherlands), 285–296. doi:10.1007/978-94-011-1602-2_31
Lindahl, T., and Söderqvist, T. (2004). Building a Catchment-Based Environmental Programme: A Stakeholder Analysis of Wetland Creation in Scania, Sweden. Reg. Environ. Change 4 (2), 132–144. doi:10.1007/s10113-004-0072-0
Mackay, E. B., Jones, I. D., Folkard, A. M., and Barke, P. (2012). Contribution of Sediment Focussing to Heterogeneity of Organic Carbon and Phosphorus Burial in Small Lakes. Freshw. Biol. 57 (2), 290–304. doi:10.1111/j.1365-2427.2011.02616.x
Malak, A., Marin, D., Trombetti, A. I., and San Roman, S. (2021). “Carbon Pools and Sequestration Potential of Wetlands in the European Union,” in Viena and Malaga: European Topic Centre on Urban, Land and Soil Systems.
Mendonça, R., Müller, R. A., Clow, D., Verpoorter, C., Raymond, P., Tranvik, L. J., et al. (2017). Organic Carbon Burial in Global Lakes and Reservoirs. Nat. Commun. 8 (1), 1694. doi:10.1038/s41467-017-01789-6
Meyers, P. A., and Ishiwatari, R. (1993). Lacustrine Organic Geochemistry-Aan Overview of Indicators of Organic Matter Sources and Diagenesis in Lake Sediments. Org. Geochem. 20 (7), 867–900. doi:10.1016/0146-6380(93)90100-P
Meyers, P. A. (1997). Organic Geochemical Proxies of Paleoceanographic, Paleolimnologic, and Paleoclimatic Processes. Org. Geochem. 27 (5–6), 213–250. doi:10.1016/S0146-6380(97)00049-1
Moore, T. L. C., and Hunt, W. F. (2012). Ecosystem Service Provision by Stormwater Wetlands and Ponds – A Means for Evaluation? Water Res. Special Issue Stormwater urban areas 46 (20), 6811–6823. doi:10.1016/j.watres.2011.11.026
Natchimuthu, S., Selvam, B. P., and Bastviken, D. (2014). Influence of Weather Variables on Methane and Carbon Dioxide Flux from a Shallow Pond. Biogeochemistry 119 (1), 403–413. doi:10.1007/s10533-014-9976-z
Neij, L., Olsson, J. A., Hiselius, L., Rummukainen, M., Hildingsson, R., Andersson, F. N. G., et al. (2020). Rapport 2020, Lunds Klimatpolitiska Råd.
Peacock, M., Audet, J., Bastviken, D., Cook, S., Evans, C. D., Grinham, A., et al. (2021). Small Artificial Waterbodies Are Widespread and Persistent Emitters of Methane and Carbon Dioxide. Glob. Change Biol. 27 (20), 5109–5123. doi:10.1111/gcb.15762
Renberg, I., and Hansson, H. (2008). The HTH Sediment Corer. J. Paleolimnol. 40 (2), 655–659. doi:10.1007/s10933-007-9188-9
Rudd, J. W. M., and Hamilton, R. D. (1978). Methane Cycling in a Eutrophic Shield Lake and its Effects on Whole Lake Metabolism 1. Limnol. Oceanogr. 23 (2), 337–348. doi:10.4319/lo.1978.23.2.0337
Smith, S. V., Renwick, W. H., Bartley, J. D., and Buddemeier, R. W. (2002). Distribution and Significance of Small, Artificial Water Bodies across the United States Landscape. Sci. Total Environ. 299 (1), 21–36. doi:10.1016/S0048-9697(02)00222-X
Stadmark, J., and Leonardson, L. (2005). Emissions of Greenhouse Gases from Ponds Constructed for Nitrogen Removal. Ecol. Eng. Constr. Wetl. wastewater Treat. 25 (5), 542–551. doi:10.1016/j.ecoleng.2005.07.004
Taylor, S., Gilbert, P. J., Cooke, D. A., Deary, M. E., and Jeffries, M. J. (2019). High Carbon Burial Rates by Small Ponds in the Landscape. Front. Ecol. Environ. 17 (1), 25–31. doi:10.1002/fee.1988
Tranvik, L. J., Downing, J. A., Cotner, J. B., Loiselle, S. A., Striegl, R. G., Ballatore, T. J., et al. (2009). Lakes and Reservoirs as Regulators of Carbon Cycling and Climate. Limnol. Oceanogr. 54 (6-2), 2298–2314. doi:10.4319/lo.2009.54.6_part_2.2298
van Bergen, T. J. H. M., Barros, N., Mendonça, R., Aben, R. C. H., Althuizen, I. H. J., Vera, H., et al. (2019). Seasonal and Diel Variation in Greenhouse Gas Emissions from an Urban Pond and its Major Drivers. Limnol. Oceanogr. 64 (5), 2129–2139. doi:10.1002/lno.11173
VattenAtlas (2022). VattenAtlas. Available at: https://vattenatlas.se/ (Accessed August 22, 2022).
Keywords: carbon stocks, carbon accumulation, constructed ponds, climate mitigation, sediment
Citation: Ljung K and Lin S (2023) Organic Carbon Burial in Constructed Ponds in Southern Sweden. Earth Sci. Syst. Soc. 3:10061. doi: 10.3389/esss.2023.10061
Received: 13 June 2022; Accepted: 03 January 2023;
Published: 12 January 2023.
Edited by:
Jack Longman, University of Oldenburg, GermanyReviewed by:
Mike Peacock, Swedish University of Agricultural Sciences, SwedenPeter Gilbert, University of the Highlands and Islands, United Kingdom
Copyright © 2023 Ljung and Lin. This is an open-access article distributed under the terms of the Creative Commons Attribution License (CC BY). The use, distribution or reproduction in other forums is permitted, provided the original author(s) and the copyright owner(s) are credited and that the original publication in this journal is cited, in accordance with accepted academic practice. No use, distribution or reproduction is permitted which does not comply with these terms.
*Correspondence: Karl Ljung, karl.ljung@geol.lu.se