 Malcolm Butler
 John R. Underhill
- 1UK Onshore Geophysical Library (UKOGL), New Malden, United Kingdom
- 2Centre for Energy Transition, School of Geosciences, Meston Building, King’s College, Aberdeen University, Aberdeen, United Kingdom
Hydrogen is envisaged to be an important element in the drive to replace hydrocarbons in the energy mix and its geological storage in man-made salt caverns or porous subsurface reservoirs onshore in the United Kingdom is being actively investigated. It has recently been suggested that porous Carboniferous sandstone reservoirs of the partially depleted and abandoned Cousland Field, located c.15 km SE of Edinburgh, could be used for the storage of hydrogen as part of efforts to decarbonise the industrialised and heavily populated central belt of Scotland. The gas field occurs in an onshore surface anticline situated in a culmination along a topographic ridge on the eastern flank of the Midlothian Coalfield. Mapping of outcropping beds led to a well, Cousland-1, being drilled in 1937-39 as part of a national campaign of oil exploration, which discovered natural gas in two thin sands. Despite the initial success, all the subsequent five appraisal wells, drilled between 1939 and 1960, were devoid of commercial hydrocarbons. Despite the disappointing drilling campaign, the field was still developed based on the original Cousland-1 well result and some 0.25 billion standard cubic feet (“scf”) (7.0 million m3) of gas were produced between 1939 and 1965 before the well was plugged and abandoned. This paper draws upon and integrates hitherto unpublished historical records, obtained from the archives of the UK Onshore Geophysical Library, to critically examine the possibility that the Cousland gas field might be re-purposed for hydrogen storage. These studies conclude that it is currently not possible to demonstrate the subsurface configuration, host reservoir distribution or sealing mechanism of the proposed storage container because the information required is not available and may be impossible to obtain. Rather than supporting the case for hydrogen storage, our new evaluation demonstrates that the Cousland field is a poor site that fails to meet the criteria for safe subsurface storage and should not be used for this purpose until and unless the significant challenges can be addressed.
Introduction
The UK is seeking to decarbonise and transition its energy system from its current reliance on oil and gas to one in which renewable sources predominate as part of its commitment to reach net zero carbon emissions by 2050 (HM Government, 2021). Measures are being taken to move to sustainable (clean) technologies that include wind, nuclear, solar, hydro, wave, tidal and geothermal energy, hydrogen production and carbon capture, utilization and storage (CCUS).
The role that hydrogen may play as a vector in the UK’s energy mix is receiving significant attention, particularly as a store of energy generated by wind and solar power, as a blend into, or the replacement of, existing natural gas supply distribution systems or as a substitute fuel for transportation. Hydrogen can be found naturally (so-called gold hydrogen), produced by reformation of fossil fuel sources like coal (black or brown), derived from methane gas with (blue) or without (grey) carbon capture or, via electrolysis of fresh water, utilising excess electricity generated by wind turbines or solar power (green).
Given the perceived need, it is important to identify the ways and means to store hydrogen safely. However, because hydrogen (H2) is such a small, nimble and diffuse molecule, it is hard to entrap and is prone to leakage. Current storage sites either rely upon entrapment (hermetically sealed) in man-made caverns in soluble halite (salt) deposits, such as plans by Equinor and SSE Thermal to convert existing natural gas storage caverns located in Upper Permian Zechstein group evaporites at the Aldbrough site in East Yorkshire to hydrogen storage (Aldbrough Hydrogen Storage, 2023), or above ground in liquid form (at lower than minus 252.9°C) in engineered containers, the largest of which is NASA’s 1.25 million US gallon (4,732 m3) fuel tank for its space programme (Fesmire and Swanger, 2021). In areas that are devoid of halite-bearing evaporite deposits, such as onshore Scotland, alternative subsurface solutions must be sought for large-scale storage. Porous subsurface reservoirs located in depleted oil and gas fields have been proposed (Heineman et al., 2018) as potential hydrogen stores because they are proven traps on geological time scales, with good seals, are well understood because of their exploration and production history and often still possess an existing production and pipeline infrastructure.
The aim of this paper is to examine the case for re-purposing a partially depleted gas field located in the Midland Valley of Scotland that has been proposed as a hydrogen store to serve the needs of Edinburgh and the wider Central Belt of Scotland (Heinemann et al., 2018). We have drawn upon an extensive database consisting of reflection seismic records, well logs, production records and reports to examine the site. Rather than support its use as a subsurface store, our results demonstrate that the depleted field fails to meet the criteria for site selection, and we conclude that its use as a hydrogen store should not be pursued at Cousland.
Hydrogen Storage Requirements
Hydrogen is being heavily touted as an alternative fuel as part of a low carbon pathway for the United Kingdom. As well as its use for transportation, there is the potential to blend it (up to 20%) into the current natural gas network in the short-term or to form a complete replacement for methane in the longer term. Production of green hydrogen could be stored and used to generate electricity to offset declines in generation from wind turbines and solar farms during inclement weather.
Limited underground storage of hydrogen currently takes place onshore in the UK in caverns leached into thick halite beds. However, the extent of suitable halite deposits in onshore areas is geographically limited (e.g., to deposits in the Cheshire, Humber and Cleveland Basins of Northern England; parts of the Wessex Basin in Southern England and the Larne Basin in Northern Ireland). Halite is completely absent from onshore areas in Scotland, which lie beyond the westerly limit of Upper Permian evaporite subcrop.
Given the geographical and geological limitations that result from an absence of halite in the subsurface, underground storage of the large volumes of hydrogen necessary to balance an electricity grid dependent on intermittent renewable generation would require an alternative such as the use of porous rocks, either in depleted oil and gas fields or within regional aquifers. This requirement for storage presents serious problems, particularly onshore, which have been highlighted in recent reports to the Scottish Government (Scottish Science Advisory Council, 2022), the House of Commons Science and Technology Select Committee (2022) and an editorial in Nature (2022). If this storage requirement cannot be met onshore in Scotland, storage in more remote, long-distance and expensive offshore subsurface locations, or the construction of numerous large gasometers, would be necessary.
Judging the suitability of porous sandstone rocks to form a storage container for hydrogen would first require detailed mapping of the trapping configuration at the top of the reservoir, normally some combination of closure by structural dip, faulting and stratigraphic pinch-out, of the quality and continuity of the host reservoir, which may range from a continuous sheet sand to discontinuous anastomosing channels with restricted lateral continuity, and the continuity and net thickness of porous and permeable zones in the reservoir. Those basic preliminary steps would enable a determination to be made of the storage capacity and hence quantity of hydrogen that could theoretically be stored in the reservoir. However, given that the small, nimble and diffuse nature of hydrogen leads to difficulty in entrapping the gas, of equal importance would be a detailed understanding of the sealing mechanism, both vertically and laterally (if trapped by faults). Overlying and adjacent impermeable beds must be tested to ensure they are not embrittled and liable to fail under pressure and detailed studies must be made to determine whether there are faults and fractures within the closure itself. Before considering the volumes to be stored and the rates at which hydrogen could be injected and produced, it is also important to compute and test the maximum pressures and flow rates that the reservoir rocks and seals would withstand without opening up existing fractures or creating new ones, thereby creating pathways for hydrogen to escape out of the original trap and potentially up to the surface. Added to these studies for an existing depleted hydrocarbon field would be analyses of the volume of residual hydrocarbons remaining trapped in low-permeability zones and the extent to which these might impede the flow of hydrogen or combine with it to form pore-clogging compounds. Our study presents a critical evaluation of each of the aforementioned issues and cautions against proceeding with sites where the essential elements, including data coverage and availability, are not present and technical assessment is lacking.
We anticipate that the structure, boundaries and characteristics of any potential underground hydrogen storage reservoir would have to be defined in detail, by 3D seismic data and borehole information. In addition, monitoring by 4D seismic, shallow boreholes and other methods should be in place to track the movement of the injected hydrogen plume and other gases and fluids within the reservoir and identify any potential leakage. Demonstrating a clear understanding of all these issues is likely to be required if projects are to obtain a clear social mandate to operate that satisfies the inevitable serious concerns over health and safety that will be voiced by nearby populations.
Scotland has the potential to generate significant excess electricity from wind turbines around its coasts and to utilise this to produce green hydrogen. However, given the aforementioned absence of thick halite beds beneath onshore areas of Scotland, subsurface storage would have to rely on porous rocks.
Heinemann et al. (2018) attempted to identify onshore sites in the Midland Valley of Scotland, to assess the potential to store hydrogen to serve the Central Belt including the country’s two largest cities of Glasgow and Edinburgh. They concluded that the Carboniferous age sedimentary deposits of the D’Arcy-Cousland High and the Balgonie Anticline close to Edinburgh would make suitable hydrogen storage sites and were ideal for an early hydrogen storage research project. Special mention was made of the abandoned Cousland gas field, the storage potential of which has been the subject of further studies recently (Scafidi, 2022). This proposition is considered below, making use of detailed information on the field dating from the 1930s to the 1970s available in the archives of the UK Onshore Geophysical Library (“UKOGL”).
Regional Setting
Cousland is a village housing around 300 people. It is located around 12 km SE of Edinburgh (Figure 1) and lies at an elevation of 160 m on the crest of a prominent SW-NE striking topographic ridge that conforms to a surface anticlinal structure (Figure 2), the recognition and mapping of which led to drilling for petroleum as part of the UK’s efforts to find oil in the 20th Century (Lees and Cox, 1937; Lees and Taitt, 1945).
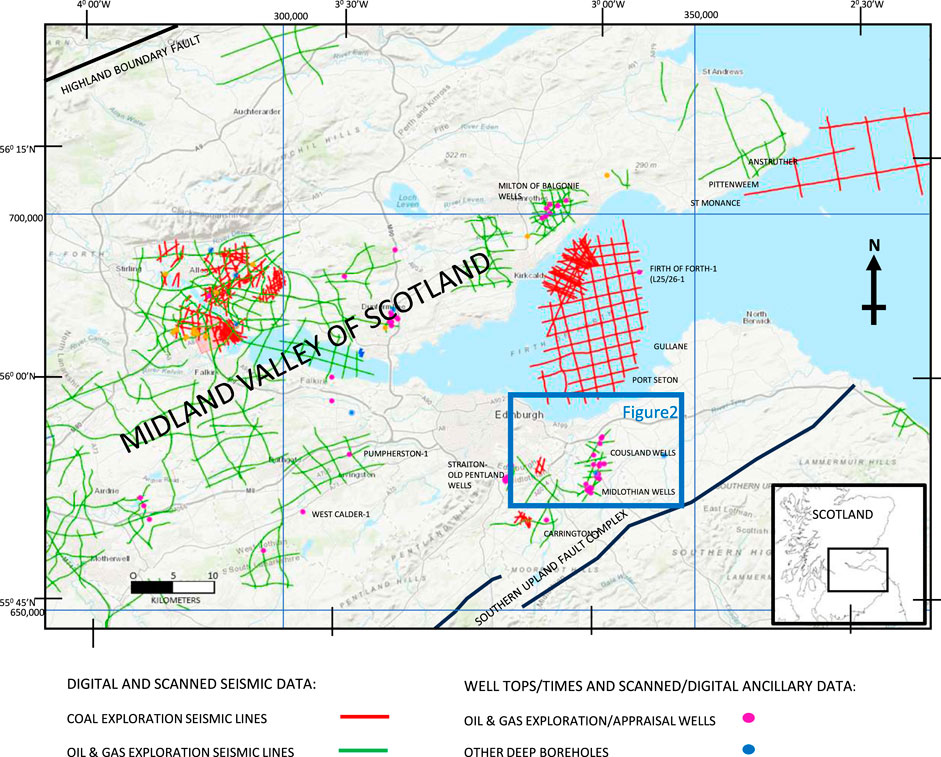
FIGURE 1. Location map, showing seismic and well data available from UK Onshore Geophysical Library (based on UKOGL website, with permission: https://ukogl.org.uk).
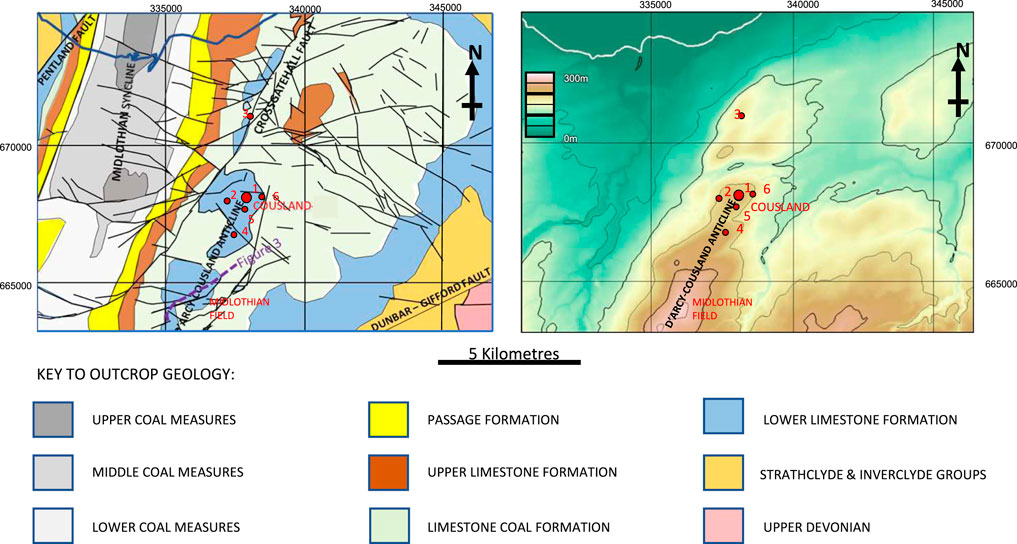
FIGURE 2. Surface geology and topography of the Cousland area, showing the coincidence of the pronounced topographic high with the D’Arcy-Cousland Anticline. Geology modified after the BGS 1:50,000 mapping (McAdam and Tulloch, 1985). Only Cousland wells are shown (red dots). Position of line in Figure 3 is highlighted.
As regards its geological setting, the Cousland area lies within the Midland Valley of Scotland, defined by the Highland Boundary Fault to the north and the Southern Upland Fault complex to the south (Figure 1). The WSW-ENE striking Midland Valley Basin formed in the Devonian and became a major depocentre in the Carboniferous before experiencing contractional deformation resulting from the far-field effects of Variscan mountain building to the south (Underhill et al., 2008). The D’Arcy-Cousland Anticline, the northern part of which forms the Cousland field, is one of several NNE-SSW striking folds that resulted from the Variscan deformation and obliquely transect the basin (Figure 2).
A number of W-E striking igneous dykes of Late Carboniferous age (Monaghan and Parrish, 2006) cross-cut folds affecting Carboniferous sequences in the Midland Valley, for example, at Port Seton (McAdam and Tulloch, 1985; their Figure 16), demonstrating that these folds formed as a result of Variscan deformation rather than later tectonism (Underhill et al., 2008).
Studies in offshore areas including the Forth Approaches (Cartwright et al., 2001; Brackenridge et al., 2023) show that the basin experienced a period of uplift and exhumation that formed the Base Permian Unconformity surface before a renewed phase of rift-related subsidence was initiated during the Permian and continued until the Early Cenozoic. The Midland Valley underwent differential uplift during the Cenozoic, with western (onshore) areas rising more than eastern ones lying offshore (Underhill et al., 2008; Brackenridge et al., 2020), one consequence of which was to bring Upper Palaeozoic rocks back to the surface in the Cousland area.
Devonian and Carboniferous sedimentation not only records the effects of syn-rift (fault-related) and post-rift subsidence, but also the complex interplay with climate and sea-level changes. At a first order scale, depositional history charts the change from Upper Devonian continental red bed deposition (Inverclyde Group) through marginal to shallow marine environments (Strathclyde Group) and a return to a mixed marine but increasingly fluvially influenced (Clackmannan Group) and then deltaic (Coal Measures) deposition (Underhill et al., 2008). The depositional patterns were especially complex during the Lower Carboniferous (Mississipian), when a tripartide subdivision in gross depositional environments occurred within the Strathclyde Group. North western areas were dominated by a major (c.4 km thick) package of SW-prograding fluvio-deltaic deposits ascribed to the previously named Calcareous Sandstone Measures. In contrast, contemporaneous deposition in more distal areas was either dominated by lacustrine oil shales to the west (West Lothian Oil-Shale Formation) or marine influences to the south east (Aberlady Formation), as exemplied by coastal exposures in the Scottish Borders and NE England [e.g., in Spittal (Booth et al., 2020)]. The Lower Carboniferous of the Cousland area (Figure 2) lay at the thin end of the deltaic wedge, where it interfingers with the oil shales (Loftus and Greensmith, 1988).
Local Geology of the Cousland Area
The Cousland Anticline is a relatively small (1.3 km by 1.0 km) periclinal fold that forms a surface closure along the axis of the major SSW-NNE striking D’Arcy-Cousland Anticline (Figure 2). This lies on the eastern limb of the Midlothian Syncline that is interpreted as an asymmetric fold developed in the immediate footwall to the steeply-dipping, contractional Pentland Fault (Figure 2), a post-depositional reverse fault of Late Carboniferous (Variscan) age (Underhill et al., 2008). The more local culmination partly underlies the village of Cousland and is coincident with a topographic ridge, which outlines a surface anticline in which the Mississippian-age Lower Limestone Formation of the Clackmannan Group (Browne et al., 1999) is brought to the surface below the overlying Limestone Coal Formation (McAdam and Tulloch, 1985; Figure 2).
Although the gross structure is relatively simple, it is broken by a number of minor faults, with a dominant WNW-ESE trend (Figure 2). However, Figure 2 also demonstrates that, where coal mining has taken place in the Limestone Coal Formation to the northeast of Cousland, complex faulting with a range of orientations has been identified. In the Midlothian Field, some 5 km south of Cousland-1, LASMO was able to acquire a good-quality seismic line in 1982 (Figure 3). Well ties have enabled the identification of a series of faults breaking the stratigraphic zone in which lie the gas reservoirs in Cousland Field (LASMO, 1985; Figure 7). Red lines on this section illustrate faults that have been mapped as intersecting the surface by the British Geological Survey (BGS) (McAdam and Tulloch, 1985). The line shows that many of the interpreted faults have not been identified at the surface and may not affect the Lower Limestone Formation and shows the relationship of the simple topographic high to the underlying complex structure. It is probable that the same situation occurs at Cousland.
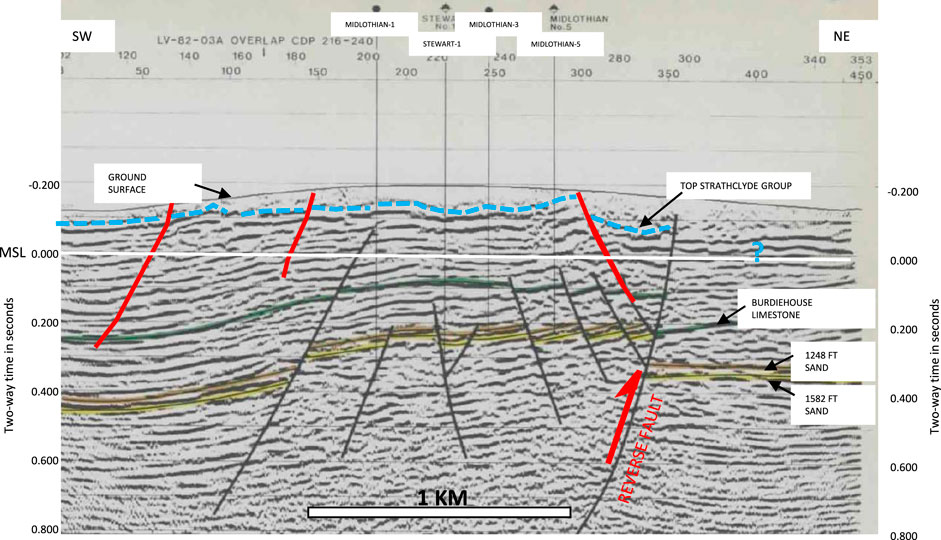
FIGURE 3. Seismic line LV-82-07 with interpretation across the D’Arcy-Cousland Anticline by LASMO (1985), with addition of estimated top Strathclyde Group pick and surface faults. Location shown as dashed purple line on Figure 2. Red lines show faults mapped at the surface on BGS 1:50,000 sheet (McAdam and Tulloch, 1985). MSL, Mean Sea Level. This line is migrated but unfortunately the digital file could not be located.
In the Cousland area, the basal hard limestone of the Lower Limestone Formation is locally termed the Gilmerton Limestone, which overlies the Aberlady Formation of the Strathclyde Group. The Strathclyde Group sequence was originally defined in the main oil-shale mining area to the west of Edinburgh (Craig and Underhill, 2019). In the wells drilled into the Cousland area in the 1930s–1960s, what was then defined as the West Lothian Oil Shale Formation was divided into the Upper Oil Shale Group and the Lower Oil Shale Group, separated by the Birdiehouse Limestone (Figures 3, 4), an algal lacustrine deposit (Loftus and Greensmith, 1988). Revision of the lithostratigraphy by Browne et al. (1999) separated the East Lothian sequences, including the Cousland area, into the Visean-age Aberlady Formation and underlying Gullane Formation. Both Formations are characterised by sharp and erosively based, laterally continuous channelised sand bodies that cut into heterolithic units consisting of fine grained wave-rippled sandstones, siltstones and lacustrine oil-shales. Many of the sandstone units display evidence of soft sedimentary deformation, resulting from syn-depositional slope failure and liquefaction. Figure 5 illustrates the outcrop of these beds on the foreshore near Hummell Rocks at Gullane (Day, 1914). The depositional characteristics are consistent with deposition at the distal end of the south-westerly-thinning deltaic wedge, the proximal equivalents of which are found along the East Fife Coast from St. Monance to Pittenweem and Anstruther (Forsyth and Chisholm, 1977).
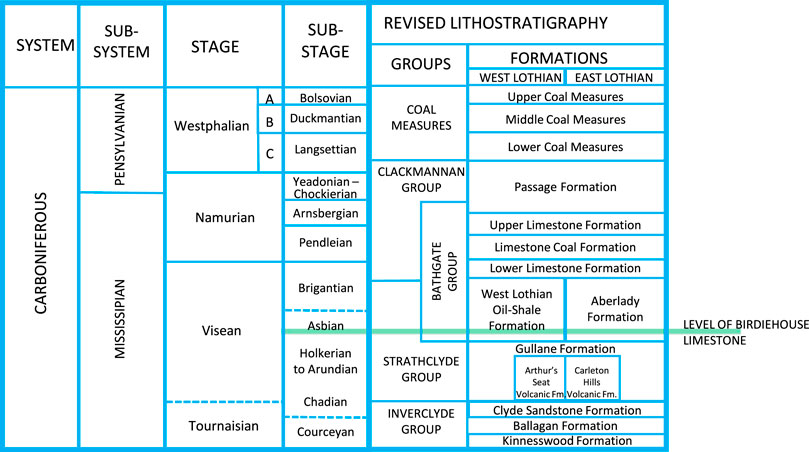
FIGURE 4. Revised lithostratigraphy for East and West Lothian (after Browne et.al., 1999). The Birdiehouse Limestone is a marker bed in the West Lothian Oil-Shale Group that was identified by Falcon (1941) at 75–87 m subsea in Cousland-1. If correct, this would place the 1,582 ft reservoir zone (at 309.9 m subsea) in the lower part of the Aberlady Formation or the upper part of the Gullane Formation, which are components of the Strathclyde Formation.
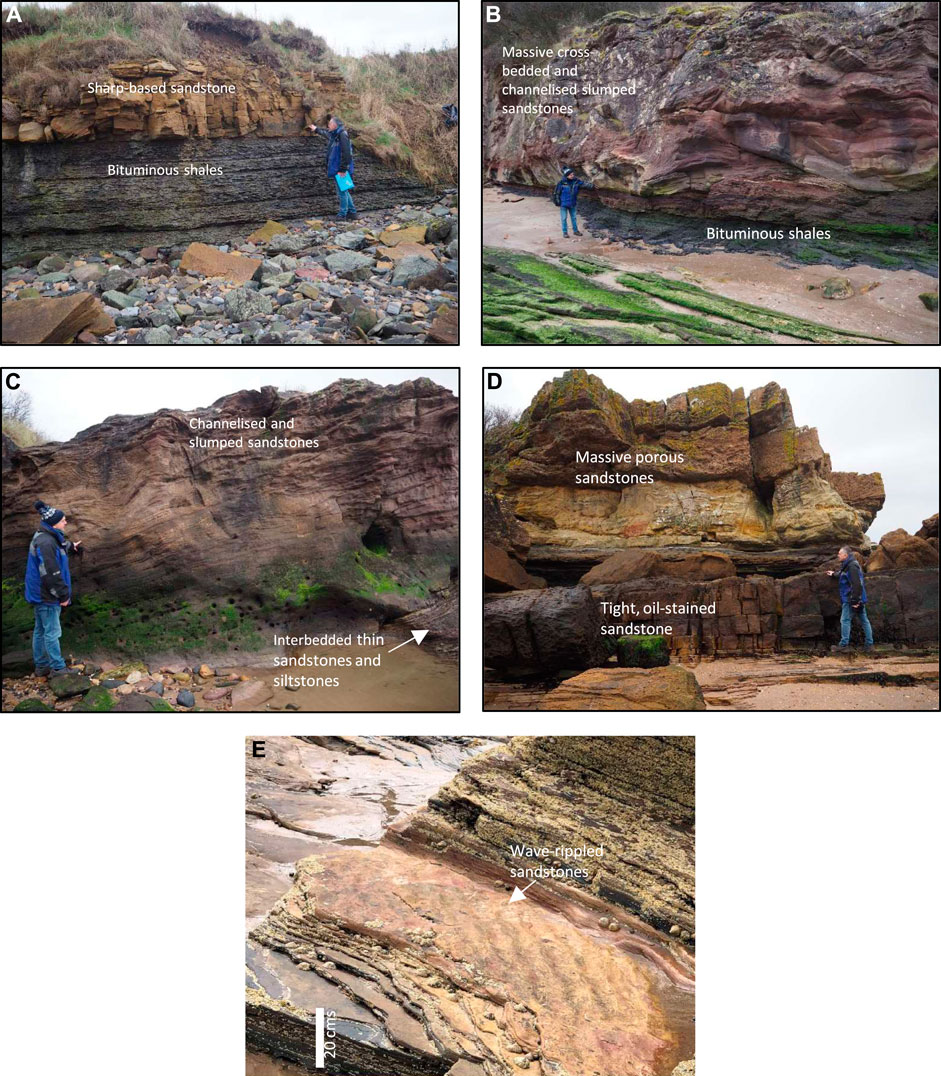
FIGURE 5. Sedimentary characteristics displayed in coastal exposures of the Strathclyde Group. (A) Thick bituminous shales overlain conformably by planar-bedded sandstone; (B) Massive slumped and cross-bedded sandstones overlying thin oil-shales, with interbedded thin sandstones; (C) Slumped and cross-bedded sandstones overlying interbedded thin sandstones and siltstones; (D) Massive, porous sandstones overlying a thin sandstone/shale interbedded layer and a massive tight, oil-stained sandstone. (E) Wave-rippled top surface of sandstones in the heterolithic units that are indicative of a shoreline to a lake. Taken together, the exposures are consistent with deposition at the distal end of a major fluvio-deltaic distributary system dominated by sharp-based erosive sandstone channels, the internal architecture of which often displays soft sedimentary deformation, that incise into heterolithic units and laminated oil shales. Locations: (A) Kilspindie Foreshore (NG ref: 3452 6802); (B–E) Gullane Beach (NG ref: 3486 6830).
Discovery and Appraisal of Hydrocarbons at Cousland
Cousland-1 was drilled by British Petroleum (BP) in 1937-9 on a topographic high underlain by an anticlinal closure defined by surface mapping and shallow boreholes (Figure 2), as part of a wider, national campaign to secure indigenous oil resources in the UK (Lees and Cox, 1937; Lees and Taitt, 1945). The well discovered gas with oil traces in two main reservoir zones, the “1,582 ft” (depth measured from the Rotary Table—“MD”) zone between 309.9 m and 325.1 m subsea depth and the “1,720 ft” MD zone between 351.9 m and 378.1 m subsea depth. Each of these zones was tested initially in the open hole and then through perforations in 8 ¾ inch casing. The 1720 ft zone flowed on open-hole drill-stem test (“DST”) of the interval 1,724–1,806 ft MD (353.1–378.1 m subsea) at an initial rate of 5.9 million standard cubic feet per day (“scf/d”) (165 thousand m3/d). The interval 1,760–1,806 ft MD (364.2–378.1 m subsea) was then production tested through 8 ¾ inch casing at an initial rate of 13 million scf/d (364 thousand m3/d), declining to 7 million scf/d (196 thousand m3/d) after 3 days and with an increase in water production from 17,000 gallons (77 m3) to 22,000 gallons (100 m3) per day (Tracy, 1957). Total production was 35 million scf (980 thousand m3) and 75,000 gallons (341 m3) of water.
As a result of the production data, it was concluded that the level of the sand in the well was close to the gas-water contact and no further testing was carried out on the 1,720 ft zone. It seems likely that this zone would have been productive for gas had it been possible to identify a well location up-dip from Cousland-1. The 1,582 ft zone flowed initially on open-hole DST at 3–4 million scf/d (84–112 thousand m3/d), carried out with a 600 psig differential between the reservoir and the well bore. Sands within the 1,582 ft zone were then perforated through 8 ¾ inch casing in the intervals 1,582–1,613 ft MD (309.9–319.4 m subsea) and 1,625–1,630 ft MD (323.1–324.6 m subsea) combined and put on test production for 30 days though the 8 ¾ inch casing at a rate of 1 million scf/d (28 thousand m3/d), with no water. Both the 1,582 ft sand zone and the 1,720 ft sand zone were cored completely. The 1,582 ft reservoir consisted of a 9.5 m thick Upper Sand and a 2.7 m thick Lower Sand within a 15.2 m interval. Details of the 1,582 ft zone cored in Cousland-1, from the completion report on wells 1 to 3 (Falcon, 1941), are shown in Figure 7. Only three permeability measurements are available from this zone: 278 mD from the main part of the Upper Sand, 46 mD from near the base of the Upper Sand and 2.5 mD from the base of the Lower Sand. The lower measurements were taken in zones where the cores were described as having “Kingle” concretions and were oozing oil, suggesting poor permeability (S&P Global, 2019). Testing of the interval 1,274–1,275 ft MD (216.0–216.3 m subsea) in Cousland-1 did recover some 32.7° API oil with a 26.5% wax content (LASMO, 1985) that was assumed to have been sourced from the local oil-shales. Testing of other oil-saturated sands in Cousland-1 failed to produce any oil after significant effort was undertaken to stimulate flow (Falcon, 1941), but clearly the fact that cores were “oozing” oil meant there was likely to be some mobile element. However, a D’Arcy Oil Company (BP) study (Comins, 1949) reported that the composition of the produced gas from the 1,582 ft sand was 86.2% methane and 7.6% carbon dioxide with few heavier hydrocarbon molecules, despite the common presence of residual oil in the sands. During later gas production the Scottish Gas Board noted that traces of bitumen were present in the gas stream and being picked up in their water separator (Ricketts, 1959).
Cousland-2 was drilled immediately afterwards 775 m west of Cousland-1, to appraise the discovery, and found the 1,582 ft zone at 1,900 ft MD (447.6 m subsea) and the 1,720 ft zone at 2,016 ft MD (483.0 m subsea). The 1,582 ft reservoir zone had thinned significantly, with only a single 2.4 m thick sand. Testing of this interval recovered water with a little gas and the well was interpreted at that time to be close to the gas-water contact in the 1,582 ft zone. Testing of the 1,720 ft zone also produced water with traces of gas. It is interesting to note calculations made later by BP (Dickie, 1939) that comparison of pressures measured on tests in Cousland-1 and Cousland-2 suggested that the wells were in communication in the 1,720 ft zone and that the gas-water contact in this zone was at 1,802 ft MD in Cousland-1 (377 m subsea), about 1 m above the base of the tested perforations and consistent with the test results. A further well, Cousland-3, was drilled back-to-back as a step-out some 3.3 km north of Cousland-1 but failed to find gas, the top of the 1,582 ft sand zone being picked at 2,106 ft MD (499.2 m subsea), with a gross thickness of 28 ft (8.5 m) (Falcon, 1941) After correlating the first three wells, Falcon (op.cit.) made the observation that the presence of bitumen in the various sandstone levels seemed to be more abundant in the structurally higher areas, suggesting that there had originally been an accumulation of oil that had been breached. This observation was later supported by the occurrence of bitumen in Cousland-6 (Terris, 1960). Cousland-1 was suspended in 1941, pending further evaluation of the discovery and investigation of local gas markets.
The sandstone zones identified in the first three wells are separated by a mix of oil shales, micaceous shales and silts, with thin sandstones, ironstones, dolomites and limestones (Falcon, 1941; Figures 7, 9). Unfortunately, no porosity logs were run in any of the wells to give a better indication of reservoir quality or the integrity of the seals. The lack of seismic data with sufficient resolution to define the sandstones makes it impossible to determine how they are distributed or the extent to which they interfinger, although Figures 8, 9 give some indication of changes taking place over a relatively short distance.
Mapping of the 1,582 ft gas accumulation by BP, after the drilling of the first three wells (Falcon, 1941), suggested that it occurred in a narrow subsurface anticline, oriented N-S and possibly forming a second small culmination some 1.7 km south of Cousland-1 (Figure 10A). To test this hypothesis, Cousland-4 was drilled at the expected location of this second culmination by BP in 1947. In general, all the sands penetrated by the well were thin, fine-grained and impermeable (Kent, 1947) and, in the absence of any palaeontological markers in these wells, no clear correlation could be made. A 32 ft (9.8 m) thick “oily” sand at 1,580 ft MD (289.2 m subsea) was tested and produced gas on a DST at a rate of 5,700 scf/d (159 m3/d), declining to 320 scf/d (9.0 m3/d) after 4 h. 40 min, with no water. Core analysis of this zone gave porosities in the range of 7.7%–13.1%, with permeabilities in the range of 0.8–33 mD (Adcock, 1947). Kent (op.cit.) suggested that the well was structurally higher than Cousland-1 and this sand may be the equivalent of the 1,582 ft zone in the first well. A test of sands in the interval 1,471–1,520 ft MD (256.0–271.0 m subsea) did test gas at on DST at rates of up to 100 thousand scf/d (2.8 thousand m3) but the well was abandoned as non-commercial.
In 1954, the Gas Council (later British Gas Corporation—BGC) arranged for a well to be drilled some 300 m south of Cousland-1, at a location mapped as being slightly higher than the first well at the 1,582 ft level, in the hope of proving up more reserves to justify developing the gas accumulation. Cousland-5 did demonstrate the presence of permeable reservoirs in positions equivalent to the 1,582 ft and 1,720 ft zones of Cousland-1, although the sands were deeper, interpreted as being considerably more shaly than in Cousland-1 (Tracy, 1957) and with lower porosities. Core descriptions indicated the sands to be micaceous, as in Cousland-1, but also feldspathic, unlike Cousland-1 (Figures 7, 9). The 1,582 ft reservoir zone was encountered at 1,693 ft MD (348.1 m subsea) and was slightly thicker overall than that in Cousland-1. Although the position of the overall zone could be correlated with Cousland-1 over the 300 m distance, the Upper Sand of the first well had split into two in Cousland-5 (Figures 8, 9). In addition, an overlying porous sand not seen in Cousland-1 was encountered by Cousland-5 at 1,655 ft MD (336.8 m subsea) and tested 4,000 scf/d (112 m3/d) with 200 gallons/d (0.9 m3/d) of water. Testing of the Upper Sand of the 1,582 ft zone interval 1,686–1,702 ft MD (345.9–350.8 m subsea) produced small amounts of gas, with water at 200 gallons/d (0.9 m3/d).
Analysis of the pressures in Cousland-1 and Cousland-5 within the 1,582 ft sand package indicated a gas-water contact for this reservoir zone at 1,110 ft (338.3 m) subsea (Adcock, 1954a), lying within the higher sand body encountered in Cousland-5 and suggesting the higher sand to be in communication with the 1,582 ft sand of Cousland-1. It is interesting to note that the composite log of Cousland-1 (downloadable from UKOGL website) describes an untested gas pocket in a thin dolomitic oolite 10 ft (3 m) above the top of the 1,582 ft sand (Figure 9), raising questions about the integrity of the top seal in this well. Having defined maximum southern and western limits of the accumulation, a new structure map was generated, incorporating further shallow boreholes drilled to evaluate the commercial mining potential of the Lower Limestone Formation. This map pre-dates the availability of seismic data and revised the orientation of the structure from an anticline with an approximately N-S axis to an almost circular dome (Figure 10B).
The electric logs in Figures 8, 9 and correlations by Keenlyside (1954) demonstrate that the overall sandstone content within the 1,582 ft zone reduces somewhat between Cousland-1 and Cousland-5, in a direction which is roughly parallel to the front of the clastic wedge from the northeast. A more significant reduction in sand at this level from Cousland-1 to Cousland-2 is shown by Falcon (1941), from which it is interpreted that the latter well lay in a more distal position within the deltaic wedge. However, the 1,720 ft zone sands appear to have thickened from Cousland-1 to Cousland-2 (Figure 8). In 1959, the Gas Council proposed to BP that a new well, Cousland-6, be drilled within the closure of the re-defined structure, some 520 m east of Cousland-1 (Figure 6). Cousland-6 was drilled to a subsea depth of 412.5 m but penetrated a Strathclyde Group sequence that could not easily be correlated with Cousland-1, there being no useful palaeontological markers within this sequence. However, matching well logs and assuming several fault cut-outs, a tentative pick was made by BP for the top of the 1,582 ft sand at 1,358 ft MD (244.4 m subsea). Assuming this to be the 1,582 ft reservoir zone, the sands were thinner than in Cousland-1 and appeared to be of poorer quality, despite pre-drilling expectations that sand quality would improve in this location (Terris, 1960). Dips of between 25° and 70° were noted in individual cores taken between 1,157 ft and 1,910 ft MD (187 m and 412.5 m subsea) and several probable fault zones were identified (Terris, 1960). The fact that the well deviated to the SSW at deeper levels was taken to indicate that the above strong dips measured in the well are probably to the NNE.
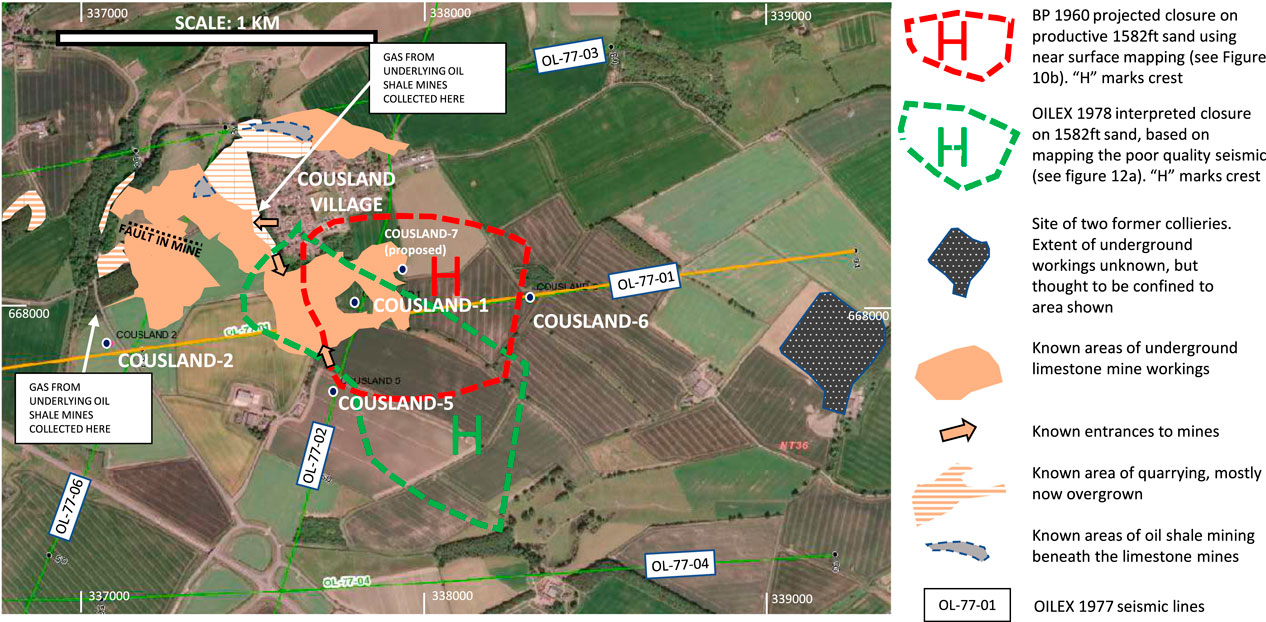
FIGURE 6. Surface image of the Cousland area, showing locations of wells and seismic lines. Also shown are the two conflicting areas of interpreted closure at the 1,582 ft reservoir level and surface problems that will make access for drilling difficult and inhibit the ability to map the reservoir (Background image modified from UKOGL website based on Google Earth, by permission).
Despite efforts to stimulate the well with explosive charges, no significant gas production was obtained. Re-evaluation of the structural mapping by BP after the well results suggested that Cousland-6 was separated from the Cousland-1 accumulation by a fault down-throwing to the west but that there might still be an untested crest some 185 m NE of the first well (Figures 6, 10B). However, mapping at the 1,582 ft level was still reliant on a downward projection of the Lower Limestone Formation structure. In the event, the proposed well on this feature (to be called Cousland-7) was never drilled and the rights to the Cousland area were relinquished by BP. The Cousland-Midlothian area was licensed to Oil Exploration (Holdings) Ltd. (“OILEX”) in 1975 under XL048. OILEX was acquired by London and Scottish Marine Oil Company (“LASMO”) in 1979, the licence was converted to PL 177 in 1980 and relinquished in 1988, with no new drilling having taken place. OILEX acquired the first reflection seismic data over the Cousland area in 1977, using a dynamite source. The surface coverage and quality of the data was very poor (Figure 13), due largely to the need to avoid dwellings and the presence of large areas of shallow mining for limestones and coal.
Unfortunately, It has not been possible to reprocess these data with modern technology because the field tapes cannot be found. Despite the poor quality of the data, OILEX generated a map at the level of the 1,582 ft sand (Figure 11). This map, based on seismic data and radically different from previous BP mapping based on shallow borehole data, postulated several faults across the anticline and indicated the crest of the closure to lie some 450 m SE of Cousland-1. A fault was picked cutting Cousland-1 near the top of the Strathclyde Group, which is consistent with BP’s correlation after the drilling of Cousland-5 that interpreted two fault cut-outs totalling 54 ft (17.1 m) in this zone in Cousland-1 (Jones, 1954), but the large down-to-the-west fault postulated by Terris (1960) between Cousland-1 and Cousland-6 (Figure 10B) was not interpreted, nor were other minor faults interpreted by him in Cousland-6. The top of the 1,582 ft zone was mapped by OILEX at about 1,200 ft subsea (365.7 m subsea) in Cousland-6, lying close to a major reverse fault bounding the Cousland structure (Figures 11, 13). The significant differences between the two interpretations are an indication of the large uncertainties created by a lack of definitive data on the subsurface structure: it is unlikely that either interpretation is representative of the morphology at the 1,582 ft sand level, although each ties the same interpreted well tops, with the exception of Cousland-6.
Hallett et al. (1985) Illustrated a highly disturbed structure at depth in Midlothian Field wells in the core of the southern part of the D’Arcy-Cousland Anticline (Figures 1, 2), based on early mapping by OILEX. The steep dips encountered in Cousland-6 (Terris, 1960) and in the deeper parts of Cousland-1 and -3 (Falcon, 1941) suggest that a similar situation may occur on trend in the Cousland Anticline. Figures 11, 13 show an interpreted reverse fault bounding the Cousland structure immediately east of Cousland-6 that lies on trend with the reverse fault bounding the D’Arcy-Midlothian structure shown by Hallet et al. (op.cit.) and by LASMO interpretations (Figure 3). How much this affects the structure at the level of the 1,582 ft zone is impossible to say without further information, but the structure is unlikely to be as simple at depth as BP’s mapping within the Lower Limestone Formation might indicate (Figure 10B).
Production History and Estimates of Natural Gas Originally in Place
A BP study (Adcock, 1954b), reviewing the results of the 1939 flowing production test of the 1,582 ft zone and the very slow wellhead pressure build-up during the following 8 years while closed in, concluded that Cousland had a “small, though good, local reservoir, with restricted connection over a wider area by poor permeability conditions.” Adcock (op. cit.) calculated gas volumes in the 1,582 ft zone for various reservoir diameters and net sand thicknesses, using 15% average porosity, 40% average water saturation and gas saturation of 48.1 scf per ft3 of reservoir space. For a reservoir diameter of 2,200 ft (670.5 m) and an average net sand thickness of 50 ft (15.2 m), this analysis would indicate gas originally in place—“GOIP” (other workers use gas initially in place—“GIIP”, which has the same meaning) of some 850 million scf (23.8 million m3). Given the range of net 1,582 ft sand thicknesses encountered in the wells, none of which reached 50 ft, it seems unlikely that average net sand thickness would achieve this level in the field area (see Figures 7–9).
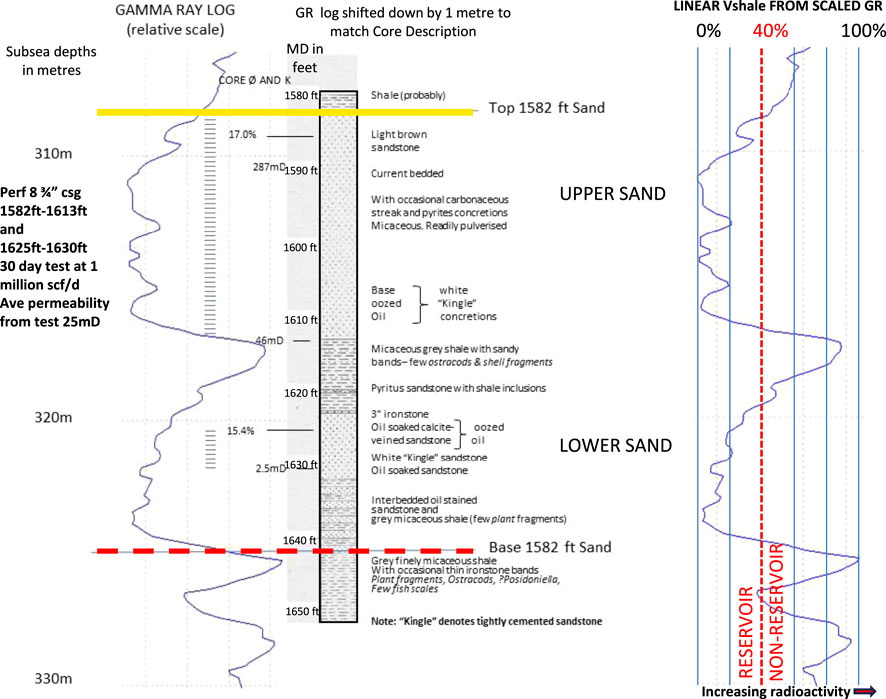
FIGURE 7. Details of 1,582 ft zone cored in Cousland-1, including results of core plug analysis (D-porosity, K-permeability). Lithology descriptions taken verbatim from BP completion report (Falcon, 1941). Note that the original testing of this well was carried out through combined perforations in both the Upper and Lower Sand bodies in the zone, whereas the production from 1958 to 1966 took place from perforations in the Upper Sand only (see Figure 9). Rotary Table elevation (RTE) was 565.2 ft (172.3 m) above Mean Sea Level. MD-measured depth from RTE. Right-hand side shows a simplistic linear determination of net reservoir derived by scaling the Gamma Ray (GR), assuming the highest reading is 100% shale and the lowest reading is 0% shale. A 40% cut-off would include probable low porosity and permeability zones in the basal part of the Upper Sand and in the basal part of the Lower Sand as net reservoir: using the GR as a basis for determining sand porosity (Scafidi, 2022) would produce erroneous results.
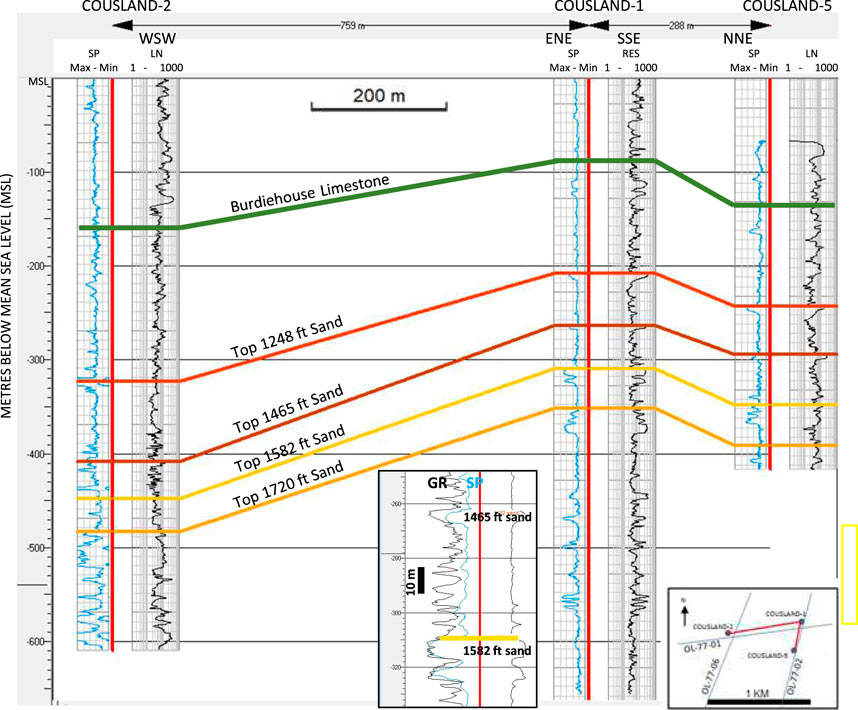
FIGURE 8. Electric log correlation of Aberlady Formation and probable Gullane Formation sands in Cousland-1, -2 and -5, based on picks of Falcon (1941) and Jones (1954). SP, Spontaneous Potential Log; LN, Log Normal resistivity log; RES, Resistivity Log. Inset shows Gamma Ray (GR-black, relative scale increasing to right) superimposed on the SP log (blue) of Cousland-1, indicating the variable lithologies and lack of any thick high-gamma shale sealing the 1,582 ft sand zone.
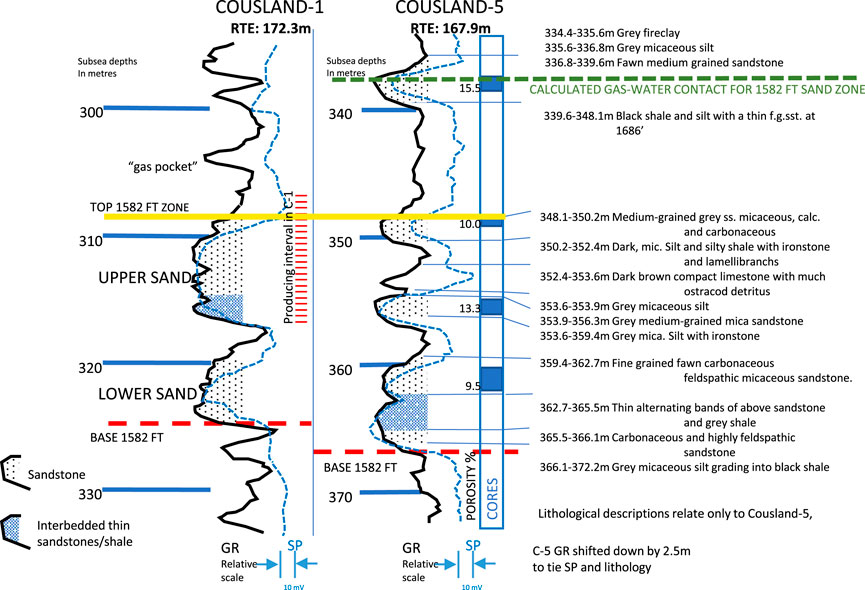
FIGURE 9. Correlation of 1,582 ft sand zone between Cousland-1 and Cousland-5. The Spontaneous Potential (SP) log seems to give a better indication of porous sand zones than does the Gamma Ray (GR). Note the higher gas-bearing sand above 340 m in Cousland-5, which was not seen in Cousland-1. Cousland-1 was cored throughout this interval: Cousland-5 cored zones are as shown. Cousland-5 lithological description copied verbatim from Keenlyside (1954). RTE, Rotary Table elevation.
In a letter approving the drilling of a further well (Cousland-4), Lees (1946) noted that current estimates of sustainable production levels from Cousland-1 by BP were between 250 thousand and 500 thousand scf/d (7.0 thousand to 14.0 thousand m3/d), based on pressure decline during the 1939/40 production test, but that it was possible Cousland-1 was located in a small part of a much larger reserve with inadequate reservoir connection or that the lenticular reservoir sands could be much thicker elsewhere on the structure. However, wartime plans for the potential completion of Cousland-1 for production had projected that a normal rate of 500 thousand scf/d (14.0 thousand m3) could be obtained, with a maximum of 1 million scf/d (28.0 thousand m3) (Comins, 1942). In their evaluation of Licence PL177, LASMO concluded “the large variations in reservoir permeabilities that occur in sands over this field would necessitate a very low production rate to prevent the sands from watering out prematurely” (LASMO, 1985).
It was not until the end of 1956 that an agreement with Scottish Gas was finalised to exploit the Cousland gas (Adcock, 1957a). Cousland-1 had been temporarily plugged and abandoned in July 1951 but was re-entered in October 1956, the cement plugs drilled out and the 8 ¾ inch casing re-perforated in only the Upper Sand of the 1,582 ft zone interval 1,575–1,605 ft MD (307.8–317.0 m subsea) before being tested in November 1956 (Adcock, 1957b). Following successful tests, the site was prepared for production and export, with first gas sales taking place in January 1958, following which steady long-term production then took place until the well was shut-in in April 1965 (Figure 12) The gas was piped to the Musselburgh coal gasification works to increase the calorific value of town gas. Production averaged some 84 thousand scf/d (2.4 thousand m3/d) over a 7 years period between January 1958 to the point that the well was shut-in when the Musselburgh plant closed in April 1965, with a maximum of an average of 145 thousand scf/d (4.1 thousand m3/d) in December 1960. No water production was reported. However, as noted below, the build-up of wellhead pressures measured in the 27 months following cessation of production indicated that edge-water influx had taken place into the reservoir.
The area of the OILEX closure, assuming a gas-water contact at 1,110 ft subsea (338.3 m subsea), is 0.443 km2, which is consistent with the area of 0.407 km2 determined by a plot of the effective radius of the gas reservoir produced by LASMO (1985), using data from a BGC study (Ford, 1969: extracts included in LASMO, op.cit.). This area is also comparable in size to that of BP’s estimated closure at 1582 ft level after the drilling of Cousland-6 shown in Figure 10B (see also Figure 6).
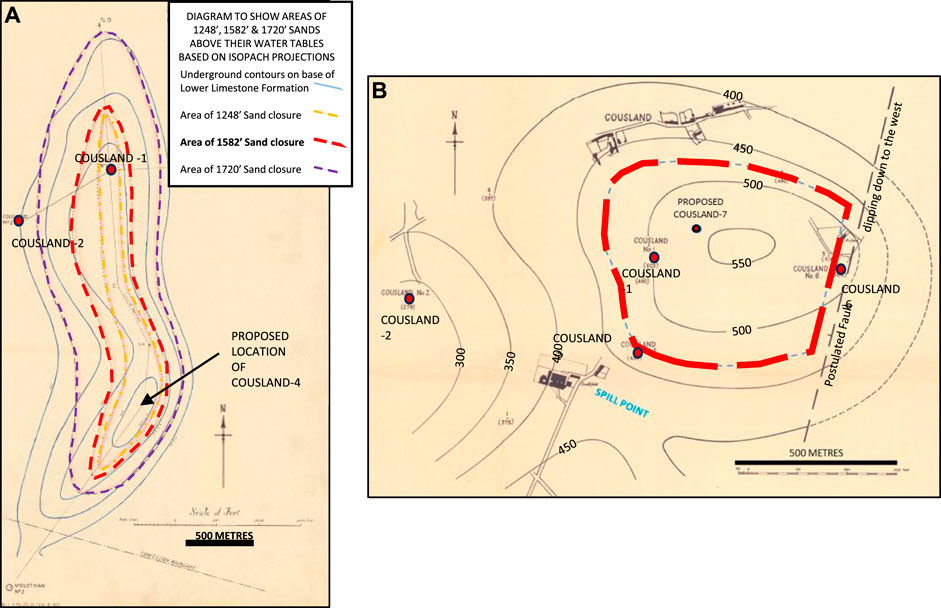
FIGURE 10. BP mapping of Cousland accumulation, based solely on well and borehole information (no seismic data used): (A) After drilling of Cousland-1, -2 and -3. Red dashed line shows projected area of closure at 1,582 ft sand level (Falcon, 1941—key redrawn) (B). Revised interpretation after drilling Cousland-5 (Jones, 1954), based on mapping the structure of a near-surface marker within Lower Limestone Formation (contours are in feet above sea level) and projecting the closure down to the 1,582 ft level. The fault dipping down to the west was added at Lower Limestone Formation level after the drilling of Cousland-6 (Terris, 1960). Dashed red line shows projected area above the gas-water contact of 1,110 ft (338.3 m) subsea, assuming conformity of structure at the 1,582 ft sand level and with the fault projected down to the gas-water contact. Note difference in scale between (A) and (B).
Ford’s computations were based purely on production and pressures and used the 221 million scf (6.2 million m3) produced between January 1958 and April 1965, when the well was shut-in, plus the build-up over an 832 days period after shut-in. These indicated a range of GOIP connected to the producing 1,582 ft reservoir as follows:
804 million scf (22.5 million m3) assuming no water influx;
532 million scf (14.9 million m3) assuming water influx (first case);
619 million scf (17.3 million m3) assuming water influx (second case); and
547 million scf (15.3 million m3) using unsteady state computations.
The 547 million scf case was used by LASMO. Adcock (1957b) noted that 32.0 million scf (907 thousand m3) had been produced from the 1,582 ft reservoir zone in Cousland-1 during the initial open-hole testing at rates up to 3.5 million scf/d (98 thousand m3/d), test production through casing at a steady 1 million scf/d (28 thousand m3/d) during 1939/40 and test production in 1956 while preparing the well for production. The amount of 32.0 million scf (907 thousand m3) should therefore be added to the above BGC figures, increasing the historic production from 221 million scf (6.2 million m3) to 253 million scf (7.1 million m3). Adding in the 32 million scf increases the above case to GOIP of 579 million scf (16.2 million m3). However, it should be noted that the well was only perforated for production from the Upper Sand body of the 1,582 ft zone and some of the gas produced during 1939/40 would probably have come from the Lower Sand body (see Figure 7). It is unclear whether a barrier exists between the Upper and Lower Sand bodies in the 1,582 ft zone, but Adcock (1957a) recommended not perforating the Lower Sand to allow any water coning and rise of the general level of the water table as a result of gas production from the Upper Sand to fill the Lower Sand before breakthrough occurred into the Upper Sand.
Analysis of the average reservoir permeability, estimated at 17 mD from well test data, which compares with 25 mD calculated from 1939 production tests by Keep (1959), and the 10 psi build-up of wellhead pressures over the 832 days period following the cessation of production suggested that some 2.2 million ft3 (62 thousand m3) of water influx, calculated by Ford to be equivalent to 75.2 million scf (2.1 million m3) of gas, had occurred into the producing reservoir since first commercial production in 1958, although none had been produced at the low gas production rates utilised (Ford, 1969). These figures enabled the computation of an effective gas reservoir radius of 1,180 ft (359.6 m), shown superimposed on the OILEX structure map in Figure 11B. The measurement of 400 psi wellhead pressure quoted by Martin (1974) when finally abandoning the Cousland-1 wellsite is at odds with the measurements made by BGC up to 1967 both before and after cessation of production (Figure 12; Ford, 1969), which indicated a final wellhead shut-in pressure of 459 psi and a 10 psi rise in shut-in pressure after the well was shut-in, and may have been due to a small leak in the wellhead or casing.
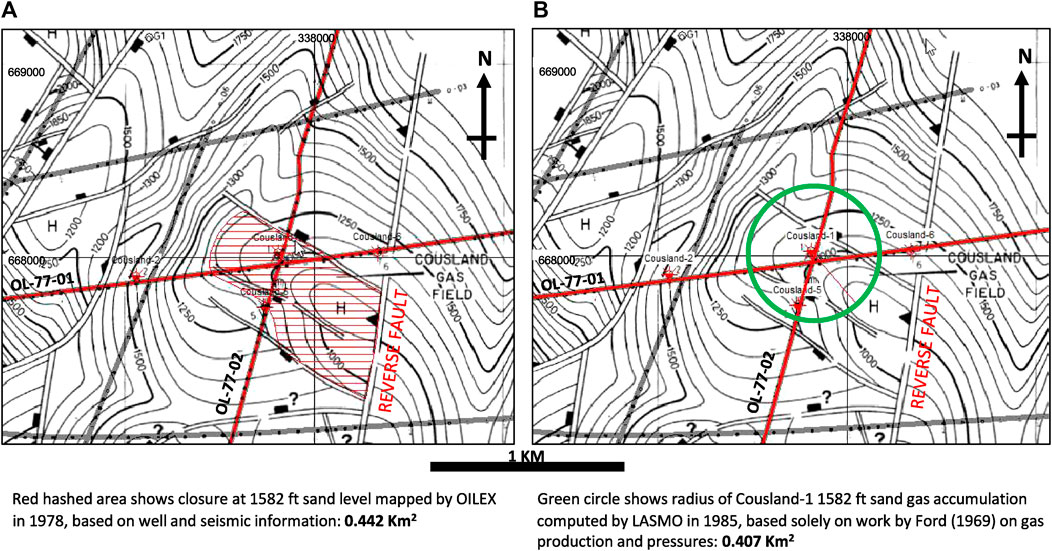
FIGURE 11. Depth structure map in feet subsea on 1,582 ft sand level generated by OILEX (LASMO, 1985) using wells and the poor quality 1977 seismic reflection data. Gas-water contact is at 1,110 ft subsea. Contour interval 50 ft (15.2 m). Red lines show the locations of the seismic lines in Figure 13, other seismic lines shown in grey. The reverse fault mapped immediately east of Cousland- 6 (see also Figure 13) is a possible extension of the reverse fault picked on Figure 3 (LASMO, 1985, Encl.4). (A) Shows the mapped area of closure in red; (B) shows the computed radius of the 1,582 ft accumulation in green, based solely on production and pressure information (from Ford, 1969), superimposed on the depth structure map.
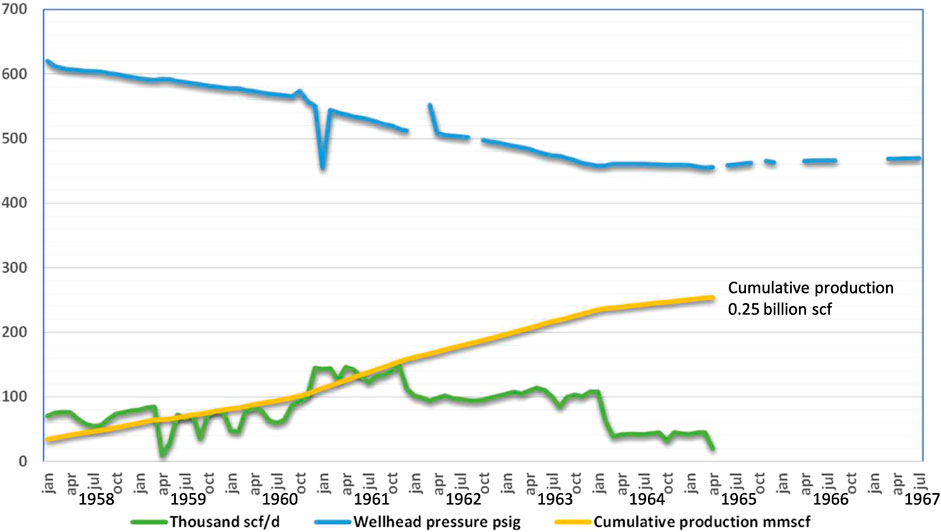
FIGURE 12. Cousland-1 average daily production from 1,582 ft zone by month, in thousand scf, cumulative production in million scf and end-month wellhead pressure in psig, showing build-up after well shut in. Data taken from monthly production reports tabulated by LASMO (1985).
Previous Subsurface Storage Evaluations
A BP report on gas storage potential in the Cousland-1 area (Adcock, 1954c) noted that an injection pressure of 1,200 psi (equivalent to a bottom hole pressure of 1,250 psi) would be necessary to inject gas into the 1,582 ft reservoir at the 3 million scf/d (85 thousand m3/d) flow rate achieved on open hole test in 1939 (note that the mud weight used to drill through the 1,582 ft sand was 9.8 pounds per gallon, equivalent to 806 psi at that depth). The 1954 report also commented that a significant increase in gas stored could be achieved if the reservoir pressure were to be increased to a level which caused the gas-water contact to be lowered, but that it would not be advisable to do this if the reservoir were initially full to spill point (the drilling of Cousland-5 that year demonstrated that this was a possibility).
A more wide-ranging study carried out by BP for the Scottish Gas Board (Adcock, 1961) envisaged storing 400 million scf (11.3 million m3) of town gas from the Westfield plant in Fife in the 1,582 ft reservoir of Cousland-1 during the summer and producing it during the winter, cycling 800 million scf (22.7 million m3) annually. In order to first deplete the existing natural gas and purge the reservoir, it was suggested 100 million scf (2.8 million m3) per year (274 thousand scf/d or 8 thousand m3/d) be produced in 1962 and 1963, increasing to 300 million scf (8.5 million m3) in 1964 (822 thousand scf/d or 23 thousand m3/d). Town gas would then be pumped into the reservoir at 2.5 million scf/d (71 thousand m3/d), using a 750 psi compressor. Plans were also made to drill well Cousland-7 on what BP and Scottish Gas considered to be the crest of the 1,582 ft accumulation, some 183 m northeast of Cousland-1 (Figures 6, 10). If, as expected, this well was found to be productive in both the 1,582 ft and 1,720 ft reservoirs, each would be depleted rapidly, and the reservoirs turned to town gas storage. Note that it was deemed essential that all of the natural gas be produced first to avoid changing the composition of the stored town gas (Adcock, 1961). However, residual natural gas would still be trapped in low permeability zones of this heterogenous reservoir.
However, the rather detailed analyses of the storage potential made very simple assumptions about the reservoir parameters and did not include any work on the integrity of the seal. In the 1961 study, these were: 15% average porosity, 50% gas saturation in the porosity and 25 mD average permeability. The thickness of the 1,582 ft producing zone was assumed to be a uniform net 30 ft (9.14 m), based on the perforated Upper Sand interval, and that of the 1,720 ft zone was assumed to be a net 70 ft (21.33 m), based on the net sand in Cousland-1. The structural and reservoir quality implications of the results of Cousland-6 gave rise to concern and the Gas Board’s consultants warned that “in the cores of No. 6 there was a considerable amount of slumping and cross-bedding in the formations, which is indicative of conditions of deposition liable to involve rapid lateral variations in the formations. The problem at Cousland is largely a question of the lateral continuity of the sandy formations over the structure and is affected by the original and secondary lateral variations in the porosity of the sands, as well as the possibility of structural deformation” (Illing, 1961). These depositional features are well seen in the coastal exposures of sands of similar age and facies, c.15 km to the north-east at Gullane (Figure 5).
In 1966 the Gas Council requested core material from the Cousland wells in connection with the gas storage studies. Unfortunately, no cores were available in BP’s Eakring storage for Cousland-1, -2, -3, or -4 and only record pieces, taken at 1 ft intervals within the cored zones, were available for Cousland-5 and -6 (Adcock, 1966). Enquiries of the BGS indicate that cores are currently held in store for the zones of interest in Cousland-1 but not Cousland-2 or -5. In the event, no gas storage project was begun.
Recent Proposals to Utilise Cousland Anticline for Hydrogen Storage
Heinemann et al. (2018) proposed the Cousland Anticline as a suitable site for hydrogen storage, noting that “the best gas-bearing sandstone was tested at 5.9 Mft3 (167,000 m3) per day” volumetrically equivalent to an approximate production of 13.2 tonnes per day of Hydrogen. This presumably relates to the 1,720 ft zone in Cousland-1, which was not put on production because of water ingress. They noted that a capacity estimation for hydrogen storage, using their figure of 330 million scf (9.2 million m3) volume of natural gas produced from the Cousland field during the 10 years of production, would be equivalent to a total of approximately 700 tonnes of hydrogen.
Scafidi (2022) carried out detailed analysis of the hydrogen storage potential of the 1,582 ft reservoir zone in the Cousland field, on the basis that it would be used for seasonal storage, and concluded that the field “could potentially store and recover close to 1,000 tonnes of hydrogen without significant losses over 20 years” However, as was the case in the 1961 BP/BGC study (Adcock, 1961), it was necessary to use a simplistic geological model, assuming a uniform sand of varying thickness with no risk to the lateral or vertical seals. Scafidi based much of his modelling on the existing natural gas storage site in Westphalian sands at Hatfield Moors (Ward et al., 2003 and Edinburgh Oil and Gas plc, 1999), which had an initial 6.1 billion scf (173 million m3) of gas in place, porosities in the range of 17.2%–25.6% and permeabilities in the range of 21–1,100 mD (Ward’s Table 12). The 11 wellbores drilled in and around this field demonstrated the presence of natural gas in a single, uniform fluvial sand body, varying in thickness from 30 to over 90 ft (9.1 to over 27.4 m) in two faulted anticlines defined by well and seismic information. No oil has been encountered.
In the case of Cousland, the nature and shape of the trap is unknown (the radically different maps in Figures 10B, 11 each honour the top of the 1,582 ft sand in the wells drilled at the time they were made) and there are only two penetrations of well-developed sands at the 1,582 ft level, albeit with substantial variations between them in the Upper Sand body from which production was obtained (Figure 9). In the absence of definitive information on the structure and the distribution of individual sand bodies across the feature, the area of closure was based by Scafidi on the Lower Limestone Formation mapping of Figure 10B. Despite including sonic porosities and core information from Stewart-1 and other wells in the Midlothian area to the south, no reliable trends were able to be derived. Hence, the assumption was made that the 1,582 ft zone could be considered as a single sand type, ranging in gross thickness from 8 ft (2.4 m) in Cousland-2–50 ft ((15.2 m) in Cousland-1 and 67 ft (20.4 m) in Cousland-5, and porosity trends were determined by comparison between known core data and shale percentage (Vshale) from Gamma Ray (GR) log analysis, there being no porosity logs available from the Cousland wells. No-flow shale interbeds were defined by a 40% Vshale cut-off from GR log analysis, which was used to define a base net:gross ratio of 60% for the 1,582 ft sands. However, as Figure 7 shows, oil-soaked, low permeability sands and sand/shale interbeds within the 1,582 ft package of Cousland-1 have GR readings that would lie on the net sand side of a simplistic 40% Vshale cut-off and, if used to define porosity, would produce erroneous results. Permeability vs. porosity trends from core information in Cousland-1, -2, -4 and -5 differed significantly between the wells. The trend from Cousland-5 was used in the analysis, such that 15% porosity equated to about 100 mD and 10% porosity to about 1 mD, although the trend from Cousland-1 was very different and Scafidi considered this may have been affected by fracturing.
In the absence of any detailed information on the depositional environment, Scafidi assumed that the sand bodies all had a simple N-S trend and came to a similar figure for GOIP as did Ford (1969): 870 million scf (24.6 million m3), against Ford’s figure of 836 million scf (23.7 million m3) adding in test production and assuming no water influx. However, Ford used 27 readings of the pressure build-up from April 1965, when Cousland-1 was shut-in, to July 1967 (Figure 12) to determine the presence of an active water leg, reducing his adjusted figure of GOIP to 579 million scf (16.4 million m3). Although Scafidi (2022, Figure 57) showed these readings, his GEM simulator ignored them. He assumed that there had been no water influx and that the 1,582 ft reservoir zone could be considered volumetric, with no aquifer drive, which led him to apply a multiplier of 1.32 to the porosity derived from his geological model to match the GOIP estimate underpinning much of his analysis. He also applied a multiplier of 2.33 to the permeability of 30.9 mD determined for the Cousland-1 area in his model to bring the average up to the 71.9 mD indicated by the semi-log plot in his reservoir engineering study, compared to the permeabilities from well test production determined by earlier workers of 17 mD (Ford, 1969) and 25 mD (Keep, 1959). Having made the assumption that the reservoir was volumetric, Scafidi treated the edges of the sand reservoir as no-flow boundaries without considering seal risk.
Scafidi derived his projections of injection/production rates based on Cousland being a volumetric reservoir, containing an original 0.87 billion scf (24.4 million m3) in place with no active water leg, using his inflated figures for porosity and permeability and taking Hatfield Moors, with 7 times the storage volume and multiple injection wellbores, as a model. Scafidi envisaged using a single injection/storage well and limiting injection well bottom hole pressure to a maximum of 90% of his calculated fracture pressure of 827 psi. In his Appendix 5, Scafidi gave the results of his calculations, which show plateau injection/production rates to be in the range of 5.7–6.1 million scf/d, with working gas in the range of 520–557 million scf and cushion gas in the range of 143–263 million scf. Even though Scafidi pointed out that the lower density of hydrogen may allow higher flow rates than those for methane, these figures for injection and production at sustained rates are significantly higher than those contemplated in previous analyses of Cousland Field by BP and BGC and rely on assumptions of reservoir physical parameters and gas in place that are inconsistent with earlier work and his own initial analyses. Note that Adcock (1954c) calculated that a downhole injection pressure of 1,250 psi would be necessary to inject gas into the 1,582 ft zone at the rate of 3 million scf/d achieved on open hole flow test in 1939. However, his later study (Adcock, 1961) suggested that 2.5 million scf/d of town gas could be injected using a 750 psi downhole pump once the existing natural gas had been fully produced (although residual gas would still be present, as noted above).
Re-Evaluation of the Suitability of the Cousland Anticline for Hydrogen Storage
Definition of the Structure and Monitoring the Reservoir
As described above, the Cousland Anticline has thus far proved very difficult to map using the existing database either in time or depth, as demonstrated by the failure of each of the BP/BGC appraisal wells and the poor quality of the OILEX seismic data. Defining and de-risking a potential storage volume will require not just an understanding of the distribution of net reservoir sands within the 1,582 ft zone and the integrity of the surrounding seals, by drilling new wells with modern logging suites, but also the ability to map the structure in depth using seismic data. At present, it is not possible to generate a map on the top of the 1,582 ft reservoir with any confidence and certainly impossible to resolve the reservoir layer on existing seismic reflection data (Figure 13). We would expect that any plans to utilise this productive reservoir zone in Cousland-1 for hydrogen storage would first require that the character, extent, and thickness of each of the reservoir sands and the sealing beds be mapped in detail, the orientation and throw of faults identified from well and seismic data be determined and the high point of the structure be clearly defined.
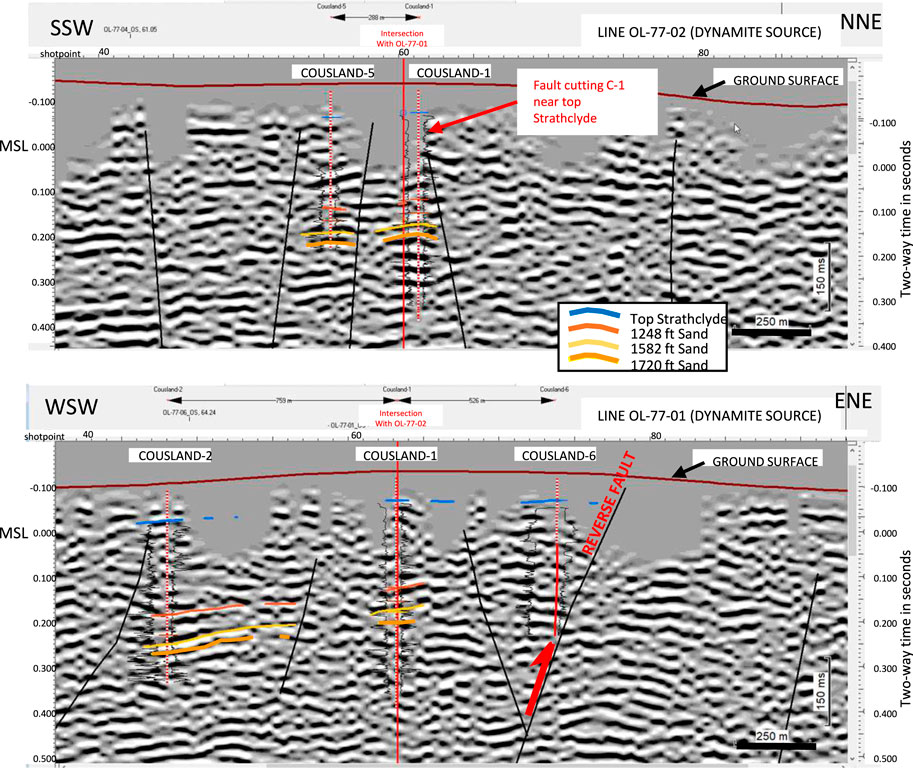
FIGURE 13. 1977 non-migrated seismic lines through Cousland-1 (from UKOGL). Faults are those picked by OILEX (LASMO, 1985). Picks of horizons have been attempted where consistent data is present near wells but note the difficulty in following events away from well control due to lack of confidence in tracing horizons and absence of higher frequencies. The interpretation generated by OILEX in Figure 11 is difficult to validate with these data. Gaps in near surface data were caused by inability to shoot dynamite in many areas and muting of noise. MSL, Mean Sea Level. For location of lines see Figure 6.
The shallow depth and the thin, discontinuous reservoir beds in the Cousland structure would necessitate the acquisition of new closely spaced, high-frequency 3D seismic reflection data with lateral and vertical resolution sufficient to map the reservoir, sealing beds and faults in detail. Ideally there should be the ability to repeat the recording at future dates to generate 4D data that could illustrate movement of hydrogen within the reservoir sands and any leakage into shallower levels. Unfortunately, as shown by the 1977 2D seismic survey, surface conditions will make it very difficult to record such data. Figure 6 demonstrates the known minimum extent of shallow limestone mining beneath the surface and other impediments in the areas of Cousland-1 and -2. The underground mining passages shown on Figure 6 were stated to be as close as 49 m to the Cousland-1 well bore in 1959 and an area of subsidence was noted 183 m northeast of the well (Burt, 1960). These workings continued up until 1970 and the affected area now surrounds the Cousland-1 site (Figure 6). The resulting subsurface voids will impede the transmission of seismic energy into the section of interest and distort the reflected rays, with consequent loss of high frequencies and reduction of resolution at reservoir level. Additionally, the built-up area of Cousland village will present difficulties in acquisition, particularly if geophones are to be left in place for 4D recording to satisfy the need to measure, monitor and verify (MMV) something that is a current regulatory requirement for an offshore subsurface store throughout its lifetime (North Sea Transition Authority, pers.comm., 2023).
The considerable body of work carried out to investigate plans for the storage of carbon dioxide (CO2) in depleted oil and gas fields provides examples of the methodologies that could be applied to hydrogen storage. These include the use of reflection seismic, electrical conductivity and gravity techniques for reservoir delineation and observation. There is now a body of published work on the Norwegian Sleipner Field (for example, Chadwick et al., 2009) that has demonstrated the ability to track the movement of CO2 within sediments deep below the seabed because the low density of the gas creates a low velocity zone in the transmission of induced seismic waves generated by 3D seismic surveys. Repeating the 3D surveys at intervals generates 4D data that demonstrate the movement of the gas in the subsurface over time. Pfeiffer et al. (2016) refer to examples of these technologies to investigate both CO2 and methane storage, including the successful imaging of small-scale leakage paths from a methane gas plume within the North Sea Valhall gas field with 3D acoustic Full-Waveform Inversion (“FWI”). However, there is little information on the use of these technologies to track the movement of hydrogen in sediments, although one would expect its very low density to generate a strong acoustic signal when compared with methane (the gas tested in Cousland-1 had a specific gravity of 0.623, or about 9 times that of hydrogen). FWI technology enables the resolution of thinner beds than conventional seismic processing (Berkhout, 2012) and work on the Sleipner Field (Rombdhane et al., 2014) demonstrated its use in a CO2 storage project. This may make it theoretically possible to trace hydrogen within the 1,582 ft sand in the Cousland Anticline and indicate any leakage from it, although modelling of a hypothetical subsurface porous media hydrogen storage reservoir (Pfeiffer et al., 2016) indicates that the Cousland reservoir sands are probably too thin to enable any detail to be resolved within the reservoirs and distinguish between natural gas and hydrogen-bearing zones. In any case, as noted above, it seems unlikely that seismic data with sufficient continuity and frequency to enable FWI processing could be recorded over a large part of the Cousland Anticline.
Health and Safety Issues
A build-up of natural gas is reported to have occurred in the Cousland lower underground mine workings when they were active and was pumped out to collection points north of Cousland-2 and northwest of Cousland-1 (Figure 6; Keith, 1989; Grampian Speleological Group, 2023). Cousland-1 encountered flows of water from sands at several levels down to 836 ft MD (254.8 m) without any trace of gas and Cousland-2 flowed gas-free water to surface from 1,530 ft MD (466.3 m), although a trace of gas was reported at around 1,400 ft MD (426.7 m). It seems likely that the gas encountered in the mine-workings was related to seepage along a fault, possibly that encountered in nearby limestone mines (Figure 6). This is supported by the fact that the seepage occurred down-dip from Cousland-1 according to BP’s detailed mapping of the shallow limestone horizon (Figures 6, 10B). Given this evidence suggesting gas leakage from deeper layers, there is a risk that unrecognised seepage of hydrogen out of underlying storage could build up in the underground workings and give rise to a substantial explosion. There is also the risk of collapse of mine workings beneath surface infrastructure, as took place in nearby Gilmerton in November 2000, when an initial 33 homes were demolished after collapsing and a further 189 homes were later demolished because of safety fears (McLean, 2020). Figure 6 demonstrates that part of the potential storage volume lies directly beneath the village of Cousland and the sensitivity of the local population to and hence public acceptance of such a development would be likely to present difficulties.
Reservoir Contamination
Results from tests on Cousland-1 and Cousland-5 indicated a reservoir temperature of 21°C, initial reservoir pressure of 42 bar (4.2 MPa), reservoir water salinity of 11,000 to 30,000 ppm and pH of between 7.3 and 8.0. The reservoir parameters described, the common presence of residual oil and the occurrence of iron pyrites (Falcon, 1941) may place the 1,582 ft reservoir zone in ideal conditions for geochemical and microbial reactions with hydrogen, including the formation of toxic hydrogen sulphide and additional methane (Thaysen et al., 2021, Heinemann et al., 2021). These reactions would not only reduce the quantity of hydrogen in storage but may also lead to the formation of biofilms, clogging pores and reducing permeability. Given the heterogenous nature of the reservoir, with a wide range of permeabilities (Figures 7, 9), and the fact that it will still contain natural gas, significant quantities of residual oil and irreducible water, it is likely that there will be a high proportion of impurities in any hydrogen stream drawn down from storage. At higher flow rates, bituminous oil and edge water can be expected.
Reservoir Conditions and Production Rates
Using hydrogen as an energy store to balance the intermittent nature of renewal energy generation is of particular interest in Scotland, which has very large potential for wind generation offshore. Excess electricity available when conditions are good for wind and solar generation would be used to convert fresh water to green hydrogen and oxygen by electrolysis (Heinemann et al., 2021) and the green hydrogen would be stored, to be withdrawn during periods when wind generation is low and used to power generators. Such a scheme requires large short-term swings between injections and withdrawals. The only existing underground porous media hydrogen storage facilities have been used to store Town Gas with a high hydrogen content and there is no published record of such short-term swings in usage. Modelling carried out by Huijskes and Eikelenboom (2020), using data derived by Gessel et al. (2018) for a hypothetical area in the Netherlands, demonstrates the rapid, high-volume swings between injection and withdrawal, of as much as 15% of the storage volume in a single day, that would be necessary to balance electricity supply from wind generation over a 1 year period. These rates would be equivalent to more than 78 million scf/d (2.12 million m3/d) at Cousland and it is highly unlikely that this field could ever achieve such large, short-term swings. Its use would have to be confined to seasonal storage, as envisaged by Scafidi (2022).
Modelling simulations on injecting and reproducing hydrogen from storage in heterogenous porous reservoirs with a methane or nitrogen cushion (Pfeiffer et al., 2016; Visser, 2020) indicate that large variations in porosity and permeability will cause differential production, leaving behind cushion gas within the hydrogen column. Such a reservoir can be expected to take a long time to reach conditions where there is a high percentage of pure hydrogen in the withdrawal stream, even with seasonal injection utilisation that would allow time for separation and stabilisation of the different gas volumes. One would expect this to be exacerbated by more rapid injection-withdrawal cycles.
The fact that the extent and thickness of the reservoir has not yet been mapped and is unlikely to be sufficiently well defined without significant further drilling would make attempting to store hydrogen in the Cousland gas field a very risky enterprise, even as an experimental test site. Further work would have to include evaluation of the seals, definition of the spill-point of the structure, the path that might be taken by any escaping hydrogen and a clear understanding of sustainable injection and production rates. The high, instantaneous flush production rates achieved on drill-stem testing of the 1,582 ft and 1,720 ft sands in Cousland were not sustained by production testing. The 1,720 ft sand began producing large volumes of water and was abandoned, on the assumption that it lay very close to the gas-water contact for that sand. Although the 1,582 ft zone was put on long-term test at 1 million scf/d (28 thousand m3/d) for up to 30 days during 1939 and 1941, a 1941 BP analysis considered that the 1,582 ft zone could safely produce 200 million scf (5.6 million m3), initially at 100 thousand scf/d (2.8 thousand m3/d) and up to 200 thousand scf/d (5.7 thousand m3/d) over a 5 years period, if there was edge water encroachment (Comins, 1941). Production rates were restricted to these levels when the well was finally put on-stream in 1958, although this seems to have been driven by demand levels rather than reservoir concerns. However, a later BP report (Adcock, 1960) noted that no reservoir water had been produced during the production of 74 million scf (2.1 million m3) of gas from October 1957 to October 1960. The report suggested that production from the 1,582 ft sand could be increased to 500 thousand scf/d (14 thousand m3/d) at a bottom hole differential pressure of 12 psi, without coning up of reservoir water. As noted above, the BGC report generated after production ceased made use of the pressure build-up after the well was shut-in, which continued for more than 2 years after that occurred and indicated that some 2.2 million cubic feet of water (61 thousand m3) had been drawn into the reservoir during the production period (Ford, 1969). This is assumed to relate to a gradual rise in the gas-water contact as gas was withdrawn, since no water was produced from the upper part of the reservoir zone.
Seal Integrity
A concern with injection and withdrawal at high rates in heterogenous porous reservoirs is the risk that the alternating changes in pressure would induce seismicity that could open up fracture systems and create cap-rock leakage (Verdon et al., 2011; Jiang et al., 2020; Bisdom, 2022). This is of particular concern, given the small size of the hydrogen molecule. Description of the cores on Cousland-6 (Taylor, 1960) indicated that most fractures were entirely sealed with calcite but a 4 mm wide porous fracture, that was inclined at 60° and partially filled by calcite and black tarry oil, was identified at 1,496 ft (456 m) MD. Analysis of permeability trends in Cousland-1 (Scafidi, 2022) indicated the possible presence of fractures. As noted earlier, fault zones have been postulated in Cousland-1 and -6 and Figure 3 indicates the possibility of, as yet unrecognised, faulting within the Cousland Anticline. In this context, the suggestion by Falcon (1941), noted earlier, that the Cousland Anticline had hosted an earlier accumulation of oil that had been breached, should be examined. The possibility of fracturing would require detailed investigation and monitoring in the Cousland area and would be likely to place limits on short-term pressure swings at the relatively shallow reservoir depths, further reducing injection and withdrawal rates.
Conclusions
Analysis of the large volume of historic data available on the Cousland gas field raises serious questions about its suitability as a site for hydrogen storage. Using the data that is currently available, it is very difficult, if not impossible, to map the extent of the known gas reservoir sands, which will have a knock-on effect on the ability to monitor the movement of both hydrogen and natural gas. The presence of a maze of near-surface mine workings over a large part of the potential storage area not only exacerbates the difficulty in acquiring any new useable seismic data but also poses a risk of forming a collection area for small volumes of undetected hydrogen leakage, with the potential for gas build up and explosion close to the surface.
The reservoir temperatures and pressures that exist in the Cousland structure are such that chemical reactions between hydrogen and residual hydrocarbons and iron minerals in the reservoir could create toxic hydrogen sulphide and pore-plugging substances. Given that there will be a large volume of natural gas remaining in the Cousland reservoir sands, this would most likely be used as cushion gas. Production of hydrogen can be expected to initially be associated with large percentages of natural gas, which would mitigate against the use of fuel cells to generate electricity without refining of the produced fuel stream. Computations on the potential for hydrogen storage in Cousland that begin by treating the 1,582 ft zone as if it were a simple, closed container make a very risky assumption.
Although the Cousland gas field might in theory form an interesting test-bed in which to study the behaviour of hydrogen injection into a heterogenous clastic reservoir with a substantial in-place natural gas cushion and residual oil, the significant and serious problems inherent in defining, mapping and monitoring the constituent sands of the reservoir zones, their seals and the movement of gases within them make this a dangerous proposition and its use as a underground storage site is discouraged.
Data Availability Statement
Publicly available datasets were analyzed in this study. This data can be found here: https://ukogl.org.uk/map/?e=-603878,7387583,-97559,7648998&l=1431655685,0,0&f=14,608,-260217,7538928&b=3&sm=true.
Ethics Statement
Written informed consent was obtained from the individual for the publication of any potentially identifiable images or data included in this article.
Author Contributions
Conceptualization: MB 10% and JU 90%. Data curation: MB 90% and JU 10%. Formal analysis: MB 80% and JU 20%. Investigation: MB 80% and JU 20%. Methodology: MB 50% and JU 50%. Writing and composition: MB 50% and JU 50%. All authors contributed to the article and approved the submitted version.
Conflict of Interest
The authors declare that the research was conducted in the absence of any commercial or financial relationships that could be construed as a potential conflict of interest.
Publisher’s Note
All claims expressed in this article are solely those of the authors and do not necessarily represent those of their affiliated organizations, or those of the publisher, the editors and the reviewers. Any product that may be evaluated in this article, or claim that may be made by its manufacturer, is not guaranteed or endorsed by the publisher.
Acknowledgments
The authors have benefitted greatly from open access to the well, seismic and other records collected and archived by the UK Onshore Geophysical Library (UKOGL). JU’s contributions to the project were supported by the Centre for Energy Transition at Aberdeen University. The authors would like to thank the members of the Grampian Speleological Group for their assistance in researching the history and extent of mining in the Cousland area. They also thank Thomas Houghton and Rifky Wijanarko in the Energy Transition Laboratory at the University of Aberdeen for their help in producing the topographic image in Figure 2 and Arc GIS Pro for access to an academic license. British Geological Survey staff are thanked for providing information on the availability of Cousland cores. The Reviewers, RS and CL are thanked for their helpful and constructive comments.
References
Adcock, C. M. (1947). Cousland No.4 Well – Report on Formation Tests Carried Out Whilst This Well Was Drilling. Released BP Internal Report, August 1947. Available at: https://ukogl.org.uk/map/php/files.php/?subfolder=well_reports&filename=01+-+Exploration+Wells%2FCOUSLAND+4%2FCOUSLAND+4_Petroleum+Engineering+File.pdf (Accessed October 15, 2023).
Adcock, C. M. (1954a). Cousland Area – Correlation Report in BP Cousland 5/W48 Petroleum Engineering Completion Report. Released BP Internal Report, July 1954. Available at: https://ukogl.org.uk/map/php/files.php/?subfolder=well_reports&filename=01+-+Exploration+Wells%2FCOUSLAND+5%2FCOUSLAND+5_Petroleum+Engineering+Completion+Report.pdf (Accessed October 15, 2023).
Adcock, C. M. (1954b). Cousland Gas Reserves. Released BP Internal Report, 8 October 1954. Available at: https://ukogl.org.uk/map/php/files.php/?subfolder=well_reports&filename=01+-+Exploration+Wells%2FCOUSLAND+1%2FCOUSLAND+1_General+Field+File+1.pdf (Accessed October 15, 2023).
Adcock, C. M. (1954c). Underground Storage of Gas at Cousland. Released BP Internal Report, 20 December 1954. Available at: https://ukogl.org.uk/map/php/files.php/?subfolder=well_reports&filename=01+-+Exploration+Wells%2FCOUSLAND+1%2FCOUSLAND+1_General+Field+File+1.pdf (Accessed October 15, 2023).
Adcock, C. M. (1957a). Production Scheme for Cousland No.1 Well. Released BP Memorandum, January 1957. Available at: https://ukogl.org.uk/map/php/files.php/?subfolder=well_reports&filename=01+-+Exploration+Wells%2FCOUSLAND+1%2FCOUSLAND+1_General+Field+File+1.pdf (Accessed October 15, 2023).
Adcock, C. M. (1957b). Cousland No.1 Well. Report on Putting the Well Back to Production From the 1582 – 1643 Gas Sand. Released BP Internal Report, 01 January 1957. Available at: https://ukogl.org.uk/map/php/files.php/?subfolder=well_reports&filename=01+-+Exploration+Wells%2FCOUSLAND+1%2FCOUSLAND+1_Production+Engineering+File+2.pdf (Accessed October 15, 2023).
Adcock, C. M. (1960). Natural Gas Production from the Cousland and Fordel Mains Structures - Assessment of the Gas Production Before Depleted Wells are Available for Storage. Released BP Internal Report, November 1960. Available at: https://ukogl.org.uk/map/php/files.php/?subfolder=well_reports&filename=01+-+Exploration+Wells%2FCOUSLAND+1%2FCOUSLAND+1_General+Field+File+4.pdf (Accessed December 14, 2023).
Adcock, C. M. (1961). Cousland Gas Production/Gas Storage Project – Tentative Scheme. Released BP Internal Report, March 1961. Available at: https://ukogl.org.uk/map/php/files.php/?subfolder=well_reports&filename=01+-+Exploration+Wells%2FCOUSLAND+1%2FCOUSLAND+1_General+Field+File+1.pdf (Accessed December 14, 2023).
Adcock, C. M. (1966). Underground Gas Storage. Released Letter to Gas Council, 29 December 1966. Available at: https://ukogl.org.uk/map/php/files.php/?subfolder=well_reports&filename=01+-+Exploration+Wells%2FCOUSLAND+1%2FCOUSLAND+1_General+Field+File+1.pdf (Accessed October 15, 2023).
Aldbrough Hydrogen Storage (2023). Storing the Humber’s Low Carbon Hydrogen. Public Consultation. Available at: https://www.aldbroughhydrogen.com (Accessed November 29, 2023).
Berkhout, A. J. (2012). Combining Full Migration and Full Waveform Inversion, a Glance into the Future of Seismic Imaging. Geophysics 77, S43–S50.
Bisdom, K. (2022). “A New Paradigm for Flow Through Faults and Fractures in the Context of Geoenergy,” in EGU General Assembly 2022, Vienna, Austria, 23-27 May 2022. EGU22-3552.
Booth, M., Underhill, J. R., Gardner, A., and McLean, D. (2020). Sedimentary and Tectonic Controls on Lower Carboniferous (Visean) Mixed Carbonate-Siliciclastic Deposition in NE England and the Southern North Sea: Implications for Reservoir Architecture. Pet. Geosci. 26 (2). doi:10.1144/petgeo2019-101
Brackenridge, R. E., Underhill, J. R., Jamieson, R., and Bell, A. (2020). Structural and Stratigraphic Evolution of the Mid North Sea High Region of the UK Continental Shelf. Pet. Geosci. 26, 154–173. doi:10.1144/petgeo2019-076
Brackenridge, R. E., Russell, L. J., Hartley, A. J., Watson, D., and Houghton, T. D. (2023). Late Permian Evaporite Facies Variation in the Forth Approaches Basin, North Sea: Implications for Hydrogen Storage. Geoenergy 1, 1–16. doi:10.1144/geoenergy2023-008
Browne, M. A. E., Dean, M. T., Hall, I. H. S., McAdam, A. D., Monro, S. K., and Chisholm, J. I. (1999). A Lithostratigraphical Framework for the Carboniferous Rocks of the Midland Valley of Scotland. British Geological Survey Research Report, RR/99/07.HMSO, London.
Burt, A. S. (1960). Letter Enclosing Copy of Map Showing Limestone Mine Workings and Area of Subsidence. Released BP Internal Correspondence. Available at: https://www.aap.org/sections/perinatal/NCE08/TheRole2.pdf (Accessed December 14, 2023).
Cartwright, J., Stewart, S., and Clark, J. (2001). Salt Dissolution and Salt-Related Deformation of the Forth Approaches Basin, UK North Sea. Mar. Petroleum Geol. 18 (6), 757–778.
Chadwick, R. A., Arts, R., Bentham, M., Eiken, O., Holloway, S., Kirby, G. A., et al. (2009). “Review of Monitoring Issues and Technologies Associated With the Long-Term Underground Storage of Carbon Dioxide,” in Underground Gas Storage - Worldwide Experiences and Future Development in the UK and Europe. Editors D. J. Evans, R. A. Chadwick, and R. A. Geological Society (London: Special Publications) 313, 257–275. doi:10.1144/SP313.150305-8719/09
Comins, D. (1941). Cousland Gas Exploitation. Released BP Internal Report. Available at: https://ukogl.org.uk/map/php/files.php/?subfolder=well_reports&filename=01+-+Exploration+Wells%2FCOUSLAND+1%2FCOUSLAND+1_General+Field+File+2.pdf (Accessed October 15, 2023).
Comins, D. (1942). Cousland: Gas Production Scheme. Released BP Internal Report. Available at: https://ukogl.org.uk/map/php/files.php/?subfolder=well_reports&filename=01+-+Exploration+Wells%2FCOUSLAND+1%2FCOUSLAND+1_General+Field+File+3.pdf (Accessed October 15, 2023).
Comins, D. (1949). Letter to Scottish Oils Ltd. 9 February 1949. Released BP Internal Report. Available at: https://ukogl.org.uk/map/php/files.php/?subfolder=well_reports&filename=01+-+Exploration+Wells%2FCOUSLAND+1%2FCOUSLAND+1_General+Field+File+1.pdf (Accessed October 15, 2023).
Craig, J., and Underhill, J. R. (2019). “Archibald Geikie’s Role in the Establishment of the Scottish Oil Shale Industry,” in Aspects of the Life and Works of Archibald Geikie. Editors J. Betterton, J. Craig, J. R. Mendum, J. Tanner, and J. Geological Society (London: Special Publications), 480, 379–399.
Day, T. C. (1914). Notes on the Hummell Rocks, Gullane. Trans. Edinb. Geol. Soc. 10, 114–119. doi:10.1144/transed.10.2.114
Dickie, R. K. (1939). Note on Packer Test From 2021 to 2120 Feet in Cousland No.2 and Possible Pressure Equilibrium With Cousland No.1. Released BP Internal Report. Available at: https://ukogl.org.uk/map/php/files.php/?subfolder=well_reports&filename=01+-+Exploration+Wells%2FCOUSLAND+2%2FCOUSLAND+2_Petroleum+Engineering+File.pdf (Accessed October 15, 2023).
Edinburgh Oil and Gas plc (1999). Hatfield Moors. Addendum to Annex B. May 1999. Released Report. Available at: https://ukogl.org.uk/map/php/files.php/?subfolder=industry_reports&filename=40899.pdf (Accessed October 15, 2023).
Falcon, N. L. (1941). Cousland Geological Completion Report. Released BP Internal Report on Wells 1 to 3. Available at: https://ukogl.org.uk/map/php/files.php/?subfolder=well_reports&filename=01+-+Exploration+Wells%2FCOUSLAND+1%2FCOUSLAND+1_Geological+Completion+Report+C1+to+C3.pdf (Accessed October 15, 2023).
Fesmire, J. E., and Swanger, A. (2021). Overview of the New LH2 Sphere at NASA Kennedy Space Center. DOE/NASA Advances in Liquid Hydrogen Storage Workshop, Virtual, August 2021. Available at: https://www.energy.gov/eere/fuelcells/advances-liquid-hydrogen-storage-workshop (Accessed October 15, 2023).
Ford, M. E. (1969). Report on the Performance Characteristics and Remaining Gas Reserves of the Cousland No.1 Well. Extracts From Report Produced for British Gas Corporation Included in LASMO (1985).
Forsyth, I. H., and Chisholm, J. I. (1977). The Geology of East Fife. Meemoir of the Geological Survey of Great Britain. Sheet 41 and Part of 49 (Scotland). London: HMSO.
Gessel, S. F. V., Breunese, J., Juez Larré, J., Huijskes, T. D., and Remmelts, G. (2018). Ondergrondse Opslag in Nederland - Technische Verkenning, TNO-Rapport R11372, 1 November 2018.
Grampian Speleological Group (2023). Cousland Limestone Mine (Upper Quarry)[1]. Scottish Cave and Mine Database. Available at: https://registry.gsg.org.uk/sr/registrysearch.php (Accessed October 15, 2023).
Hallett, D., Durant, G. P., and Farrow, G. E. (1985). Oil Exploration and Production in Scotland. Scott. J. Geol. 21, 547–570.
Heinemann, N., Booth, M. G., Haszeldine, R. S., Wilkinson, M., Scafidi, J., and Edleman, K. (2018). Hydrogen Storage in Porous Geological Formations – Onshore Play Opportunities in the Midland Valley (Scotland, UK). Int. J. Hydrogen Energy 43, 20861–20874.
Heinemann, N., Alcade, J., Miocic, J. M., Hangx, S. J. T., Kallmeyer, J., Ostertag-Henning, C., et al. (2021). Enabling Large-Scale Hydrogen Storage in Porous Media – The Scientific Challenges. Energy Environ. Sci. 14, 853–864.
House of Commons Science and Technology Committee (2022). The Role of Hydrogen in Achieving Net Zero. Fourth Report of Session 2022–23. London: HMSO. 85pp.
Huijskes, T., and Eikelenboom, W. (2020). “Hydrogen Storage in Depleted Gas Fields – First Insights From Conceptual Reservoir Modelling,” in 1st Geoscience & Engineering in Energy Transition Conference, Strasbourg, France, 16-18 November 2020.
Illing, V. C. (1961). Letter to British Petroleum on Cousland-6 Core Studies. Released Document. Available at: https://ukogl.org.uk/map/php/files.php/?subfolder=well_reports&filename=01+-+Exploration+Wells%2FCOUSLAND+1%2FCOUSLAND+1_General+Field+File+1.pdf (Accessed October 15, 2023).
Jiang, G., Qiao, X., Wang, X., Lu, R., Liu, L., Yang, H., et al. (2020). GPS Observed Ground Extension at the Hutubi (China) Underground Gas Storage Facility and its Application to Geomechanical Modelling for Induced Seismicity. Earth Planet. Sci. Lett. 539, 115943. ISSN 0012-821X. doi:10.1016/j.epsl.2019.115943
Jones, W. D. V. (1954). “A Note on the Cousland Area,” in Cousland No. 5 Completion Report. Released BP Internal Report. Editor W. A. H. Keenlyside Available at: https://ukogl.org.uk/map/php/files.php/?subfolder=well_reports&filename=01+-+Exploration+Wells%2FCOUSLAND+5%2FCOUSLAND+5_Well+Completion+Report.pdf (Accessed October 15, 2023).
Keenlyside, W. A. H. (1954). Cousland No.5 Completion Report. Released BP Internal Report. Available at: https://ukogl.org.uk/map/php/files.php/?subfolder=well_reports&filename=01+-+Exploration+Wells%2FCOUSLAND+5%2FCOUSLAND+5_Well+Completion+Report.pdf (Accessed October 15, 2023).
Keep, K. R. (1959). A Study of the Feasibility of Seasonal Gas Storage in the Cousland Reservoir. Released BP Internal Report. Available at: https://ukogl.org.uk/map/php/files.php/?subfolder=well_reports&filename=01+-+Exploration+Wells%2FCOUSLAND+1%2FCOUSLAND+1_General+Field+File+3.pdf (Accessed October 15, 2023).
Keith, J. A. (1989). In Search of Old Gasworks: A Survey of Gas Undertakings in Scotland. Edinburgh, 30. RCAHMS Shelf Number: J.5.14.KEI Available at: http://registry.gsg.org.uk/sr/sitedetails.php?id=5005 (Accessed October 15, 2023).
Kent, P. E. (1947). Correspondence in Cousland No.4 Well File. Released Letters. Available at: https://ukogl.org.uk/map/php/files.php/?subfolder=well_reports&filename=01+-+Exploration+Wells%2FCOUSLAND+4%2FCOUSLAND+4_General+Well+File.pdf (Accessed October 15, 2023).
LASMO (1985). UK Onshore Licence PL177: Evaluation of the Remaining Hydrocarbon Prospects. Released Report. Available at: https://ukogl.org.uk/map/php/files.php/?subfolder=industry_reports&filename=41362.pdf (Accessed October 15, 2023).
Lees, G. M., and Cox, P. T. (1937). The Geological Basis of the Present Search for Oil in Great Britain by the D’Arcy Exploration Company, Ltd. Q. J. Geol. Soc. 93 (1–4), 156–194. doi:10.1144/GSL.JGS.1937.093.01-04.09
Lees, G. M., and Taitt, A. H. (1945). The Geological Results of the Search for Oilfields in Great Britain. Q. J. Geol. Soc. 101 (1–4), 255–317. doi:10.1144/GSL.JGS.1945.101.01-04.12
Lees, G. M. (1946). Letter to A.H.Taitt. Released BP Correspondence. Available at: https://ukogl.org.uk/map/php/files.php/?subfolder=well_reports&filename=01+-+Exploration+Wells%2FCOUSLAND+1%2FCOUSLAND+1_General+Field+File+1.pdf (Accessed October 15, 2023).
Loftus, G. W. F., and Greensmith, J. T. (1988). “The Lacustrine Burdiehouse Limestone Formation – A Key to the Deposition of the Dinantian Oil Shales of Scotland,” in Lacustrine Petroleum Source Rocks. Editors A. J. Fleet, K. Kelts, and M. R. Talbot (Geological Society, London. Special Publications), 40, 219–234.
Martin, D. L. (1974). Note for Record. Cousland No.1 Well Abandonment. Released Internal Report. Available at: https://ukogl.org.uk/map/php/files.php/?subfolder=well_reports&filename=01+-+Exploration+Wells%2FCOUSLAND+1%2FCOUSLAND+1_Petroleum+Engineering+File+2.pdf (Accessed October 15, 2023).
McAdam, A. D., and Tulloch, W. (1985). “Geology of the Haddington District: Memoir for 1:50,000 Sheet 33W and Part of Sheet 41,” in Memoir of the British Geological Survey (Scotland) (London: HMSO), 99pp.
McLean, D. (2020). The Story of ‘Tumbledown Terrace’: The Edinburgh Street That Collapsed. Edinburgh: Edinburgh Evening News, 11th November 2020.
Monaghan, A. A., and Parrish, R. R. (2006). Geochronology of Carboniferous–Permian Magmatism in the Midland Valley of Scotland: Implications for Regional Tectonomagmatic Evolution and the Numerical Time Scale. J. Geol. Soc. Lond. 163, 15–28. doi:10.1144/0016-764904-142
Nature (2022). Overhyping Hydrogen as a Fuel Risks Endangering Net-Zero Goals. Nature 611, 426. doi:10.1038/d41586-022-03693-6
PfeifferW. T.al HagreyS. A.KöhnD.RabbelW.BauerS. (2016). Porous Media Hydrogen Storage at a Heterogeneous Field Site: Numerical Simulation of Storage Operation and Geophysical Monitoring. Environ. Earth Sci. 75, 1177. doi:10.1007/s12665-016-5958-x
Ricketts, T. S. (1959). Letter From Scottish Gas Board to BP Exploration Operating Company Limited, 10th November 1959. Released Document. Available at: https://ukogl.org.uk/map/php/files.php/?subfolder=well_reports&filename=01+-+Exploration+Wells%2FCOUSLAND+1%2FCOUSLAND+1_General+Field+File+3.pdf (Accessed October 15, 2023).
Rombdhane, A., Querendez, E., and Ravaut, C. (2014). CO2 Thin-Layer Detection at the Sleipner Field With Full Waveform Inversion: Application to Synthetic and Real Data. Energy Procedia 51, 281–288. doi:10.1016/j.egypro.2014.07.033
S&P Global (2019). Subsurface Models, Bleeding Cores and Quantifying In-Place Fluid Volumes. Available at: https://www.spglobal.com/commodityinsights/en/ci/research-analysis/subsurface-models-bleeding-cores-and-quantifying-inplace-fluid.html (Accessed October 15, 2023).
Scafidi, J. (2022). Hydrogen Storage in Depleted Gas Fields: Capacity and Performance. Ph.D. thesis. Edinburgh: Edinburgh Research Archive, University of Edinburgh, School of Geosciences.
Scottish Science Advisory Council (2022). SSAC Technical Briefing Note: Opportunities and Challenges Associated With Hydrogen's Role in the Delivery of Future Energy Systems in the Context of a Just Transition. Available at: https://scottishscience.org.uk/sites/default/files/article-attachments/SSAC%20Hydrogen%20Technical %20Briefing%20Note.pdf (Accessed September 1, 2023).
Taylor, J. C. M. (1960). Geological Report on Cores From Cousland-6. V.C.Illing & Partners, Released Report. Available at: https://ukogl.org.uk/map/php/files.php/?subfolder=well_reports&filename=01+-+Exploration+Wells%2FCOUSLAND+6%2FCOUSLAND+6_Geological+Report+On+Cores.pdf (Accessed October 15, 2023).
Terris, A. P. (1960). Cousland No.6. Geological Completion Report. Released BP Internal Report. Available at: https://ukogl.org.uk/map/php/files.php/?subfolder=well_reports&filename=01+-+Exploration+Wells%2FCOUSLAND+6%2FCOUSLAND+6_Geological+Completion+Report.pdf (Accessed October 15, 2023).
Thaysen, E. M., McMahon, S., Strobel, D. J., Butler, I. B., Ngwenya, B. B., Heinemann, N., et al. (2021). Estimating Microbial Hydrogen Consumption in Hydrogen Storage in Porous Media. Renew. Sustain. Energy Rev. 151, 111481. doi:10.1016/j.rser.2021.111481
Tracy, P. J. (1957). Borehole Survey of Cousland Well No.1, 1.11.56. KIRKLINGTON HALL TECHNICAL NOTE 334/57, 17 January 1957. Released Report. Available at: https://ukogl.org.uk/map/php/files.php/?subfolder=well_reports&filename=01+-+Exploration+Wells%2FCOUSLAND+1%2FCOUSLAND+1_Petroleum+Engineering+File+2.pdf (Accessed October 15, 2023).
Underhill, J. R., Monaghan, A. A., and Browne, M. A. F. (2008). Controls on Structural Styles, Basin Development and Petroleum Prospectivity in the Midland Valley of Scotland. Mar. Petroleum Geol. 25, 1000–1022. doi:10.1016/j.marpetgeo.2007.12.002
Verdon, J. P., Kendall, J.-M., White, D. J., and Angus, D. A. (2011). Linking Microseismic Event Observations With Geomechanical Models to Minimise the Risks of Storing CO2 in Geological Formations. Earth Planet. Sci. Lett. 305, 143–152. doi:10.1016/j.epsl.2011.02.048
Visser, T. M. R. B. (2020). Seasonal Hydrogen Storage in Depleted Gas Reservoirs: A Feasibility Study for The Netherlands. M.Sc, thesis. Delft: Delft University of Technology, 63pp.
Keywords: hydrogen storage, porous media, depleted field, Cousland, Midland Valley of Scotland, Carboniferous, Strathclyde Group, Gullane Formation
Citation: Butler M and Underhill JR (2024) A Critical Geological Evaluation of the Hydrogen Storage Potential in the Cousland Gas Field, Midland Valley of Scotland. Earth Sci. Syst. Soc. 3:10076. doi: 10.3389/esss.2023.10076
Received: 09 March 2023; Accepted: 24 November 2023;
Published: 12 January 2024.
Edited by:
Mark Thomas Ireland, Newcastle University, United KingdomReviewed by:
Richard Swarbrick, Durham University, United KingdomCees Van Der Land, Newcastle University, United Kingdom
Copyright © 2024 Butler and Underhill. This is an open-access article distributed under the terms of the Creative Commons Attribution License (CC BY). The use, distribution or reproduction in other forums is permitted, provided the original author(s) and the copyright owner(s) are credited and that the original publication in this journal is cited, in accordance with accepted academic practice. No use, distribution or reproduction is permitted which does not comply with these terms.
*Correspondence: Malcolm Butler, malcolm@ukogl.org.uk, orcid.org/0000-0002-0462-9135 John R. Underhill, john.underhill@abdn.ac.uk