 Rachel E. Utley1†
 Emma Martin-Roberts1*Nicholas Utting2Gareth Johnson3
 Domokos Györe4,5Marta Zurakowska4Finlay M. Stuart4Adrian J. Boyce4Thomas H. Darrah6,7Pauline Gulliver4R. Stuart Haszeldine1Don Lawton8,9
 Stuart M. V. Gilfillan1
- 1School of GeoSciences, Grant Institute, The University of Edinburgh, Edinburgh, United Kingdom
- 2Natural Resources Canada, CanmetENERGY, Devon, AB, Canada
- 3Department of Civil and Environmental Engineering, The University of Strathclyde, Glasgow, United Kingdom
- 4Scottish Universities Environmental Research Centre (SUERC), East Kilbride, United Kingdom
- 5Isomass Scientific Inc., Calgary, AB, Canada
- 6School of Earth Sciences, The Ohio State University, Columbus, OH, United States
- 7Global Water Institute, The Ohio State University, Columbus, OH, United States
- 8Carbon Management Canada, Calgary, AB, Canada
- 9Department of Earth Sciences, The University of Calgary, Calgary, AB, Canada
Carbon capture and storage (CCS) is an industrial scale mitigation strategy for reducing anthropogenic CO2 from entering the atmosphere. However, for CCS to be routinely deployed, it is critical that the security of the stored CO2 can be verified and that unplanned migration from a storage site can be identified. A number of geochemical monitoring tools have been developed for this purpose, however, their effectiveness critically depends on robust geochemical baselines being established prior to CO2 injection. Here we present the first multi-well gas and groundwater characterisation of the geochemical baseline at the Carbon Management Canada Research Institutes Field Research Station. We find that all gases exhibit CO2 concentrations that are below 1%, implying that bulk gas monitoring may be an effective first step to identify CO2 migration. However, we also find that predominantly biogenic CH4 (∼90%–99%) is pervasive in both groundwater and gases within the shallow succession, which contain numerous coal seams. Hence, it is probable that any upwardly migrating CO2 could be absorbed onto the coal seams, displacing CH4. Importantly, 4He concentrations in all gas samples lie on a mixing line between the atmosphere and the elevated 4He concentration present in a hydrocarbon well sampled from a reservoir located below the Field Research Station (FRS) implying a diffusive or advective crustal flux of 4He at the site. In contrast, the measured 4He concentrations in shallow groundwaters at the site are much lower and may be explained by gas loss from the system or in situ production generated by radioactive decay of U and Th within the host rocks. Additionally, the injected CO2 is low in He, Ne and Ar concentrations, yet enriched in 84Kr and 132Xe relative to 36Ar, highlighting that inherent noble gas isotopic fingerprints could be effective as a distinct geochemical tracer of injected CO2 at the FRS.
Introduction
Preventing the global average temperature of the Earth’s atmosphere from rising more than 2°C above pre-industrial levels is a global goal adopted by 187 nations through the 2015 Paris Agreement (UNFCCC 2015). Meeting this target requires that CO2 emissions from fossil fuel use and industrial processes must be curtailed (UNFCCC 2015). This can only be achieved through the combination of switching to zero-carbon energy sources and the use of large-scale CO2 mitigation strategies (Rogelj et al., 2018). Carbon capture and storage (CCS) is an industrial scale, cost-effective mitigation strategy for reducing anthropogenic CO2 from entering the atmosphere (IPCC 2005; Scott et al., 2012). The technology consists of CO2 capture at the point source of emission, transport of this captured CO2 to an engineered storage site and the secure storage of the injected CO2 within the subsurface (IPCC 2005).
For CCS to be routinely deployed, an understanding of the potential migration pathways that could lead to the contamination of the overlying shallow groundwaters and how CO2 migration can be monitored is needed (Alcalde et al., 2018; Ju et al., 2019). This understanding can be provided through the study of CO2 storage and migration in pre-existing engineered storage sites, such as CO2 enhanced oil recovery fields (Györe et al., 2015; 2017; Stalker et al., 2015) and in purpose-built test sites (Kikuta et al., 2005; Spangler et al., 2010; Martens et al., 2013; Smith et al., 2013; Jones et al., 2014; Serno et al., 2016; Feitz et al., 2018; Ju et al., 2020; Michael et al., 2020). Pilot CO2 injection sites provide a unique opportunity to establish a geochemical baseline and refine post-injection monitoring methods to verify the secure injection and storage of injected CO2.
Carbon Management Canada Research Institutes Inc., in collaboration with The University of Calgary, have constructed a Field Research Station (FRS) for the development and demonstration of monitoring technologies for the containment and conformance of subsurface fluids, in particular CO2 (Mayer et al., 2015; 2018; Lawton et al., 2017; 2019; Macquet et al., 2019). The FRS is located ∼22 km southwest of Brooks, Newell County, Alberta, on a 200-hectare site leased from Eastern Irrigation District and Torxen Energy (Lawton et al., 2019) (Figure 1). The site overlies the Countess hydrocarbon field, situated within the Western Canada Sedimentary Basin (WCSB), one of the world’s most prolific petroleum and natural gas plays. Consisting of multiple boreholes, the FRS provides opportunities to perform large-scale injected gas phase CO2 studies in the overlying shallow Upper Cretaceous Interior Seaway stratigraphic succession. Overlying shales, and interbedded sandy shales of the Belly River Group have been identified as potentially suitable cap rocks to prevent the upwards migration of the CO2 and related fluids (Lawton et al., 2019).
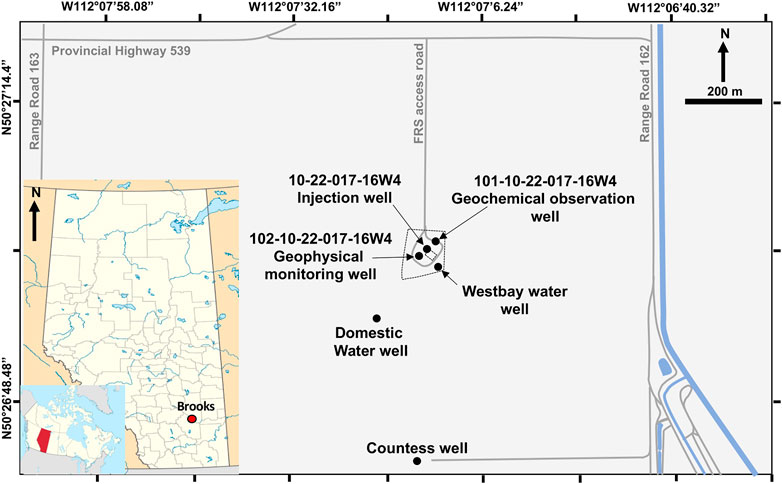
FIGURE 1. Map view of the Field Research Station, situated in Brooks, Alberta (inset). Base-map modified from ESRI ArcOnline (Getech Sedimentary Basins). All major infrastructure, including all wells studied are highlighted within the sitemap.
Several geochemical methods can be used to identify CO2 migration and storage in the subsurface (Johnson et al., 2009; Humez et al., 2014). The injection and subsurface migration of CO2 has previously been traced through the use of the isotopic composition of CO2 (both δ13C and δ18O) (Serno et al., 2016; Johnson et al., 2011; Myrttinen et al., 2010). However, this technique becomes challenging when the isotopic signature of the injection fluid overlaps the natural CO2 sources in the subsurface (e.g., Wycherley et al., 1999). The noble gases provide a means of tracing physical processes due to their inert nature and their isotopic composition allows the identification of processes that can be used to trace the source and interaction history of fluids (Ballentine and Burnard, 2002; Sherwood Lollar and Ballentine, 2009). Combined with the stable isotopic values of CO2, noble gases have also been used to successfully understand microbial processes post CO2-injection at the Olla Field, Enhanced Oil Recovery (EOR) project in Louisiana, USA (Tyne et al., 2021).
Basin-wide noble gas studies of the WCSB have been previously undertaken (e.g., Hiyagon and Kennedy, 1992; Pujol et al., 2018). Most significantly, within the basin, two distinct natural gas reservoirs in Cretaceous and Devonian aged rocks have been identified (Hiyagon and Kennedy, 1992); one with variable noble gas compositions indigenous to the host sediments (within 500 km of the FRS) and another with higher amounts of radiogenic-nucleogenic noble gases consistent with their proximity to basement rocks. However, previous work into the noble gas composition of natural gases closer to the FRS region are somewhat limited. Here we determine the stable isotope, 14C and noble gas fingerprint of gases and groundwaters at the FRS prior to CO2 injection. We compare these to natural gas from the underlying Countess field units to establish the connectivity with the deeper hydrocarbon bearing formation below and the shallow CH4-rich coal-bearing strata present at the FRS site. Additionally, the geochemical fingerprint of the injected CO2 is reported, and used to assess the extent to which the natural tracers in the CO2 can be used as a tool for monitoring gas movement in the FRS.
Carbon Management Canada Field Research Station Site and Geological Background
FRS Site
The Carbon Management Canada FRS site was developed to test various techniques for monitoring the safe injection and containment of CO2. As part of the first phase of site development, an initial injection well (CMCRI Countess – 100/10-22-17-16W4) was drilled to 550 m, “plugged back” to 305.5 m and perforated between 295 and 302 m to facilitate injection into the shallow 295 m injection zone (Figures 1, 2). Completed with chrome steel casing and CO2 resistant cement, this shallow zone is located below the base of the groundwater protection zone (200 m), presenting the opportunity to monitor the interaction of the CO2 with the local groundwater zone (150–300 m) (Lawton et al., 2019). An additional layer of protection within the groundwater zone is provided through the surface casing on the outside of the injection well (Lackey and Rajaram 2019) which provides a means to vent gases migrating along the outside of the deeper casing of the well. This surface casing extends to a depth of 226 m.
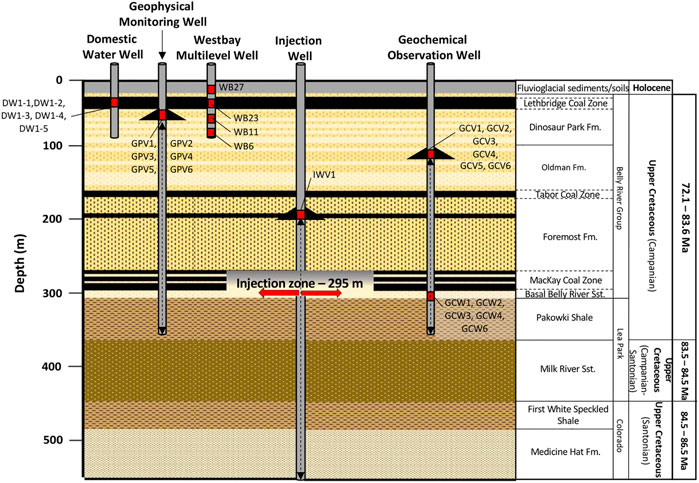
FIGURE 2. Generalised cross-section sketch of the FRS to an approximate depth of 550m, showing sampled wells, surface casing vent locations and sample locations (red boxes). Dashed arrows in the Geophysical Monitoring well, Geochemical Observation well and the Injection well represent the depth interval that SCV data may originate from (i.e., between the casing landing depth and the total depth of the well). Also included is the geological stratigraphy at the FRS. CO2 will initially be injected into the Basal Belly River Sandstone horizons (highlighted as ‘injection zone’ at 295 m), for which the cap rock is the MacKay Coal Zone. Redrawn after Osadetz et al. (2017).
Two 350 m deep monitoring wells (Geochemistry – CMCRI 103 MW1 Countess 10-22-17-16W4M and Geophysics- CMCRI 102 MW2 Countess 10-22-17-16W4) with surface casing extending to 120 m and 50 m, were also drilled at the site. The geochemistry observation well, 30 m northeast of the injection well, is instrumented and completed primarily to perform geochemical sampling and monitoring experiments, including screened intervals across the Upper Cretaceous Belly River Group basal sandstone injection zone at ∼295 m. The geophysical observation well, 20 m down-dip of the injection well, is instrumented and completed to perform geophysical monitoring experiments (Lawton et al., 2019) (Figures 1, 2).
To date, six water wells have been constructed to the east, southeast and southwest of the monitoring and injection wells. Three of these wells were drilled in December 2018, post-dating the field sampling campaign for this study, and hence are not discussed further. The domestic water well was constructed to simulate a typical landowner well as found across the region (Tilley and Muehlenbachs 2012). The well is drilled to 85.3 m bgs (m below ground surface) and completed with a combination of steel surface casing (0–26.2 m bgs) and an acrylonitrile butadiene styrene (ABS) thermoplastic casing within unconsolidated Pleistocene tills and glacial-fluvial sediments (Figures 1, 2). This well is fitted with an electric submersible pump and is perforated between 23.5–47.5 m bgs, such that water production is commingled from the Lethbridge coal zone and several sandstone beds across the perforated interval near, and possibly in hydrological communication with the bedrock till contact.
The Westbay multilevel well was drilled to 108.2 m bgs (Figures 1, 2), and is completed with a Westbay groundwater monitoring system with 27 ports. Multilevel systems permit repetitive sampling and observation over specific depth intervals (Findlay et al., 2013). A paired borehole (Multilevel well-2) was also drilled next to the domestic water well to compare results with the Westbay multilevel well but was not sampled for this study.
Since the 9th of August 2017, CO2 gas injection at the site has occurred episodically, at rates typically less than .5 tonne of CO2 per day, into the water-bearing basal shoreface sandstone of the Foremost Formation within the Upper Cretaceous Belly River Group (Figure 2). The injection experiment is designed to generate a slowly accumulating CO2 gas plume, which will be utilised to test monitoring technology detection thresholds and to understand CO2 movement through the site. It is planned that CO2 will continue to be injected over a five-year period. It is expected that the plume will eventually reach ∼100 m radius, to be followed by 5 years of post-closure monitoring (Macquet et al., 2019).
Geological Background
The FRS is located in the Countess Oil Field within the Western Canada Sedimentary Basin (WCSB) between the Bow and Red Deer Rivers (Lawton et al., 2019). The Cretaceous strata (∼500 m) (Figure 2) at the FRS unconformably overlie a ∼1,200 m eroded carbonate and evaporite-dominated Palaeozoic succession, which in turn lies unconformably on Precambrian basement (Wright et al., 1994; Lawton et al., 2019) made up of plutonic and metasedimentary successions of the Pre-Cambrian Canadian Shield (Mossop and Shetsen 1994).
The Phanerozoic sedimentary succession is composed of several westward thickening “sloss sequences” (lithostratigraphic sequences that characterise complete marine transgression—regression sequences, located on a continental crust, and can therefore also be termed cratonic sequences) (Osadetz et al., 2018) within the predominately clastic Lower Cretaceous-Palaeocene succession, in which the FRS wells are completed (Dawson et al., 1994; Osadetz et al., 2018). The stratigraphy encountered at the FRS is comprised of ∼1,000 m of interbedded Cretaceous-age sandstone and shale-dominated strata deposited during successive regressive and transgressive sequences, associated with Laramide orogenic foreland progradation into the Cretaceous Interior seaway (Lawton et al., 2019). The 550 m of strata at the FRS consists of the Late Cretaceous Belly River Group, the Lea Park Formation, and the Colorado Group, deposited over 14.2 million years from the Santonian to the Campanian (Figure 2). Regional seismic data indicates minor local tectonic movement due to Palaeozoic salt dissolution in the easternmost part of the leased land, but local Phanerozoic sedimentary successions at the CO2 injection site are locally undeformed (Lawton et al., 2019).
The region has long been a producer of natural gas and oil. Hydrocarbons are locally produced from the Lower Cretaceous sandstones that occur below the horizons of interest for the FRS CO2 injection and monitoring program (Albian Viking formation at a depth of 938 m). Economic gas reserves are contained within the Upper Cretaceous Milk River and Medicine Hat formations (Figure 2) along with a deeper formation, the Second White Specks Formation in southern Alberta and Saskatchewan. They are the largest gas fields discovered in Canada and produce immature, biogenic gas (CAPP 2018). Locally, beneath the FRS, natural gas is produced from the Viking Formation of the Lower Cretaceous Colorado Group, which was also sampled for this study (sample C1).
Sampling and Methodology
Sample Collection
28 samples (19 gas and 9 groundwater) were collected over a 10-month period from July 2017 to May 2018 (Tables 1–Tables 3). Of those collected; 11 gas samples were analysed for stable isotopes (Table 1) and 21 samples (12 gas and 9 groundwater samples) were analysed for noble gas compositions and isotopic ratios (Tables 2, 3). Two CO2 samples, representing the CO2 delivered to the FRS for injection, were also collected from PraxAir, Calgary in July 2017 and analysed for selected stable isotopes and noble gases. As the first injection of CO2 occurred on the 9th of August 2017, this study has samples taken from both before and after initial low test injection rates.

TABLE 1. Details outlining sample name, depth and date of collection, collection method, δ13CCH4, δDCH4 and bulk gases for 11 gas samples and 2 CO2 samples.

TABLE 2. Noble gas concentrations for 12 gas, 9 water and 2 CO2 samples. Concentrations expressed as cm3 (STP)/cm3. Errors quoted in brackets.
TABLE 3. Noble gas isotopic ratios for 12 gas, 9 water and 2 CO2 samples. Concentrations expressed as cm3 (STP)/cm3, with errors quoted in brackets.
At the FRS, gas samples were collected from three locations (Geochemical observation well, Geophysical monitoring well and the Injection well) and the nearby Torxen Energy owned Countess well. Groundwater samples were obtained from two FRS wells (Westbay water well and the Domestic water well—Figures 1, 2). The depths and location of sampling points are shown in Figure 2 and in Tables 1–Tables 3. The Geochemical observation well was perforated and sampled at a depth of ∼295 m (samples labelled GCW). The other gas samples were taken from three surface casing vents within the Geochemical observation well, Geophysical monitoring well and the Injection well (samples labelled GPV, IWV and GCV, respectively). It should be noted that depths for casing vent samples are labelled as their casing landing depth, however samples may originate from any depth between this upper depth and the total depth of the well. One produced gas sample from the Countess Well which taps the Viking Formation hydrocarbon reservoir vertically at an approximate depth of 938 m was also taken. Sampling depths for water samples collected from the Westbay water well (WB samples) ranged between 29 and 90 m while all Domestic water well samples (DW1 samples) were obtained from depths between 23.5–47.5 m bgs. For this study an average depth of 35.7 m is assumed.
Twenty-six samples were collected in refrigeration-grade 70 cm long copper tubes, connected to the well heads and surface casing vents by a regulator and high-pressure hosing (Holland and Gilfillan, 2013). Gas or water was flowed through the copper tubes for 5 min prior to sample collection to prevent atmospheric contamination. The copper tubes were then sealed using specially manufactured clamps to form cold welds, providing a helium leak tight seal. Two samples (GCV2 and GCW2) were collected in gas bags attached directly to the step-down pressure regulator. Three of the collected samples (GPV1, GCW1 and IWV1) were split to undertake radiocarbon analysis. The two PraxAir CO2 samples were sourced from the flue gas stack system of a chemical plant at Fort Saskatchewan. This CO2 was captured via amine stripping and subsequently flushed with O2 to purify the gas stream. Three coal samples were also obtained from the Lethbridge Coal Seam within the Bow City abandoned open cast pits, approximately 10 km SW from the FRS for XRF analysis. Fresh samples varying in size from ∼5 to 25 cm were collected from coal seam outcrops approximately 100 m from the boundary gate.
Sample Analysis
FRS gas samples collected in July 2017 (samples GCV2, GCW1, GCW2, GPV1, GPV2, IWV1 and C1) and the two PraxAir CO2 samples were analysed at the Scottish Universities Environmental Research Centre (SUERC) for δ13CCH4, δDCH4, major gas compositions and noble gas isotopes. Radiocarbon isotope analysis was carried out at the NEIF Radiocarbon (Environment) Laboratory also at SUERC.
Bulk gases were measured using a Pfeiffer Vacuum QMS 200 quadrupole mass spectrometer (Györe et al., 2015) and Hewlett Packard 5890 Series 11 Gas Chromatograph (Chen et al., 2019) with measured errors of ±1%. δ13C and δD were determined on a VG SIRA II dual inlet isotope ratio mass spectrometer and VG Optima dual inlet isotope ratio mass spectrometer, respectively (Donnelly et al., 2001; Györe et al., 2018). δ13C values are reported relative to V-PDB international standard; δD values are quoted relative to V-SMOW (Craig 1957; Gonfiantini 1984; Coplen 1995) with known uncertainties of .3% (δ13C) and 3% (δD).
Radiocarbon samples were processed to graphite following methods previously outlined (Garnett et al., 2019). The δ13C was measured from one aliquot of the sample using a Thermo Fisher Delta V dual inlet stable isotope mass spectrometer relative to international standard protocol (Stuiver and Polach 1977). The second aliquot of CO2 was reduced to graphite using Fe-Zn reduction (Slota et al., 1987) and 14C/13C ratios were measured using a NEC 5MV Tandem accelerator mass spectrometer in the SUERC AMS Laboratory (Freeman et al., 2007). Noble gases isotope ratios and concentrations were analysed on a MAP 215–50 mass spectrometer operating in static mode using methods and procedures previously outlined (Györe et al., 2015; 2017).
All other noble gas samples were analysed at the Ohio State University WHEEL Laboratory. Major gas concentrations were measured on a SRS Quadrupole MS and SRI 8610C Multi-Gas 3+ gas chromatograph equipped with a flame ionization detector and thermal conductivity detector. Standard analytical uncertainties were less than ±3% (Darrah et al., 2013; Moore et al., 2018). All other hydrocarbon gas analysis (composition and isotopes) were analyzed at the University of Ottawa Ján Veizer Stable Isotope Laboratory using an SRI GC 8610C with helium as a carrier gas. For analysis, gas was injected into the GC Isolink and the gas of interest (C1-C3 or other) was isolated and converted to CO2 or H2.
The composition of three coals from the Lethbridge coal seam were determined by XRF at the University of Liverpool in February 2019. Analysis was undertaken on an Olympus Vanta-M Handheld XRF Spectrometer with a 50 kV (max) rhodium tube. Light elements were analysed for 90 s at 10 kV, and intermediate and heavy elements for 30 s at 40 kV. All analyses were carried out within an Olympus safety enclosure, with the samples placed on top of the inverted XRF unit and run at atmospheric pressure with no vacuum or helium purge.
Results
Major Gas and Stable Isotope Composition
Bulk gas composition was determined on 11 gas samples (Table 1; Figures 3, 4). Except for sample GCV2 (which recorded 57.8% N2), CH4 was found to be the primary gas, ranging from 42.0% to 96.8%. Ethane (C2) and propane (C3) are observed in trace quantities in most samples, varying from undetectable amounts to 3.6% and 1.5% for C2 and C3, respectively. N2 represents the only other major gas species (3.2%–57.8%) and O2 varies between .00% and 9.32%. Measured CO2 (.00%–.26%) comprised less than 1% in all samples.
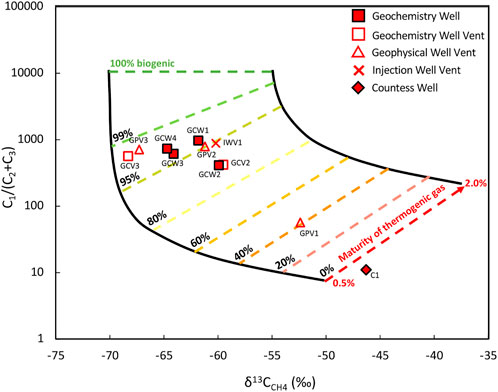
FIGURE 3. Modified Bernard plot comparing the gas dryness (ratio of CH4 to higher order aliphatic hydrocarbons (C1/C2+C3) vs. δ13C-CH4 (Bernard et al., 1976) with mixing lines between thermogenic natural gas and hypothetical biogenic mixing endmembers (Whiticar 1999). Dashed lines represent fractions of biogenic gas in mixture. Thermogenic gas is represented by a range of values corresponding to increasing thermal maturity (expressed as vitrinite reflectance, Ro) of Type II organic matter, and biogenic gas is represented by a range of values related to methanogenic pathways (hydrogenotrophic CO2 reduction versus methylotrophic and acetotrophic pathways). Adapted from Strapoć et al. (2011). The majority of gas samples plot within the 85%–99% biogenic gas contribution, with the exception of GPV1, which exhibits a signature corresponding to 40% biogenic gas contribution.
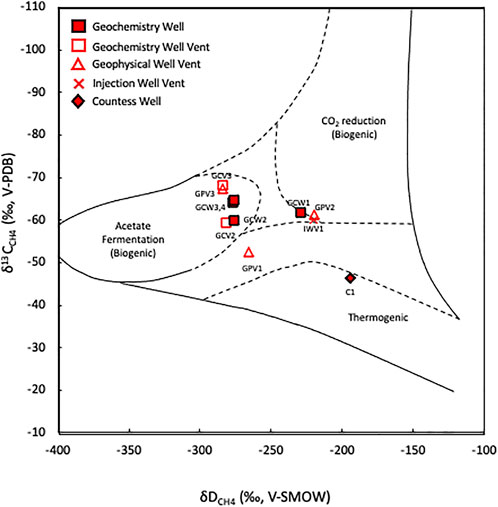
FIGURE 4. Modified Whiticar plot comparing δ13C-CH4 vs. δ2H-CH4 following Whiticar, (1999) showing the potential genetic sources of CH4 measured in samples collected at the FRS. Samples show a mixed range between biogenic and thermogenic CH4 sources (sample C1).
With the exception of sample C1 (with δ13CCH4 values of −46.3‰ and δDCH4 values of −194‰), the measured δ13CCH4 in the FRS gas samples range from −52.4 to −68.3‰, and δDCH4 values vary between −220 and −284‰. The majority of δ13CCH4 values are comparable to those measured for shallow mud gases obtained during initial drilling at the FRS site (Mayer et al., 2015; 2018). These values are also consistent with average values recorded in Groundwater Observation Wells near to the FRS (−66.2%; Humez et al., 2016) and other nearby sedimentary basins such as the Williston basin (Hendry et al., 2016; 2017). The δ13CCO2 of the CO2 to be injected was also determined for two samples with values ranging from −34.3 to −34.8‰.
The FRS gas samples exhibit a range of C1/(C2+C3) values between 11 (C1) and 968 (GCW1) (Table 1). Generally, C1/(C2+C3) values greater than 2,000 are indicative of a biogenic source, whilst ratios of 100 or less point to a dominantly thermogenic source (Moritz et al., 2015). The most common indicator of microbial gas is the presence of CH4 with low δ13C values (<−55‰). The Countess Well (sample C1), plots clearly in the thermogenic envelope, as dominantly thermogenic natural gas and although not purely thermogenic in origin, sample GPV1 also plots close to this source in both gas wetness data and isotopic values (Figures 3, 4). The majority of remaining samples plot between microbial CH4 derived either from CO2 reduction or acetate fermentation. Six well gas samples (GCV2, GCV3, GPV3, GCW2, 3 & 4) plot in the field associated with biogenic acetate fermentation regime, while three samples (GCW1, GPV2 and IWV1) have values associated with CO2 reduction pathways. Whilst no samples exhibited a definitive biogenic source in gas wetness data, all have biogenic isotope values. This suggests that the biogenic CH4 at the FRS site has undergone an additional process, altering the gas wetness ratio and/or its isotopic composition.
Radiocarbon
The radiocarbon concentration for the three samples measured; GPV1, GCW1 and IWV1, were indistinguishable from the analytical background level according to radiocarbon reporting conventions (Stuiver and Polach 1977).
Noble Gas Compositions—Gas Samples
Noble gas concentrations and isotopic ratios of 12 gas samples are provided in Tables 2, 3.
Helium
4He concentrations range from 2.60 ± .03 × 10−5 to 6.75 ± .09 × 10−4 cm3(STP)/cm3 (where STP is standard temperature and pressure). All sample values are significantly higher than air concentration (5.23 × 10⁻⁶ cm3(STP)/cm3). 4He/20Ne are higher than the atmospheric ratio of .3, ranging from 1.59 to 17,421, showing that atmospheric He contributions to all samples is negligible (Figure 5). 3He/4He ratios vary from .092 to .225 RA, where RA is the atmospheric ratio of 1.384 × 10⁻⁶ (Clarke et al., 1976). All 3He/4He are greater than the average crustal production ratio of .02 RA (Ballentine and Burnard 2002; Figure 6A). A mixing between atmospheric and radiogenic He is apparent but there is no relationship between radiogenic He content and depth (Figure 6A).

FIGURE 5. 4He/20Ne vs. 3He/4He for samples collected at FRS. Data fall along a clear trend of mixing between shallow air-saturated water-like groundwater with a deep, dominantly radiogenic 4He that corresponds with CH4-rich samples. These trends indicate that CH4-rich fluids dominated by radiogenic helium are migrating into the shallow subsurface and mixing with ASW-like groundwater. The variation is defined by a mixing curve (Langmuir et al., 1977) indicating that between .1% and 80% of 4He is sourced from depth.
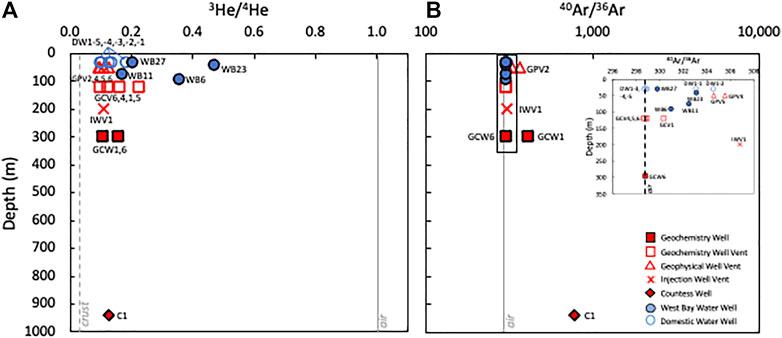
FIGURE 6. (A) 3He/4He and (B) 40Ar/36Ar vs. depth for samples collected at the FRS. There is no clear change in the helium isotopic ratio with increasing depth, but most samples indicate mixing with a radiogenic helium source and while 40Ar/36Ar ratios show differing contributions of atmospheric and radiogenic sources, there is a slight trend of increasing 40Ar with depth.
Neon
20Ne concentrations vary from 3.24 ± .01 × 10−8 to 1.69 ± .05 × 10−5 cm3(STP)/cm3, with the maximum concentration approaching that of air (1.64 × 10⁻⁵ cm3(STP)/cm3). 20Ne/22Ne ratios vary from 9.72 to 9.95, again close to the air value of 9.81. Whilst 20Ne is commonly introduced to the subsurface via groundwater, it can occasionally reflect air contamination introduced during sampling. 21Ne/22Ne ratios vary between .0282 and .0351. Most values are close to the atmospheric ratio of .0290 (Eberhardt et al., 1965; Györe et al., 2019) reflecting a trend consistent with mass fractionation. In contrast, samples GCW1, GPV2 and C1 have significantly higher 21Ne/22Ne ratios indicating that these samples contain a greater contribution from crustal radiogenic Ne.
Argon
40Ar concentrations range from 7.2 ± .3 × 10−5 to 1.2 ± .2 × 10−2 cm3(STP)/cm3. 40Ar/36Ar ratios range from 298 to 771. They reflect a mixture between air (298.6; Mark et al., 2011) and excess 40Ar (Ar*). 40Ar* varies from 1.69 × 10⁻⁶ to 5.4 × 10⁻⁵ cm3(STP)/cm3. There is a clearer trend of increasing 40Ar with depth (Figure 6B). 4He*/40Ar* ratios range from 6.3 to 33.9. Using the resolved 4He/40Arcrust = 11.7 (Figure 7) this implies there has been differential release of the lightest and heaviest noble gases from host minerals, thereby defining the amount crustal-radiogenic gas released into the proximal fluid systems (Ballentine and Burnard, 2002).
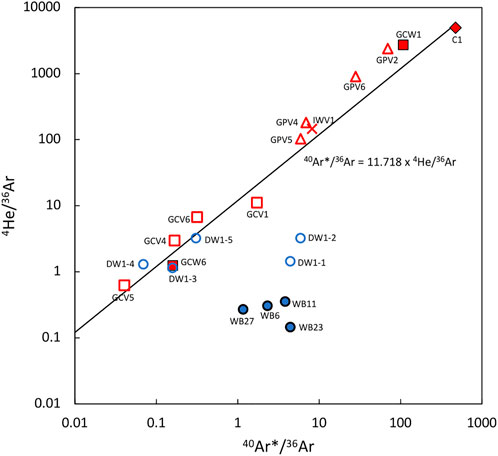
FIGURE 7. 40Ar*/36Ar vs. 4He/36Ar for all FRS samples. All samples show a trend towards radiogenic contributions, which increases with depth in the subsurface. Gas and groundwater samples display radiogenic contributions with a trend mixing towards air values (low 4He/36Ar and 40Ar*/36Ar) indicating a crustal flux exists throughout the site and a fluid connection from depth.
Krypton and Xenon
84Kr concentrations range from 4.32 ± .02 × 10−9 to 1.13 ± .30 × 10−6 cm3(STP)/cm3 while 132Xe concentrations vary between 1.9 ± .5 × 10−10 and 3.65 ± .05 × 10-8 cm3(STP)/cm3 (Table 2). 84Kr/36Ar and 132Xe/36Ar ratios range between .015 and .056 and .00051 and .0048, respectively. These values are both above and below the air values of .02 and .00074 for 84Kr/36Ar and 132Xe/36Ar, respectively.
Noble Gas Compositions—Groundwater Samples
Noble gas concentrations and isotopic ratios of 9 groundwater samples are provided in Tables 2, 3. To directly compare between gas and groundwater samples, the concentrations of noble gases dissolved in groundwaters are reported. The expected theoretical concentrations and isotope ratios of atmospheric derived noble gases dissolved in groundwater are referred to as air-saturated water (ASW). These were calculated through established solubility equilibration methods (Kipfer et al., 2002) and using the regional recharge conditions of 10°C, the average altitude of the FRS at 760 m, and an assumed excess air Ne component of 10% (Kipfer et al., 2002).
Helium
4He concentration values exhibit a range from 1.54 ± .05 × 10−7 to 2.32 ± .07 × 10−6 cm3(STP)/cm3 with 3He/4He ratios ranging from .102 to .469 RA (Figure 6A). 4He/20Ne ratios range from .96 to 8.98, higher than the atmospheric value of .288 and the ASW value of .259 indicating that atmospheric He contributions are also low in the groundwaters. The increase in 4He/20Ne values with a lowering of 3He/4He ratios in the groundwater samples may indicate the presence of a radiogenic noble gas source (Figure 5). This is especially evident in the DW1 groundwater samples, where 4He concentrations are slightly higher compared to those measured in the WB samples.
Neon
20Ne concentrations range from 9.10 ± .03 × 10−8 to 3.70 ± .11 × 10−7 cm3(STP)/cm3 with the highest value representing the deepest groundwater sample (WB6) taken at a depth of 90 m. 20Ne/22Ne ratios range from 9.76 to 9.91, both varying above and below the atmospheric air value of 9.8. 21Ne/22Ne ratios vary between .0286 and .0299, almost indistinguishable from the known air ratio of .0290 but consistent with variable mass fractionation as per the gas sample analyses.
Argon
40Ar concentrations range from 1.31 ± .04 × 10−4 to 3.42 ± .1 × 10−4 cm3(STP)/cm3. 40Ar/36Ar ratios range from 298 to 304. Calculated 40Ar* relative to the atmosphere 40Ar/36Ar varies from 5.72 × 10⁻⁸ to 4.72 × 10⁻⁶ cm3(STP)/cm3 suggesting the source of Ar in the groundwaters is predominantly atmospheric.
Krypton and Xenon
84Kr concentrations in water samples range from 5.97 ± .18 × 109 to 3.86 ± 1.20 × 10⁻⁸ cm3(STP)/cm3, while 132Xe concentrations vary between 1.94 ± .06 × 10−10 and 2.46 ± .7 × 10−9 cm3(STP)/cm3 (Table 2). 84Kr/36Ar and 132Xe/36Ar ratios range between .012 and .039 and .00052 and .0025, respectively. These values are both above and below the air values of .02 and .00074 for 84Kr/36Ar and 132Xe/36Ar, respectively, but samples from the WB well display higher values of each ratio compared to the DW1 samples. Most water samples measured are lower than the predicted ASW values (84Kr/36Ar = .039; 132Xe/36Ar = .0025) except for WB11 which has ASW values.
Injected CO2 Samples
The noble gas concentrations and isotopic ratios of the injected CO2 are provided in Tables 2, 3. 4He concentrations range from 3.66 ± .14 × 10−9 to 4.91 ± .20 × 10−9 cm3(STP)/cm3. 3He/4He could not be measured accurately as 3He was extremely low. 20Ne ranges from 9.7 ± .4 × 10−10 and 1.79 ± .06 × 10−9 cm3(STP)/cm3, 20Ne/22Ne from 9.66 to 9.92, whilst 21Ne/22Ne measure .0288 to .0291. 40Ar varies between 8.48 ± .03 × 10−7 to 1.04 ± .04 × 10−6 cm3(STP)/cm3, with 40Ar/36Ar ranging from 284 to 296 and 38Ar/36Ar recording values between .188 and .266. 84Kr and 132Xe concentrations vary from 1.62 ± .06 to 2.74 ± .11 × 10−9 cm3(STP)/cm3 and 7.87 ± .23 to 8.06 ± .23 × 10−9 cm3(STP)/cm3, respectively, both lower than air values. Ratios of 84Kr/36Ar and 132Xe/36Ar vary between .54 and .78 and 2.25 and 2.70, respectively, which are considerably higher than values recorded for both gas and groundwater samples.
Coal Samples
All three Lethbridge coal samples analysed were ∼90% composed of elements too light to detect (i.e., low atomic weight elements such as carbon and oxygen) through this type of analyses. This was expected as only the concentrations of U and Th were required for this work. Uranium concentrations recorded a value of 5 ppmm (parts per million mass), whilst thorium concentrations ranged from 10–14 ppmm. To estimate the maximum rate of 4He production only the highest values are reported (Table 4).
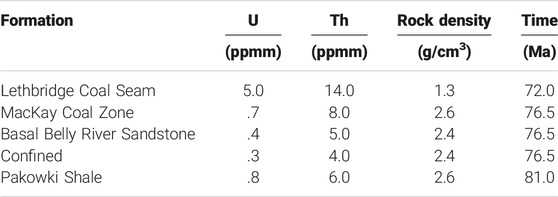
TABLE 4. Data used in Eqs 1, 2. Uranium and thorium data for all formations except Lethbridge Coal Seam obtained from (Matveeva and Kafle, 2009). Lethbridge Coal Seam concentrations obtained from XRF analysis of coal collected during sampling and analysed at The University of Liverpool.
Discussion
Source of CH4 at FRS
Differentiating subsurface gas origins can be complicated as different primary generation mechanisms and secondary processes can produce similar isotopic and compositional values (Martini et al., 2003). Three secondary processes can alter isotopic and compositional values of CH4; (i) migration and diffusion, (ii) oxidation and (iii) mixing (Whiticar et al., 1986; Whiticar 1999). Hence, in an environment where one or more of these processes has occurred, δ13C values of CH4 alone are of limited use, as the values typically fall between commonly accepted fields for thermogenic and biogenic gas (Martini et al., 2003). Typically, migration causes little variation in δ13C values, but results in an increase of the C1/(C2+C3) ratio (Schoell 1983; Whiticar and Faber 1986; Whiticar 1999; Moritz et al., 2015), whilst mixing alters both primary signatures.
The contribution of biogenic and thermogenic gases to samples can be constrained at the FRS through mixing curves plotted using end members for the wetness of the gas and δ13CCH4 (Figure 4). Additionally, the contribution of each methanogenic end member can be calculated using established mixing models (Strapoć et al., 2011; Stolper et al., 2015). All samples collected from the FRS plot within the envelope defined by mixing between thermogenic and biogenic CH4. Most FRS samples illustrate input of between ∼90% and 99% biogenic CH4, indicative of a predominantly biogenic source of CH4 mixing with thermogenic CH4 in the subsurface. The deepest sample (C1) is purely thermogenic while there is also isotopic and compositional evidence of thermogenic gas in sample GPV1 (Figures 3, 4). However, the variation in biogenic production pathways cannot be explained simply by mixing between the two sources (e.g., Figure 3).
Microbes are known to affect the distributions of hydrocarbons, primarily through their capacity to consume hydrocarbons in the presence of a suitable oxidant (Hanson and Hanson 1996; Widdel and Rabus 2001). Microbial consumption of hydrocarbon gases leading to oxidation modifies both the isotopic composition of gas fractions and the gas composition, and can occur both anaerobically and aerobically (Martini et al., 2003; Lopes and Viollier, 2011). In anaerobic environments, oxidation occurs at the base of the sulphate reduction zone (Iversen and Jorgensen 1985; Blair and Aller 1995), whilst in aerobic environments, due to aerobic methanotrophs dependency upon both oxygen and CH4, their activity is often highest in a narrow zone between anoxic and oxic conditions (Rudd and Hamilton 1975; Lidstrom and Somers 1984; King 1990). Within shallow hydrological systems, microbial oxidation occurs where dissolved oxygen comes into contact with hydrocarbons, and whilst bacteria consume all gaseous hydrocarbons, CH4 oxidation can occur most rapidly (King 1990; Whiticar 1999; Martini et al., 2003). If higher chain hydrocarbons (C2 and C3) are more readily oxidised, the general trend will be to more biogenic C1/(C2+C3) signatures (James 1983), leading to a 13C enrichment in residual gases (Martini et al., 2003). Previous studies have highlighted the importance of surface water influx in preferentially oxidising heavier chained hydrocarbons (James 1983; Vugrinovich 1988). If the supply of oxygen is exhausted, anaerobic microbial communities can colonise the reservoir. Once SO4− has also been removed by sulphate reducing bacteria, methanogens can metabolize organic matter or CO2 to produce CH4.
A combination of mixing and microbial oxidation has previously been suggested to explain C1/C2–4 ratios vs. 13C isotopic values in the Antrim Shale (Martini et al., 2003). Therefore, it is probable that a two-process mechanism is occurring at the FRS. The contribution of heavier chained hydrocarbons to some gases could only have been sourced from a thermogenic source, therefore indicating that mixing/migration occurred within the shallow subsurface. However, the change in wetness ratios and isotopic signatures is likely due to CH4 loss through oxidation within the subsurface, in which heavier chained hydrocarbons (C2, C3) are preferentially consumed.
Radiocarbon
14C within the three samples (GPV1, GCW1 and IWV1) analysed from the FRS are indistinguishable from analytical background levels, i.e. are “14C-free,” confirming that there is no resolvable modern carbon input to FRS gases from a minimum depth of 50 m. Combined with the stable isotope values these results show that the biogenic production of CH4 is from a fossil carbon source, with no measurable input of recently derived CH4 from surface activity (such as aquifer recharge), as such this cannot be distinguished from the thermogenic component which is also “14C-free.”
Origin of Noble Gases at the FRS
Noble gases occur naturally in low, measurable abundances in the crust (Ballentine and Burnard 2002; Ballentine et al., 2002). Unlike CH4, noble gas compositions are not altered by chemical reactions, oxidation or microbial respiration due to their inert nature (Ballentine and Burnard 2002; Ballentine et al., 2002; Sherwood Lollar and Ballentine 2009; Moore et al., 2018). Compared to CH4 and C2+ hydrocarbons, the original composition of noble gases is preserved in shallow groundwaters, independent of microbial activity or changes in oxygen fugacity (Darrah et al., 2014).
Using a simple mixing model (Figure 5) allows the prediction of the relationship that would result from mixing between the Countess sample (C1, with 4He/20Ne ratio of 17,419 and a 3He/4He ratio of .124 RA) and shallow groundwater in equilibrium with the atmosphere (with a 3He/4He ratio of 1 Ra and 4He concentration of ASW) (Gilfillan et al., 2011; 2017; Mackintosh and Ballentine 2012). The samples that lie on this mixing trajectory show differing percentages of radiogenic sourced 4He, assuming that the C1 gas sample is an accurate representation of the deepest end member at the FRS site. Samples GCW1 and GPV6 record the highest percentages of radiogenic 4He, implying that these samples contain between ∼50% and 80% of the level of 4He present in the deeper C1 sample. The majority of shallower gas and groundwater wells show mixing percentages of ∼15% to less than .1%. In addition to this, the gas samples exhibit trends towards high 40Ar* (Figure 6B) allowing this (as well as 4He) to be a useful discriminant of deep gas in the shallow subsurface and implying a crustal flux throughout the site.
It is important to note that providing reliable samples from the FRS is critical for accurate data analysis. Our results show that there is considerable variation between samples that were collected from the surface casing vents and the interior casing installed in the geochemistry well. It would be expected that similar sample types would yield similar values, but we observe an array of 4He/20Ne values indicating a variable atmospheric component. Data consistency is lowest in samples obtained from surface casing vents (e.g., GPV samples—Figures 5, 6) where the introduction of atmospheric components can be explained by the standard practice of leaving surface casing vent values open to the atmosphere, preventing casing gas build up. These vents were shut-in before sampling for this study, allowing gas to build-up, however a variable amount of atmospheric component can be expected due to differing shut-in periods and atmospheric pressure variations prior to sampling. The least contaminated GPV sample, GPV2, highlights that high quality samples can be obtained via this sampling medium, provided that there is sufficient gas build up prior to sampling.
Samples GCW1 and C1 are considered the most reliable gas samples, as these were collected from deep downhole locations shut off from any potential atmospheric influx. Sample GCW1 was sampled directly from the well annulus and is the most representative sample of the gas in place within the CO2 injection reservoir. All other GCW samples were taken from the u-tube sampling device installed within the interior casing of this well. This was in the process of being commissioned at the time of sampling and was not performing reliably, hence leading to variable amounts of atmospheric input into the GCW samples.
Whilst a variation in the signature from certain wells over time should not be discounted (e.g., Utting et al., 2022), Figure 5 demonstrates that the GPV samples plot in a random order along the 4He/20Ne mixing line, with no clear correlation with the date of sampling. It is more likely the reason for the variation in atmospheric input is due to differing sampling protocols over time, specifically differing casing vent shut-in times and variations in atmospheric pressure prior to shut-in ahead of sampling. This data indicates that a consistent protocol comprising of a fixed duration of casing vent valve shut-in prior to sampling should be developed and deployed in future monitoring efforts, to limit the effect of this source of sample variability. It would also be desirable to record the atmospheric pressure in the days leading up to sampling to ascertain if this influences the quality of the sample obtained.
4He Accumulation in Groundwaters
4He is predominantly generated from the radioactive decay of 235,238U and 232Th (Ballentine and Burnard, 2002). Hence, the elevated 4He values recorded in some of the FRS samples could be explained by the in situ generation and diffusive loss of 4He from U-Th rich rocks or alternatively, it may be derived from an external flux.
Once radiogenic and diffusive equilibrium is reached within the corresponding rocks, 4He is released at an almost constant rate, which is dependent upon the porosity and U and Th concentrations present within the rock (Torgersen and Ivey 1985). For this reason, 4He concentrations present within groundwater should increase with increasing residence time (Torgersen and Ivey 1985; Stute et al., 1992) and can theoretically continue to accumulate over millions of years. The decay of U and Th generates 4He at a rate, G, that can be calculated through the following equation (Andrews et al., 1991).
in which
These equations can be used to calculate the 4He concentration profile with depth for four formations at the FRS: Lethbridge Coal Seam, MacKay Coal Zone, Basal Belly River Sandstone and the Pakowki Shale (Figures 2, 8). These formations were chosen due to the availability of U and Th data, and due to their roles as a cap rock (MacKay Coal Zone) and shallow injection zone (Basal Belly River Sandstone). The Basal Belly River Sandstone, host to the shallow CO2 injection zone at a depth of 300 m, is water saturated. Samples obtained from the Lethbridge coal seam were also analysed for their U and Th content to quantify whether the free gas present at a depth of ∼30 m could have theoretically been generated in situ, or from a deeper, exogenous source.
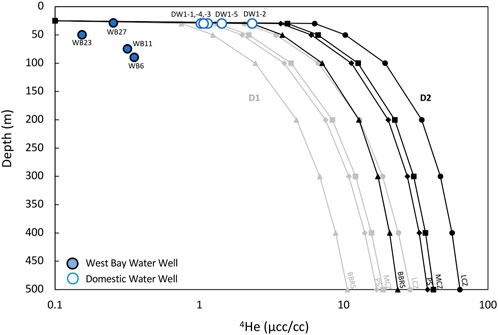
FIGURE 8. Concentration of 4He vs. depth (m). Theoretical stored 4He contents as a function of depth for the Lethbridge Coal Seam (LCZ, circles), MacKay Coal Zone (MCZ, squares), Basal Belly River sandstone (BBRS, triangles) and Pakowki Shales (PS, diamonds), modelled after Andrew et al. (1991). Profiles for all horizons are shown for the diffusion coefficient of water (D1 = .0315 m2/a; grey lines) and rock with 10% interstitial water (D2 = .0032 m2/a; black lines). 4Hesamples for groundwater are plotted for Domestic and West Bay Water Well samples. Samples obtained from the Domestic well lie between the D1 and D2 diffusion profiles for the FRS host stratigraphy, whilst Westbay Water well samples do not fit any of the modelled scenarios, indicating a potential 4He loss.
Profiles for diffusion coefficients of .0315 m2/a (D1; water) and .0032 m2/a (D2; 10% water interstitially dispersed) (Andrews et al., 1991) are calculated with data shown in Table 4. U concentrations range from .3 to 5 ppmm, and Th concentrations from 4 to 14 ppmm, representing the maximum values for each formation (Matveeva and Kafle 2009). Average rock densities of between 2.4 and 2.6 g/cm3 (Andrews et al., 1991), with average ages for the FRS stratigraphy ranging from 74-81 million years were used. For the sub-bituminous Lethbridge coal seam, an average density of 1.3 g/cm3 was chosen (Flores 2014), with an average age of 72 million years.
The theoretical generated and stored 4He contents of the four formations as a function of depth are shown in Figure 8. In general, radiogenic helium is easily released from subsurface formations, with less than 10% of He produced since the rock was formed being retained (Mamyrin and Tolstikhin 1984; Lehmann et al., 2003). The atoms that are released from these U and Th-rich formations reside in related groundwater (or pore fluids) from which they are then transported through i) diffusion or ii) groundwater flow, eventually being discharged to the atmosphere (Mamyrin and Tolstikhin 1984; Lehmann et al., 2003). To best represent the 4He diffusivity from the subsurface units, the 4He concentrations for groundwater samples from the Domestic and West Bay water wells are also plotted on Figure 8.
From the measured levels of 4He in the FRS groundwaters, ranging in depth from 29 to 90 m, it can be clearly observed that the West Bay Well data does not fit with either the modelled D1 or D2 diffusion profiles. 4He concentrations are much lower than the modelled profiles and may indicate He loss or stripping from the system. In contrast, samples obtained from the Domestic Well plot on, or between D1 and D2 diffusion profiles for the Basal Belly River Sandstone, the Pakowki Shale unit, the McKay Coal Zone and the Lethbridge Coals and therefore can be explained by in situ 4He production in the shallow stratigraphy of the region. However, we are unable to determine if the higher concentrations identified in the DW samples when compared to the WB samples is the result of additional 4He accumulation over time within the Lethbridge Coal Seam, which the well is completed within. Previous work has shown that coal seams can retain significant excesses of 4He over geological time (Kotarba, 2001; Kotarba and Rice, 2001; Györe et al., 2017).
Recommendations for Geochemical Monitoring of CO2 Migration at the FRS
Bulk Gas Concentrations
Notably, the CO2 concentrations residing within the shallow subsurface at the FRS are low (≤.26%—Table 1) at all stratigraphic depths sampled. Hence, upward migration of the injected CO2 could primarily be tracked using bulk gas concentrations alone. However, as there is evidence of natural gas oxidation in the subsurface at the site, which generates CO2, this could complicate the identification of the origin of any increase in subsurface CO2 concentrations. Hence, monitoring the subsurface fluids for an increase in CO2 alone may not be sufficient to robustly identify the upward migration of injected CO2. Furthermore, as the stratigraphy of the site contains both abundant CH4 and coal seams, and the shallow groundwaters are variably CH4 saturated (Mayer et al., 2015; Cheung, 2019) it is possible that any upwardly migrating CO2 could be absorbed onto the coal seams, if permeable (Ceglarska-Stefańska and Zarbska 2002) resulting in both desorption of CH4 from the coals (Zhang and Liu 2017) and potential exsolution of CH4 from groundwaters (Soltanian et al., 2018). A potentially useful consequence of the desorption process could be that monitoring for any increases in CH4 in the ground gases may provide and alternative monitoring tool for the migration of CO2 from the injection formation.
δ13C of CO2 in Gases
Whilst measurements of δ13CCO2 in gases have been successfully used to track the fate and migration of CO2 injected into the Weyburn CO2 enhanced oil recovery field and other CO2 storage test sites (Raistrick et al., 2006; Johnson et al., 2009) the effectiveness of δ13C alone as a means to identify CO2 migration from depths in excess of 100 m to the shallow subsurface has yet to be fully quantified (Mayer et al., 2015). This is because CO2 is both highly soluble and reactive in shallow systems limiting the sensitivity of early seepage detection (Gilfillan et al., 2017). There are many sources of both gas phase CO2 and DIC in subsurface waters, however processes including the breakdown of organic matter and plant respiration can lead to wide and overlapping δ13C fingerprints, typically ranging from −5 to −25‰ in natural subsurface waters (Kendall et al., 1995). These values are within the range detected when CO2 derived from fossil fuels equilibrates with water (Petroleum Technology Research Centre 2011; Flude et al., 2016; 2017), therefore it is unlikely that δ13CDIC can be successfully utilised alone to monitor CO2 migration at the FRS site.
CO2 obtained from PraxAir show δ13CCO2 values of between −34.3 and −34.8‰, which are on average between −25.2 and −34.0‰ lower than the carbon isotope ratio of casing vent δ13CCH4. δ13CCO2 of the injected gas. However, these cannot be compared to the CO2 within the shallow subsurface at the FRS as the CO2 concentrations were too low to permit isotopic analysis. Despite the large differences between the δ13CCO2 of the injected gas and the δ13CCH4 measured at the FRS, the presence of significant methanogenic activity may hinder the use of δ13CCO2 solely to track the migration and fate of CO2 at the FRS. At temperatures <200°C, both proportions and isotope ratios of CO2 and CH4 are largely controlled by kinetic processes (i.e., microbial activity) (Tassi et al., 2010), with methanogenesis through CO2 reduction being a major CO2 sink in the shallow subsurface. Considerable carbon isotope fractionation is associated with methanogenesis through CO2 reduction, commonly up to 95‰ (Hallmann and Summons 2013). Additionally, CH4 oxidation can fractionate the carbon isotope value by a further 10‰-20‰, depending upon the oxidation pathway and environmental variables (Whiticar 1999). A shift in the δ13CCH4 of surface casing vent gas away from values of −59.5 to −68.3‰ may therefore offer an insight into subsurface processes at the FRS. Evidence of thermogenic migration, mixing and oxidation at the FRS may however limit the effectiveness of this, with injected δ13CCO2 being within the isotopic range of thermogenic gas production. Any shift in the δ13CCH4 value, unless distinctly related to δ13CCO2 could therefore be linked to these processes. Whilst the concentrations of CO2 within the shallow subsurface at the FRS at the time of sampling were low and there is a distinction in δ13CCO2 values between the injected CO2 and the expected range of values within the CO2 in the subsurface, the use of δ13CCO2 as a sole tracer of CO2 migration at this site cannot be fully evaluated until CO2 breakthrough occurs at the geochemical monitoring well. Provided that the injected δ13CCO2 signature is not significantly altered by fractionation or absorption during migration in the reservoir, then δ13CCO2 could be solely used to identify CO2 migration outside of the injection horizon. However, given the potential that mixing with CO2 produced by methanogenic processes could significantly alter the δ13CCO2 signature in the shallow subsurface it is recommended that the most effective monitoring strategy would be to combine δ13CCO2 measurements with the noble gas tracing tools.
Noble Gases
Noble gases are intimately associated with all natural and engineered CO2 occurrences, being trace components in the gas mixture in parts per billion quantities (Gilfillan et al., 2017). Recent work has outlined the potential effectiveness of the inherent noble gas fingerprint within captured CO2 to be used as monitoring tracers to track the migration and fate of captured CO2 injected into the subsurface for storage (Flude et al., 2016; 2017; Ju et al., 2020; Weber et al., 2021). This work has determined that both the feedstock producing the CO2 and the capture process utilised influence the noble gas fingerprint of the captured CO2.
To determine how effective the inert noble gas composition of the CO2 is that is injected into the Basal Belly River Sandstone at the FRS, two samples were analysed. Noble gas concentrations and ratios displayed in Tables 2 and 3 highlight the lack of distinction between the injected CO2 and baseline data, both in gases and groundwaters (20Ne/22Ne, 21Ne/22Ne, 40Ar/36Ar, 38Ar/38Ar). However, these data do show elevated 84Kr/36Ar and 132Xe/36Ar values compared to FRS baseline samples, 10 and 1,000 times respectively. These values are plotted along with the FRS baseline data in Figure 9, illustrating the clearly elevated ratios due to excesses in heavier noble gases, 84Kr and 132Xe, relative to 36Ar most probably because of a solubility-based CO2 capture process (Flude et al., 2016; 2017). Hence, the inherent noble gas fingerprint within the injected fluids can be used to differentiate the injected CO2 from the natural background fluids, such as fossil gas, formation water or an atmospheric signature, based on the approaches as outlined in previous studies (Flude et al., 2016; 2017; Weber et al., 2021).
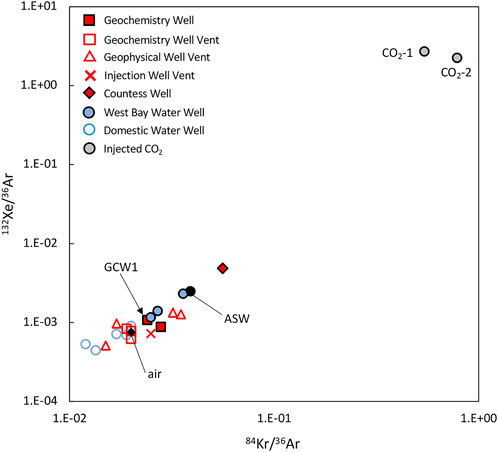
FIGURE 9. 84Kr/36Ar vs. 132Xe/36Ar for injected CO2 and FRS baseline noble gas ratios. Both CO2 samples are enriched in 84Kr and 132Xe, highlighting the potential for the natural composition of CO2 to act as a successful inherent tracer.
Having established both the FRS injection zone background in the gas phase and the inherent geochemical fingerprint in the injected CO2, a mixing analysis can be performed between both fluid components using their known elemental and isotopic compositions. This allows the identification of how the baseline gas would evolve through mixing with the injected CO2 at the FRS. Simply, the observations from this modelling are made based on the assumption of closed system equilibrium and gas phase CO2 migration. Using the two endmembers, mixing lines for ratio-element plots can be defined using established modelling techniques (Langmuir et al., 1977) allowing the resolution of the contribution of the injected CO2 to the natural baseline gas.
Figures 10A, B show mixing of 84Kr/36Ar versus 84Kr and 132Xe/36Ar versus 132Xe as a function of the injected CO2 with the baseline gas mixture (represented by sample GCW1, primarily chosen due to its stratigraphic location within the target injection reservoir, and sample reliability). 84Kr/36Ar and 132Xe/36Ar ratios were chosen due to the higher values in the injected CO2 (.54 and 2.70, respectively) when compared to baseline gas (.024 and .0011, respectively). Within the 132Xe/36Ar system, commingled injected CO2 has the potential to be identified within baseline gas mixtures at percentages as low as .1% (corresponding to 132Xe/36Ar ratio values of .11), highlighting the ratio’s sensitivity due to elevated 132Xe concentrations within the injected gas (Table 2; Figure 10B). Conversely, measurements for 84Kr in the injected CO2 display lower values than in the measured baseline gas (Table 2). The detection level of a resolvable 84Kr/36Ar ratio from injected CO2, taking into account analytical uncertainties, is still reasonable at 5% (corresponding to 84Kr/36Ar values of .034) (Figure 10A). Analytical uncertainties (2σ) for sample GCW1 are 84Kr: 3.87%, 132Xe: 2.88%; 84Kr/36Ar: 5.44%, 132Xe/36Ar: 4.67% while for the injected CO2 are: 84Kr: 3.86%, 132Xe: 2.86%; 84Kr/36Ar: 5.87%, 132Xe/36Ar: 5.27%. Hence, the application of heavy noble gas ratios for tracking of the injected CO2 within the storage reservoir is extremely sensitive. Therefore, the 84Kr/36Ar and 132Xe/36Ar isotope ratios could be used to help identify the arrival of the CO2 gas at the geochemical monitoring well.
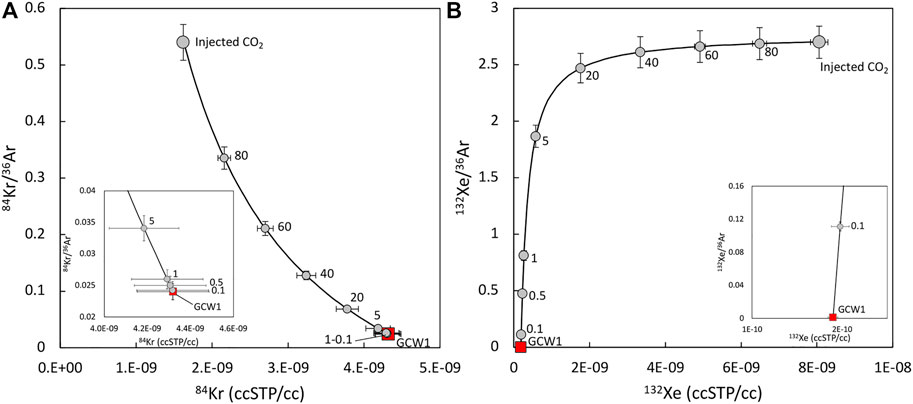
FIGURE 10. Mixing analysis of the injected CO2 with baseline gas sample, GCW1 (red square) for (A) 84Kr/36Ar vs. 84Kr and (B) 132Xe/36Ar vs. 132Xe. Percentages of injected CO2 in the gas mixture are denoted by small grey circles. Inset plots show resolvable percentage values of injected CO2 in the GCW1 baseline gas mixture with error bars relating to analytical uncertainty of the injected CO2 (84Kr: 3.86%, 132Xe: 2.86%; 84Kr/36Ar: 5.87%, 132Xe/36Ar: 5.27%). Analytical uncertainties (2σ) for sample GCW1 are 84Kr: 3.87%, 132Xe: 2.88%; 84Kr/36Ar: 5.44%, 132Xe/36Ar: 4.67%. The 132Xe/36Ar (plot b) shows distinct sensitivity detecting injected CO2 in the baseline gas mixture as low as .1%, while 84Kr/36Ar (plot a) is slightly less sensitive (5%). NB. some percentage error bars on the smallest 84Kr/36Ar and 132Xe/36Ar ratio values are smaller than the symbol sizes.
In order to further demonstrate the applicability of both 84Kr/36Ar and 132Xe/36Ar ratios for monitoring migration in the FRS stratigraphy above the injection zone, Figures 11A, B show the potential distinction between the noble gas fingerprint of the injected CO2, sample GCW1 (as above), sample GCV5 (selected as a less reliable, air contaminated sample and one which is taken from shallower depths in the stratigraphy; Figure 2) and Air. For sample GCV5, with 84Kr/36Ar and 132Xe/36Ar values of .019 ± 3.64% and .00083 ± 3.44%, respectively, the use of the 84Kr/36Ar ratio would become much less reliable. The identification of injected CO2 in the baseline gas mixture would only be possible at levels greater than 60% (84Kr/36Ar ratio values greater than ∼.021) outside of observed error values (Figure 11A). Despite this, Figure 11B shows that the 132Xe/36Ar ratio could in theory still be used to monitor the migration of gas phase CO2 with higher levels of confidence. This again shows the hypothetical identification of injected CO2 in the baseline gas mixture of GCV5 at levels as low as .1% (132Xe/36Ar ratio values of .001), outside of analytical uncertainties, regardless of the degree of air contamination of the sample.
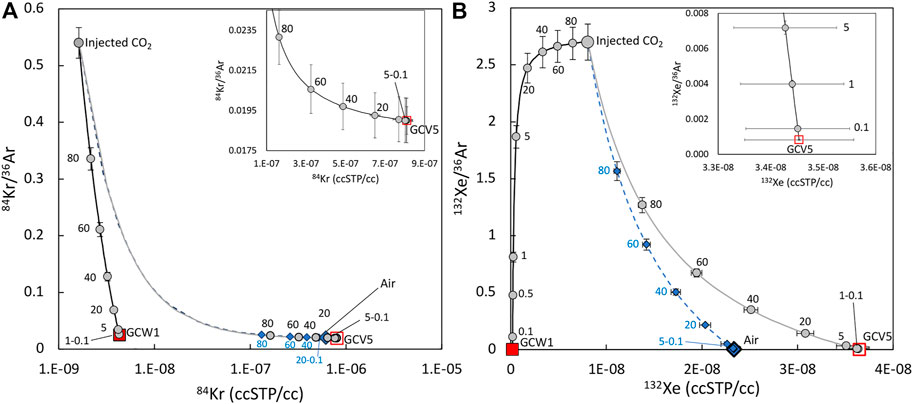
FIGURE 11. Mixing analysis of the injected CO2 with baseline gas sample, GCW1 (red square, black mixing line), baseline gas sample GCV5 (white square with red rim, grey mixing line) and air (large blue diamond, blue dashed mixing line). Percentages of injected CO2 in the sample gas mixtures are denoted by small grey circles and for air by small blue diamonds. Inset plots show resolvable percentage values of injected CO2 in the GCV5 baseline gas mixture with error bars relating to analytical uncertainty of the injected CO2 (84Kr: 3.86%, 132Xe: 2.86%; 84Kr/36Ar: 5.87%, 132Xe/36Ar: 5.27%). Analytical uncertainties for sample GCV5 are 84Kr: 3.00%, 132Xe: 3.01%; 84Kr/36Ar: 3.64%, 132Xe/36Ar: 3.44%. In plot (A), although sensitivity in the shallower gas sample GCV5 is reduced for 84Kr/36Ar (where identification only becomes possible with >60% CO2 in the baseline gas mixture), the sensitivity using the 132Xe/36Ar ratio (B) is still extremely reliable with identification of injected CO2 at levels as low as .1%. NB. some percentage error bars on smallest 84Kr/36Ar and 132Xe/36Ar ratio values are smaller than the symbol sizes.
Hence, our results indicate that monitoring for an increase in 84Kr and 132Xe relative to 36Ar, in addition to bulk gases and a potential increase in methanogenic activity with a distinct δ13CCH4 value, can provide definitive identification of gas phase CO2. This could help to differentiate if an unobserved CO2 increase is due to the injected CO2 or another non-injection related source within the FRS stratigraphy.
Implications for Continuous Sampling at the FRS
The future implications of this study are important in relation to CO2 monitoring projects globally. The FRS site project is unique in that it provides an important link between the large-scale projects injecting large volumes of CO2 at significant depths (e.g., the Quest Facility in Canada) and those that focus on much shallower (10’s of meters) experiments such as in Svelvik in Norway (Eliasson et al., 2018) and at Bozeman, Montana (Spangler et al., 2010). However, there are currently no other projects that are injecting CO2 at similar subsurface depths for leakage monitoring with which to compare the current geochemical baseline results to. Although a limitation, the lack of comparable sites is also an obvious opportunity for future studies to test leakage scenarios into overburden within a range of potential geological storage sites.
Another obvious implication that arises from this study is the limitations and issues of sampling procedures. In particular, this study highlights that it is important to consider the analysis of both noble gases and stable isotopes at different laboratories (Tables 1–Tables 3; Sample analysis Section) and at variable times throughout the sampling campaign. While there appears to be slight differences in the measurements from the laboratories at SUERC, Ottawa and Ohio for both stable isotope and noble gas data, it is more likely that discrepancies are a result of atmospheric contamination from an influx of an air component during the sampling of surface casing vents and as a result of different sampling procedures during the campaign. As shown in Figure 5, variability is evident between samples from the same engineering features, but all samples plot on the same mixing curve between a deep radiogenic gas end member and air, suggesting an atmospheric component is the most likely candidate for the variation in our data. In addition to this, when considering seasonality as a possible cause of variation, assumptions are made when sampling at the FRS that the gases are sourced from lithologies deep enough to not be affected by seasonal variations, ruling out this notion. The observations concerning sample variability are also supported by Utting et al. (2022) in a recent study of FRS gases from surface casing vents using a time series analysis. It appears that there is no consistent change to sample data over time, however some variability was observed and is attributed to atmospheric sources via flushing of gas from the system or lower gas flow rates allowing greater potential for mixing with sources such as air-saturated water. The lack of any measurable change to sample data during the sampling campaign before and after the CO2 injection shown by Utting et al. (2022) is also supported by the results of this study, and further demonstrates that variability from sampling procedures must be considered.
While we attribute the main aspects of data variability to potential inconsistencies in sampling procedures and the lack of one sampling protocol for all measurements taken, it remains a possibility that changes related to the source of the gas may also be a cause. For this reason, this study highlights the importance that fixed sampling protocols and timings are employed for future monitoring programmes such as this to ensure the most reliable data is produced.
Conclusion
Here we present the first characterisation of the geochemical baseline conditions through the range of stratigraphy encountered at the specially constructed Carbon Management Canada Field Research Station (FRS) in Alberta, Canada. We find that CH4 is prevalent throughout the shallow FRS stratigraphy, both in the free gas phase and dissolved in groundwaters. Using a combination of C1/C2+C3 ratios, δ13CCH4 and δDCH4, we determine that the majority of this CH4 is of biogenic origin, highlighting that in situ biogenic activity is actively producing CH4 within the subsurface at the site. This biogenic CH4 production is from both CO2 reduction and fermentation of organic matter pathways. However, gas wetness data indicates a small component of resolvable thermogenic CH4, with the contributions from this source increasing with the depth of sampling. Although mixing or migration can account for this, these are not the only secondary processes affecting CH4 composition. Due to the range in biogenic methanogenesis pathways, oxidation is also likely occurring, leading to the preferential consumption of heavier chained hydrocarbons (C2 and C3).
3He/4He and 4He/20Ne measurements from the majority of samples plot on a mixing line between the sample obtained from the underlying Countess field and the atmosphere. This illustrates that between .1% and 80% of the radiogenic 4He present in the FRS samples could be sourced from the Countess hydrocarbon field endmember and is mixing with atmospheric derived noble gases in the shallow subsurface. Additionally, the gas samples exhibit trends towards high 40Ar* allowing this (as well as 4He) to be a useful discriminant of deep gas in the shallow subsurface and implying a crustal flux throughout the site. Using the measured 4He concentrations in groundwaters, the Westbay and Domestic water wells can be explained by in situ radioactive decay of U and Th in the FRS site host stratigraphy. The slightly higher 4He concentrations identified in the Domestic well compared to the Westbay well may result from 4He accumulation within the Lethbridge Coals over time.
The injected δ13CCO2 exhibits a narrow range, which cannot be compared to the site baseline due to the low CO2 content of all subsurface samples. As there is evidence of methanogenesis at the site, it is currently unknown as to whether this isotopic profile can be utilised as an effective geochemical tracer of CO2 in the shallow subsurface. Methanogenesis may also affect the bulk gas composition at the site, therefore monitoring for an increase in CO2, against a CO2-poor baseline, may also not be successful in isolation. However, whilst the inherent noble gas concentrations in the injected CO2 are depleted in He, Ne and Ar, they are distinctively enriched in the heavy noble gases, 84Kr and 132Xe relative to 36Ar. Based on these observations, mixing analyses can be performed between the injected CO2 and the baseline gas at the FRS. This shows that ratios of 84Kr/36Ar and 132Xe/36Ar are extremely sensitive and have the potential to be used to detect injected CO2 in reliable baseline gas mixtures at percentages as low as 5% and .1%, respectively. The positive implications of this monitoring are also identified via the sensitivity of the 132Xe/36Ar ratios in shallower FRS stratigraphy overlying the injection zone, or in more air-contaminated gas samples.
This study highlights that the combined use of stable isotope, gas composition, radiocarbon and noble gas geochemistry provides a more robust technique for resolving the input of deep sourced crustal fluids in the subsurface than the use of gas composition and stable isotopes alone. This underlines the need for comprehensive and reliable baseline monitoring and an understanding of the subsurface fluid sources and migration pathways present prior to CO2 injection at a proposed storage site. The study further provides a useful baseline of the geochemical fingerprints present within the subsurface fluids and injected CO2 at the FRS site. Importantly, the enrichment in 84Kr and 132Xe relative to 36Ar in the injected CO2, gained from the capture process, presents a novel technique to aid in the subsurface monitoring of CO2, which could be utilised to identify CO2 migration pathways and trapping mechanisms.
Data Availability Statement
The original contributions presented in the study are included in the article/supplementary material, further inquiries can be directed to the corresponding author.
Author Contributions
RU, SG, NU, and DL contributed to the conceptualisation and design of the study. RU wrote the first draft of the manuscript. EM-R and SG designed and wrote the CO2 modelling section. DG, MZ, TD, and FS contributed to the resources, review and editing of the noble gas work. GJ and AB contributed to the resources, review and editing of the stable isotope work. PG contributed to the resources, review and editing of the radiocarbon analysis. SG and RH contributed to the funding and project administration. All authors contributed to manuscript reading and editing prior to submission.
Funding
This work was supported by an EPSRC PhD studentship, with additional support for RU from UKCCSRC and EPSRC NPIF Innovation Placement Funding. Stuart Gilfillan was supported by NERC grant NE/R018049/1, EPSRC grants EP/P026214/1 and EP/K036033/1 and Total E&P. Funding for two radiocarbon analysis was supported through NERC NRCF funding, allocation number 2139.1018. Funding was also provided from the Office of Energy Research and Development, Natural Resources Canada. Funding for the construction of the FRS was provided by the Province of Alberta (Department of Environment and Parks) and from the Government of Canada (Western Economic Diversification).
Conflict of Interest
Author DL was employed by the company Carbon Management Canada. Author DG was employed by Isomass Scientific, Canada, as well as the Scottish Universities Environmental Research Centre. Isomass Scientific does not gain any financial benefit by the publication of this paper.
The remaining authors declare that the research was conducted in the absence of any commercial or financial relationships that could be construed as a potential conflict of interest.
Publisher’s Note
All claims expressed in this article are solely those of the authors and do not necessarily represent those of their affiliated organizations, or those of the publisher, the editors and the reviewers. Any product that may be evaluated in this article, or claim that may be made by its manufacturer, is not guaranteed or endorsed by the publisher.
Acknowledgments
We thank CaMI.FRS JIP subscribers for their support of the Carbon Management Canada Research Inc.’s Field Research Station project, Cenovus Energy and Torxen Energy for providing site and sampling access and Schlumberger Carbon Services for their project management services during development and construction. Terry Donnelly, Terence Donnelly, and Callum Murray of SUERC are thanked for their help and support in laboratory analysis. James Utley of The University of Liverpool is thanked for undertaking XRF analysis of the coal samples. Thanks also go to Gisoo Heydari, Amin Saeedfar, Leon Halwa, and Terri Cheung for their help and knowledge in sample collection at the FRS in July 2017, and the Applied Geochemistry Group at The University of Calgary for their hospitality.
References
Alcalde, J., Flude, S., Wilkinson, M., Johnson, G., Edlmann, K., Bond, C. E., et al. (2018). Estimating Geological CO2 Storage Security to Deliver on Climate Mitigation. Nat. Commun. 9, 2201. doi:10.1038/s41467-018-04423-1
Andrews, J. N., Drimmie, R. J., Loosli, H. H., and Hendry, M. J. (1991). Dissolved Gases in the Milk River Aquifer. Alberta, Canada. doi:10.1016/0883-2927(91)90039-R
Ballentine, C. J., Burgess, R., and Marty, B. (2002). “Tracing Fluid Origin, Transport and Interaction in the Crust,” in Reviews in Mineralogy and Geochemistry, 539–614. doi:10.2138/rmg.2002.47.13
Ballentine, C. J., and Burnard, P. G. (2002). Production, Release and Transport of Noble Gases in the Continental Crust. Rev. Mineralogy Geochem. 47, 481–538. doi:10.2138/rmg.2002.47.12
Blair, N. E., and Aller, R. C. (1995). Anaerobic Methane Oxidation on the Amazon Shelf. Geochimica Cosmochimica Acta 59, 3707–3715. doi:10.1016/0016-7037(95)00277-7
IPCC (2005). in IPCC Special Report on Carbon Dioxide Capture and Storage. Prepared by Working Group III of the Intergovernmental Panel on Climate Change. Editors B. Metz, O. Davidson, H. C. de Coninck, M. Loos, and L. A. Meyer, 442. doi:10.1557/mrs2008.63
Byrne, D. J., Barry, P. H., Lawson, M., and Ballentine, C. J. (2018). Noble Gases in Conventional and Unconventional Petroleum Systems. Geol. Soc. Spec. Publ. 468, 127–149. doi:10.1144/SP468.5
Byrne, D. J., Barry, P. H., Lawson, M., and Ballentine, C. J. (2020). The Use of Noble Gas Isotopes to Constrain Subsurface Fluid Flow and Hydrocarbon Migration in the East Texas Basin. Geochimica Cosmochimica Acta 268, 186–208. doi:10.1016/j.gca.2019.10.001
Capp (2018). Statistical Handbook - Canadian Association of Petroleum Producers- Marketable Natural Gas- Remaining Established. Calgary, AB: CAPP.
Ceglarska-Stefańska, G., and Zarbska, K. (2002). The Competitive Sorption of CO2 and CH4 with Regard to the Release of Methane from Coal. Fuel Process. Technol. 77 (78), 423–429. doi:10.1016/S0378-3820(02)00093-0
Chen, B., Stuart, F. M., Xu, S., Gyӧre, D., and Liu, C. (2019). Evolution of Coal-Bed Methane in Southeast Qinshui Basin, China: Insights from Stable and Noble Gas Isotopes. Chem. Geol. 529, 119298. doi:10.1016/j.chemgeo.2019.119298
Chen, Z., and Osadetz, K. G. (2013). An Assessment of Tight Oil Resource Potential in Upper Cretaceous Cardium Formation, Western Canada Sedimentary Basin. Petroleum Explor. Dev. 40, 344–353. doi:10.1016/S1876-3804(13)60041-5
Cheung, K., Klassen, P., Mayer, B., Goodarzi, F., and Aravena, R. (2010). Major Ion and Isotope Geochemistry of Fluids and Gases from Coalbed Methane and Shallow Groundwater Wells in Alberta, Canada. Appl. Geochem. 25, 1307–1329. doi:10.1016/j.apgeochem.2010.06.002
Cheung, T. T. (2019). Establishing High-Resolution Hydrogeological, Geochemical and Isotopic Baseline Conditions of the Fresh Water Zone at a Field Research Site Near Brooks. Alberta, Canada: University of Calgary. (Unpublished Masters thesis).
Clarke, W. B., Jenkins, W. J., and Top, Z. (1976). Determination of Tritium by Mass Spectrometric Measurement of 3He. Int. J. Appl. Radiat. Isotopes 27, 515–522. doi:10.1016/0020-708X(76)90082-X
Coplen, T. B. (1995). Reporting of Stable Hydrogen, Carbon, and Oxygen Isotopic Abundances. Geothermics 24, 707–712. doi:10.1016/0375-6505(95)00024-0
Craig, H. (1957). Isotopic Standards for Carbon and Oxygen and Correction Factors for Mass-Spectrometric Analysis of Carbon Dioxide. Geochimica Cosmochimica Acta 12, 133–149. doi:10.1016/0016-7037(57)90024-8
Darrah, T. H., and Poreda, R. J. (2012). Evaluating the Accretion of Meteoritic Debris and Interplanetary Dust Particles in the GPC-3 Sediment Core Using Noble Gas and Mineralogical Tracers. Geochimica Cosmochimica Acta 84, 329–352. doi:10.1016/J.GCA.2012.01.030
Darrah, T. H., Tedesco, D., Tassi, F., Vaselli, O., Cuoco, E., and Poreda, R. J. (2013). Gas Chemistry of the Dallol Region of the Danakil Depression in the Afar Region of the Northern-Most East African Rift. Chem. Geol. 339, 16–29. doi:10.1016/j.chemgeo.2012.10.036
Darrah, T. H., Vengosh, A., Jackson, R. B., Warner, N. R., and Poreda, R. J. (2014). Noble Gases Identify the Mechanisms of Fugitive Gas Contamination in Drinking-Water Wells Overlying the Marcellus and Barnett Shales. Proc. Natl. Acad. Sci. U. S. A. 111, 14076–14081. doi:10.1073/pnas.1322107111
Dawson, F. M., Evans, C. G., Marsh, R., and Richardson, R. (1994). Uppermost Creataceous and Tertiary Strata of the Western Canada Sedimentary Basin. Geol. Atlas West. Can. Sediment. Basin, 387–407.
Donnelly, T., Waldron, S., Tait, A., Dougans, J., and Bearhop, S. (2001). Hydrogen Isotope Analysis of Natural Abundance and Deuterium-Enriched Waters by Reduction over Chromium On-Line to a Dynamic Dual Inlet Isotope-Ratio Mass Spectrometer. Rapid Commun. Mass Spectrom. 15, 1297–1303. doi:10.1002/rcm.361
Eberhardt, P., Eugster, O., and Marti, K. (1965). Notizen: A Redetermination of the Isotopic Composition of Atmospheric Neon. Zeitschrift fur Naturforschung - Sect. A J. Phys. Sci. 20, 623–624. doi:10.1515/zna-1965-0420
Eliasson, P., Ringstad, C., Grimstad, A., Jordan, M., and Romdhane, A. (2018). Svelvik CO2 Field Lab: Upgrade and Experimental Campaign. European Association of Geoscientists & EngineersFifth CO2 Geological Storage Workhop, 1–5. doi:10.3997/2214-4609.201802973
Eymold, W. K., Swana, K., Moore, M., Whyte, C. J., Harkness, J. S., Talma, S., et al. (2018). Hydrocarbon-Rich Groundwater above Shale-Gas Formations: A Karoo Basin Case Study. Groundwater 56, 204–224. doi:10.1111/gwat.12637
Feitz, A., Schroder, I., Phillips, F., Coates, F., Neganghi, K., Day, S., et al. (2018). The Ginninderra CH4 and CO2 Release Experiment: An Evaluation of Gas Detection and Quantification Techniques. Int. J. Greenh. Gas Control 70, 202–224. doi:10.1016/j.ijggc.2017.11.018
Fenton, M. M., Schreiner, B. T., Nielsen, E., and Pawlowicz, J. G. (1994). Quaternary Geology of the Western Plains. Geol. Atlas West. Can. Sediment. Basin, 413–420.
Findlay, P., Kalleberg, A. L., and Warhurst, C. (2013). The Challenge of Job Quality. Hum. Relat. 66, 441–451. doi:10.1177/0018726713481070
Flores, R. M. (2014). “Introduction and Principles,” in Coal and Coalbed Gas: Fueling the Future. Editor R. M. Flores (Amsterdam, Netherlands: Elsevier), 1–40. doi:10.1016/b978-0-12-396972-9.00001-x
Flude, S., Györe, D., Stuart, F. M., Zurakowska, M., Boyce, A. J., Haszeldine, R. S., et al. (2017). The Inherent Tracer Fingerprint of Captured CO2. Int. J. Greenh. Gas Control 65, 40–54. doi:10.1016/j.ijggc.2017.08.010
Flude, S., Johnson, G., Gilfillan, S. M. V., and Haszeldine, R. S. (2016). Inherent Tracers for Carbon Capture and Storage in Sedimentary Formations: Composition and Applications. Environ. Sci. Technol. 50, 7939–7955. doi:10.1021/acs.est.6b01548
Freeman, S., Bishop, P., Bryant, C., Cook, G., Dougans, D., Ertunc, T., et al. (2007). The SUERC AMS Laboratory after 3 Years. Nucl. Instrum. Methods Phys. Res. Sect. B Beam Interact. Mater. Atoms 259, 66–70. doi:10.1016/j.nimb.2007.01.312
Garnett, M. H., Murray, C., Gulliver, P., and Ascough, P. L. (2019). Radiocarbon Analysis of Methane at the NERC Radiocarbon Facility (East Kilbride). Radiocarbon 61, 1477–1487. doi:10.1017/rdc.2019.3
Gilfillan, S. M. V., Wilkinson, M., Haszeldine, R. S., Shipton, Z. K., Nelson, S. T., and Poreda, R. J. (2011). He and Ne as Tracers of Natural CO2 Migration up a Fault from a Deep Reservoir. Int. J. Greenh. Gas Control 5, 1507–1516. doi:10.1016/j.ijggc.2011.08.008
Gilfillan, S. M. V., Ballentine, C. J., Holland, G., Blagburn, D., Sherwood Lollar, B., Stevens, S., et al. (2008). The Noble Gas Geochemistry of Natural CO2 Gas Reservoirs from the Colorado Plateau and Rocky Mountain Provinces, USA. Geochimica Cosmochimica Acta 72, 1174–1198. doi:10.1016/J.GCA.2007.10.009
Gilfillan, S. M. V., Sherk, G. W., Poreda, R. J., and Haszeldine, R. S. (2017). Using Noble Gas Fingerprints at the Kerr Farm to Assess CO2 Leakage Allegations Linked to the Weyburn-Midale CO2 Monitoring and Storage Project. Int. J. Greenh. Gas Control 63, 215–225. doi:10.1016/j.ijggc.2017.05.015
Gonfiantini, R. (1984). Stable Isotope Reference Samples for Geochemical and Hydrological Investigations. Stable Isotope Reference Samples Geochem. Hydrological Investigations 35, 426. doi:10.1016/0020-708X(84)90059-0
Györe, D., Gilfillan, S. M. V., and Stuart, F. M. (2017). Tracking the Interaction between Injected CO2 and Reservoir Fluids Using Noble Gas Isotopes in an Analogue of Large-Scale Carbon Capture and Storage. Appl. Geochem. 78, 116–128. doi:10.1016/j.apgeochem.2016.12.012
Györe, D., McKavney, R., Gilfillan, S. M. V., and Stuart, F. M. (2018). Fingerprinting Coal-Derived Gases from the UK. Chem. Geol. 480, 75–85. doi:10.1016/j.chemgeo.2017.09.016
Györe, D., Stuart, F. M., Gilfillan, S. M. V., and Waldron, S. (2015). Tracing Injected CO2 in the Cranfield Enhanced Oil Recovery Field (MS, USA) Using He, Ne and Ar Isotopes. Int. J. Greenh. Gas Control 42, 554–561. doi:10.1016/J.IJGGC.2015.09.009
Györe, D., Tait, A., Hamilton, D., and Stuart, F. M. (2019). The Formation of NeH+ in Static Vacuum Mass Spectrometers and Re-determination of 21Ne/20Ne of Air. Geochimica Cosmochimica Acta 263, 1–12. doi:10.1016/j.gca.2019.07.059
Hallmann, C., and Summons, R. E. (2013). “Paleobiological Clues to Early Atmospheric Evolution,” in Treatise on Geochemistry. 2nd ed. (Amsterdam, Netherlands: Elsevier), Vol. 6, 139–155. doi:10.1016/B978-0-08-095975-7.01305-X
Hanson, R. S., and Hanson, T. E. (1996). Methanotrophic Bacteria. Microbiol. Rev. 60, 439–471. doi:10.1128/mr.60.2.439-471.1996
Hendry, M. J., Lee Barbour, S., Schmeling, E. E., Mundle, S. O. C., and Huang, M. (2016). Fate and Transport of Dissolved Methane and Ethane in Cretaceous Shales of the Williston Basin, Canada. Water Resour. Res. 52, 6440–6450. doi:10.1002/2016WR019047
Hendry, M. J., Schmeling, E. E., Barbour, S. L., Huang, M., and Mundle, S. O. C. (2017). Fate and Transport of Shale-Derived, Biogenic Methane. Sci. Rep. 7, 4881. doi:10.1038/s41598-017-05103-8
Holland, G., and Gilfillan, S. (2013). “Application of Noble Gases to the Viability of CO2 Storage,” in The Noble Gases as Geochemical Tracers. Advances in Isotope Geochemistry. Editor P. Burnard (Berlin: Springer Berlin/Heidelburg), 177.
Humez, P., Lions, J., Négrel, P., and Lagneau, V. (2014). CO2 Intrusion in Freshwater Aquifers: Review of Geochemical Tracers and Monitoring Tools, Classical Uses and Innovative Approaches. Appl. Geochem.
Humez, P., Mayer, B., Nightingale, M., Becker, V., Kingston, A., Taylor, S., et al. (2016). Redox Controls on Methane Formation, Migration and Fate in Shallow Aquifers. Hydrology Earth Syst. Sci. 20, 2759–2777. doi:10.5194/hess-20-2759-2016
Iversen, N., and Jorgensen, B. B. (1985). Anaerobic Methane Oxidation Rates at the Sulfate-Methane Transition in Marine Sediments from Kattegat and Skagerrak (Denmark)1. Limnol. Oceanogr. 30, 944–955. doi:10.4319/lo.1985.30.5.0944
James, A. T. (1983). Correlation of Natural Gas by Use of Carbon Isotopic Distribution between Hydrocarbon Components. Am. Assoc. Petroleum Geol. Bull. 67, 1176–1191. doi:10.1306/03b5b722-16d1-11d7-8645000102c1865d
Johnson, G., Mayer, B., Shevalier, M., Nightingale, M., and Hutcheon, I. (2011). Tracing the Movement of CO2 Injected into a Mature oilfield.Using Carbon Isotope Abundance Ratios: the Example of the Pembina Cardium CO2 Monitoring Project. Int. J. Greenh. Gas Control 5, 933–941. doi:10.1016/j.ijggc.2011.02.003
Johnson, G., Raistrick, M., Mayer, B., Shevalier, M., Taylor, S., Nightingale, M., et al. (2009). The Use of Stable Isotope Measurements for Monitoring and Verification of CO2 Storage. Energy Procedia 1, 2315–2322. doi:10.1016/j.egypro.2009.01.301
Jones, D. G., Barkwith, A. K. A. P., Hannis, S., Lister, T. R., Gal, F., Graziani, S., et al. (2014). Monitoring of Near Surface Gas Seepage from a Shallow Injection Experiment at the CO2 Field Lab, Norway. Int. J. Greenh. Gas Control 28, 300–317. doi:10.1016/j.ijggc.2014.06.021
Ju, Y. J., Beaubien, S. E., Lee, S., Kaown, D., Hahm, D., Lee, S., et al. (2019). Application of Natural and Artificial Tracers to Constrain CO2 Leakage and Degassing in the K-COSEM Site, South Korea. Int. J. Greenh. Gas Control 86, 211–225. doi:10.1016/j.ijggc.2019.05.002
Ju, Y. J., Lee, S. S., Kaown, D., Lee, K. K., Gilfillan, S. M. V., Hahm, D., et al. (2020). Noble Gas as a Proxy to Understand the Evolutionary Path of Migrated CO2 in a Shallow Aquifer System. Appl. Geochem. 118, 104609. doi:10.1016/j.apgeochem.2020.104609
Kendall, C., Sklash, M. G., and Bullen, T. D. (1995). Isotope Tracers of Water and Solute Sources in Catchments. Solute Model. Catchment Syst., 261–303.
Kikuta, K., Hongo, S., Tanase, D., and Ohsumi, T. (2005). “Field Test of CO2 Injection in Nagaoka, Japan,” in Proceedings of the 7th International Conference on Greenhouse Gas Control Technologies. Editors E. S. Rubin, D. W. Keith, and C. F. Gilboy (Oxford, England: Elsevier), Vol. 2, 1367. –1372. doi:10.1016/B978-008044704-9/50151-8
King, G. M. (1990). Dynamics and Controls of Methane Oxidation in a Danish Wetland Sediment. FEMS Microbiol. Ecol. 7, 309–323. doi:10.1111/j.1574-6941.1990.tb01698.x
Kipfer, R., Aeschbach-Hertig, W., Peeters, F., and Stute, M. (2002). Noble Gases in Lakes and Ground Waters. Rev. Mineralogy Geochem. 47, 615–700. doi:10.2138/rmg.2002.47.14
Kotarba, M. J. (2001). Composition and Origin of Coalbed Gases in the Upper Silesian and Lublin Basins, Poland. Org. Geochem. 32, 163–180. doi:10.1016/S0146-6380(00)00134-0
Kotarba, M. J., and Rice, D. D. (2001). Composition and Origin of Coalbed Gases in the Lower Silesian Basin, Southwest Poland. Appl. Geochem. 16, 895–910. doi:10.1016/S0883-2927(00)00058-5
La Croix, A. D., Gingras, M. K., Pemberton, S. G., Mendoza, C. A., MacEachern, J. A., and Lemiski, R. T. (2013). Biogenically Enhanced Reservoir Properties in the Medicine Hat Gas Field, Alberta, Canada. Mar. Petroleum Geol. 43, 464–477. doi:10.1016/j.marpetgeo.2012.12.002
Lackey, G., and Rajaram, H. (2019). Modeling Gas Migration, Sustained Casing Pressure, and Surface Casing Vent Flow in Onshore Oil and Gas Wells. Water Resour. Res. 55, 298–323. doi:10.1029/2018WR024066
Langmuir, C. H., Vocke, R. D., Hanson, G. N., and Hart, S. R. (1977). A General Mixing Equation with Applications to Icelandic Basalts. Earth Planet. Sci. Lett. 37, 380–392. doi:10.1016/0012-821x(78)90053-5
Lawton, D. C., Dongas, J., Osadetz, K., Saeedfar, A., and Macquet, M. (2019). Development and Analysis of a Geostatic Model for Shallow CO2 Injection at the Field Research Station, Southern Alberta, Canada. Geophys. Geosequestration, 280–296. doi:10.1017/9781316480724.017
Lawton, D. C., Osadetz, K. G., and Saeedfar, A. (2017). CCS Monitoring Technology Innovation at the CaMI Field Research Station, Alberta, Canada. EAGE/SEG Research Workshop 2017 on Geophysical Monitoring of CO2. Inject. CCS CO2-EOR. 5–9. doi:10.3997/2214-4609.201701930
Lehmann, B. E., Niklaus Waber, H., Tolstikhin, I., Kamensky, I., Gannibal, M., Kalashnikov, E., et al. (2003). Helium in Solubility Equilibrium with Quartz and Porefluids in Rocks: A New Approach in Hydrology. Geophys. Res. Lett. 30, 1128. doi:10.1029/2002GL016074
Lidstrom, M. E., and Somers, L. (1984). Seasonal Study of Methane Oxidation in Lake Washington. Appl. Environ. Microbiol. 47, 1255–1260. doi:10.1128/aem.47.6.1255-1260.1984
Lopes, F., Viollier, E., Thiam, A., Michard, G., Abril, G., Groleau, A., et al. (2011). Biogeochemical Modelling of Anaerobic vs. Aerobic Methane Oxidation in a Meromictic Crater Lake (Lake Pavin, France). Appl. Geochem. 26, 1919–1932. doi:10.1016/j.apgeochem.2011.06.021
Mackintosh, S., and Ballentine, C. (2012). Using 3He/4He Isotope Ratios to Identify the Source of Deep Reservoir Contributions to Shallow Fluids and Soil Gas. Chem. Geol. 304-305, 142–150. doi:10.1016/j.chemgeo.2012.02.006
Macquet, M., Lawton, D. C., Saeedfar, A., and Osadetz, K. G. (2019). A Feasibility Study for Detection Thresholds of CO2 at Shallow Depths at the CAMI Field Research Station, Newell County, Alberta, Canada. Pet. Geosci. 25, 509–518. doi:10.1144/petgeo2018-135
Mamyrin, B. A., Anufrijev, G. S., Kamenskii, I. L., and Tolstikhin, I. N. (1970). Determination of the Isotopic Composition of Atmospheric Helium. Geochem. Int. 7, 498.
Mamyrin, B. A., and Tolstikhin, I. N. (1984). Helium Isotopes in Nature. doi:10.1016/0016-7037(84)90235-7
Mark, D. F., Stuart, F. M., and de Podesta, M. (2011). New High-Precision Measurements of the Isotopic Composition of Atmospheric Argon. Geochimica Cosmochimica Acta 75, 7494–7501. doi:10.1016/J.GCA.2011.09.042
Martens, S., Liebscher, A., Möller, F., Henninges, J., Kempka, T., Lüth, S., et al. (2013). “CO2 Storage at the Ketzin Pilot Site, Germany: Fourth Year of Injection, Monitoring, Modelling and Verification,” in Energy Procedia, 6434. –6443. doi:10.1016/j.egypro.2013.06.573
Martini, A. M., Walter, L. M., Ku, T. C. W., Budai, J. M., McIntosh, J. C., and Schoell, M. (2003). Microbial Production and Modification of Gases in Sedimentary Basins: A Geochemical Case Study from a Devonian Shale Gas Play, Michigan Basin. Am. Assoc. Petroleum Geol. Bull. 87, 1355–1375. doi:10.1306/031903200184
Matveeva, T., and Kafle, B. (2009). Sandstone-Hosted Uranium in Southern Alberta: 2007 and 2008 Study Results Energy Resources Conservation Board, ERCB/AGS Open File Report 2009-12. Edmonton, AB: Alberta Geological Survey.
Mayer, B., Humez, P., Becker, V., Nightingale, M., Ing, J., Kingston, A., et al. (2015). Prospects and Limitations of Chemical and Isotopic Groundwater Monitoring to Assess the Potential Environmental Impacts of Unconventional Oil and Gas Development. Procedia Earth Planet. Sci. 13, 320–323. doi:10.1016/j.proeps.2015.07.076
Mayer, B., Humez, P., Osselin, F., Cheung, T., Becker, V., Parker, B., et al. (2018). “A Comprehensive Approach for Assessing Potential Fugitive Gas Migration Associated with Petroleum Development from Low Permeability Reservoirs: Case Studies from Western Canada,” in 20th EGU General Assembly, EGU2018, Vienna, Austria, April 4–13, 2018, 5634.
Michael, K., Avijegon, A., Ricard, L., Myers, M., Tertyshnikov, K., Pevzner, R., et al. (2020). A Controlled CO2 Release Experiment in a Fault Zone at the In-Situ Laboratory in Western Australia. Int. J. Greenh. Gas Control 99, 103100. doi:10.1016/j.ijggc.2020.103100
Moore, M. T., Vinson, D. S., Whyte, C. J., Eymold, W. K., Walsh, T. B., and Darrah, T. H. (2018). Differentiating between Biogenic and Thermogenic Sources of Natural Gas in Coalbed Methane Reservoirs from the Illinois Basin Using Noble Gas and Hydrocarbon Geochemistry. Geol. Soc. Spec. Publ. 468, 151–188. doi:10.1144/SP468.8
Moritz, A., Hélie, J. F., Pinti, D. L., Larocque, M., Barnetche, D., Retailleau, S., et al. (2015). Methane Baseline Concentrations and Sources in Shallow Aquifers from the Shale Gas-Prone Region of the St. Lawrence Lowlands (Quebec, Canada). Environ. Sci. Technol. 49, 4765–4771. doi:10.1021/acs.est.5b00443
Mossop, G. D., and Shetsen, I. (1994). “Introduction to the Geological Atlas,” in Geological Atlas of the Western Canada Sedimentary Basin. Editors G. Mossop, and I. Shetsen (Edmonton, AB: Alberta Geological Survey).
Mrrttinen, A., Becker, V., van Geldern, R., Würdemann, H., Morozova, D., Zimmer, M., et al. (2010). Carbon and Oxygen Isotope Indications for CO2 Behaviour after Injection: First Results from the Ketzin Site (Germany). Int. J. Greenh. Gas Control 4, 1000–1006. doi:10.1016/j.ijggc.2010.02.005
O’Connell, S. (2003). “The Unknown Giants-Low-Permeability Shallow Gas Reservoirs of Southern Alberta and Saskatchewan, Canada,” in Canadian Society of Exploration Geophysicists, Canada. Conference Abstracts.
OGJ (2018). Worldwide Oil, Natural Gas Reserves Exhibit Marginal Increaseshttps:. Nashville, Tennessee: Oil and Gas Journal. http//www.ogj.com/exploration-development/reserves/article/17232353/worldwide-oil-natural-gas-reserves-exhibit-marginal-increases.
Osadetz, K. G., Mort, A., Snowdon, L. R., Lawton, D. C., Chen, Z., and Saeedfar, A. (2018). Western Canada Sedimentary Basin Petroleum Systems: A Working and Evolving Paradigm. Interpretation 6, SE63–SE98. doi:10.1190/int-2017-0165.1
Petroleum Technology Research Centre, (2011). Response to a Soil Gas Study by Petro-Find Geochem Ltd.Response to a Soil Gas Study by Petro-Find. Regina, SK: Geochem Ltd.
Pujol, M., Van den Boorn, S., Bourdon, B., Brennwald, M., and Kipfer, R. (2018). Physical Processes Occurring in Tight Gas Reservoirs from Western Canadian Sedimentary Basin: Noble Gas Signature. Chem. Geol. 480, 128–138. doi:10.1016/j.chemgeo.2017.12.011
Raistrick, M., Mayer, B., Shevalier, M., Perez, R. J., Hutcheon, I., Perkins, E., et al. (2006). Using Chemical and Isotopic Data to Quantify Ionic Trapping of Injected Carbon Dioxide in Oil Field Brines. Environ. Sci. Technol. 40, 6744–6749. doi:10.1021/es060551a
Research Council of Alberta, (1956). Round-table Conference on Groundwater in Alberta. Edmonton, AB: Research Council of Alberta, RCA/AGS Earth Sciences, 84. Report 1956-01.
Rogelj, J., Shindell, D., Jiang, K., Fifita, S., Forster, P., Ginzburg, V., et al. (2018). “Mitigation Pathways Compatible with 1.5°C in the Context of Sustainable Development,” in Global Warming of 1.5°C. An IPCC Special Report on the Impacts of Global Warming of 1.5°C above Pre-industrial Levels and Related Global Greenhouse Gas Emission Pathways, in the Context of Strengthening the Global Response to the Threat of Climate Change, Sustainable Development, and Efforts to Eradicate Poverty. Editors V. Masson-Delmotte, P. Zhai, H.-O. Pörtner, D. Roberts, J. Skea, P. R. Shuklaet al. (Geneva, Switzerland: Mitigation Pathways Compatible with 1.5°C in the Context of Sustainable Development).
Rudd, J. W. M., and Hamilton, R. D. (1975). Two Samplers for Monitoring Dissolved Gases in Lake Water and Sediments. Limnol. Oceanogr. 20, 902–906. doi:10.4319/lo.1975.20.5.0902
Schoell, M. (1983). Genetic Characterization of Natural Gases. Am. Assoc. Petroleum Geol. Bull. 67 (12), 2225.
Scott, V., Gilfillan, S., Markusson, N., Chalmers, H., and Haszeldine, R. S. (2012). Last Chance for Carbon Capture and Storage. Nat. Clim. Change 3, 105–111. doi:10.1038/nclimate1695
Serno, S., Johnson, G., LaForce, T. C., Ennis-King, J., Haese, R. R., Boreham, C. J., et al. (2016). Using Oxygen Isotopes to Quantitatively Assess Residual CO2 Saturation during the CO2CRC Otway Stage 2B Extension Residual Saturation Test. Int. J. Greenh. Gas Control 52, 73–83. doi:10.1016/j.ijggc.2016.06.019
Sheldon, A. L., Solomon, D. K., Poreda, R. J., and Hunt, A. (2003). Radiogenic Helium in Shallow Groundwater within a Clay till, Southwestern Ontario. Water Resour. Res. 39 (12), 1797. doi:10.1029/2002WR001797
Sherwood Lollar, B., and Ballentine, C. J. (2009). Insights into Deep Carbon Derived from Noble Gases. Nat. Geosci. 2, 543–547. doi:10.1038/ngeo588
Slota, P. J., Jull, A. J. T., Linick, T. W., and Toolin, L. J. (1987). Preparation of Small Samples for 14C Accelerator Targets by Catalytic Reduction of CO. Radiocarbon 29, 303–306. doi:10.1017/S0033822200056988
Smith, K. L., Steven, M. D., Jones, D. G., West, J. M., Coombs, P., Green, K. A., et al. (2013). “Environmental Impacts of CO2 Leakage: Recent Results from the ASGARD Facility,” in Energy Procedia (UK, 791. –799. doi:10.1016/j.egypro.2013.05.169
Solomon, D. K., Hunt, A., and Poreda, R. J. (1996). Source of Radiogenic Helium 4 in Shallow Aquifers: Implications for Dating Young Groundwater. Water Resour. Res. 32 (6), 1805–1813. doi:10.1029/96WR00600
Soltanian, M. R., Amooie, M. A., Cole, D. R., Darrah, T. H., Graham, D. E., Pfiffner, S. M., et al. (2018). Impacts of Methane on Carbon Dioxide Storage in Brine Formations. Groundwater 56, 176–186. doi:10.1111/gwat.12633
Spangler, L. H., Dobeck, L. M., Repasky, K. S., Nehrir, A. R., Humphries, S. D., Barr, J. L., et al. (2010). A Shallow Subsurface Controlled Release Facility in Bozeman, Montana, USA, for Testing Near Surface CO2 Detection Techniques and Transport Models. Environ. Earth Sci. 60, 227–239. doi:10.1007/s12665-009-0400-2
Stalker, L., Boreham, C., Underschultz, J., Freifeld, B., Perkins, E., Schacht, U., et al. (2015). Application of Tracers to Measure, Monitor and Verify Breakthrough of Sequestered CO2 at the CO2CRC Otway Project, Victoria, Australia. Chem. Geol. 399, 2–19. doi:10.1016/j.chemgeo.2014.12.006
Stolper, D. A., Martini, A. M., Clog, M., Douglas, P. M., Shusta, S. S., Valentine, D. L., et al. (2015). Distinguishing and Understanding Thermogenic and Biogenic Sources of Methane Using Multiply Substituted Isotopologues. Geochimica Cosmochimica Acta 161, 219–247. doi:10.1016/j.gca.2015.04.015
Strapoć, D., Mastalerz, M., Dawson, K., Macalady, J., Callaghan, A. V., Wawrik, B., et al. (2011). Biogeochemistry of Microbial Coal-Bed Methane. Annu. Rev. Earth Planet. Sci. 39, 617–656. doi:10.1146/annurev-earth-040610-133343
Stuiver, M., and Polach, H. A. (1977). Reporting of 14C Data. Radiocarbon 19, 355–363. doi:10.1017/s0033822200003672
Stute, M., Sonntag, C., Deák, J., and Schlosser, P. (1992). Helium in Deep Circulating Groundwater in the Great Hungarian Plain: Flow Dynamics and Crustal and Mantle Helium Fluxes. Geochim. Cosmochim. Acta 56 (5), 2051–2067. doi:10.1016/0016-7037(92)90329-H
Tassi, F., Fiebig, J., et al. Tassi, F., Fiebig, J., Nocentini, M., and Vaselli, O. (2010). Carbon Isotope Exchange between CO2 and CH4 in Hydrothermal Fluids from the Tuscan-Roman and Campanian Degassing Systems (Central-southern Italy). AGUFM, V21E.
Tilley, B. J., and Muehlenbachs, K. (2012). “Fingerprinting of Gas Contaminating Groundwater and Soil in a Petroliferous Region, Alberta, Canada,” in Environmental Forensics: Proceedings of the 2011 INEF Conference. Editors Robert D. Morrison, and Gwen O’Sullivan (London, United Kingdom: Royal Society of Chemistry), 115–125. doi:10.1039/9781849734967-00115
Torgersen, T., and Ivey, G. N. (1985). Helium Accumulation in Groundwater. II: A Model for the Accumulation of the Crustal 4He Degassing. Flux 49, 2445–2452. doi:10.1016/0016-7037(85)90244-3
Tyne, R. L., Barry, P. H, Lawson, M., Byrne, D. J., Warr, O., Xie, H., et al. (2021). Rapid Microbial Methanogenesis during CO2 Storage in Hydrocarbon Reservoirs. Nat. Dec 600 (7890), 670–674. doi:10.1038/s41586-021-04153-3
UNFCCC (2015). “Report of the Conference of the Parties on its Twenty-First Session, Held in Paris from 30 November to 13 December 2015,” in Addendum-Part Two: Action Taken by the Conference of the Parties.
Utting, N., Osadetz, K., Darrah, T. H., Brennwald, M. S., Mayer, B., and Lawton, D. (2022). Methods and Benefits of Measuring Non-hydrocarbon Gases from Surface Casing Vents. Int. J. Environ. Sci. Technol 19 (9). doi:10.1007/s13762-022-04300-x
Vugrinovich, R. (1988). Relationships between Regional Hydrogelogy and Hydrocarbon Occurences in Michigan, USA. J. Petroleum Geol. 11, 429–442. doi:10.1111/j.1747-5457.1988.tb00830.x
Weber, U. W., Kipfer, R., Horstmann, E., Ringrose, P., Kampman, N., Tomonaga, Y., et al. (2021). Noble Gas Tracers in Gas Streams at Norwegian CO2 Capture Plants. Int. J. Greenh. Gas Control 106, 103238. doi:10.1016/j.ijggc.2020.103238
Whiticar, M. J. (1999). Carbon and Hydrogen Isotope Systematics of Bacterial Formation and Oxidation of Methane. Chem. Geol. 161, 291–314. doi:10.1016/S0009-2541(99)00092-3
Whiticar, M. J., and Faber, E. (1986). Methane Oxidation in Sediment and Water Column Environments-Isotope Evidence. Org. Geochem. 10, 759–768. doi:10.1016/S0146-6380(86)80013-4
Whiticar, M. J., Faber, E., and Schoell, M. (1986). Biogenic Methane Formation in Marine and Freshwater Environments: CO2 Reduction vs. Acetate Fermentation-Isotope Evidence. Geochimica Cosmochimica Acta 50, 693–709. doi:10.1016/0016-7037(86)90346-7
Widdel, F., and Rabus, R. (2001). Anaerobic Biodegradation of Saturated and Aromatic Hydrocarbons. Curr. Opin. Biotechnol. 12, 259–276. doi:10.1016/S0958-1669(00)00209-3
Wright, G. N., McMechan, M. E., and Potter, D. E. G. (1994). Structure and Architecture of the Western Canada Sedimentary Basin. Geol. Atlas West. Can. Sediment. Basin, 25.
Wycherley, H., Fleet, A., and Shaw, H. (1999). Some Observations on the Origins of Large Volumes of Carbon Dioxide Accumulations in Sedimentary Basins. Mar. Petrol. Geol. 16, 489–494. doi:10.1016/s0264-8172(99)00047-1
Keywords: isotopes, geochemistry, CCS, monitoring, baseline, storage, migration, noble gas
Citation: Utley RE, Martin-Roberts E, Utting N, Johnson G, Györe D, Zurakowska M, Stuart FM, Boyce AJ, Darrah TH, Gulliver P, Haszeldine RS, Lawton D and Gilfillan SMV (2023) Multi-Isotope Geochemical Baseline Study of the Carbon Management Canada Research Institutes CCS Field Research Station (Alberta, Canada), Prior to CO2 Injection. Earth Sci. Syst. Soc. 3:10069. doi: 10.3389/esss.2023.10069
Received: 29 July 2022; Accepted: 03 January 2023;
Published: 16 January 2023.
Edited by:
Stephanie Walker, Boston College, United StatesReviewed by:
Stephanie Flude, University of Edinburgh, United KingdomClare E. Bond, University of Aberdeen, United Kingdom
Copyright © 2023 Utley, Martin-Roberts, Utting, Johnson, Györe, Zurakowska, Stuart, Boyce, Darrah, Gulliver, Haszeldine, Lawton and Gilfillan. This is an open-access article distributed under the terms of the Creative Commons Attribution License (CC BY). The use, distribution or reproduction in other forums is permitted, provided the original author(s) and the copyright owner(s) are credited and that the original publication in this journal is cited, in accordance with accepted academic practice. No use, distribution or reproduction is permitted which does not comply with these terms.
*Correspondence: Emma Martin-Roberts, Emma.Martin-Roberts@ed.ac.uk
†Present address: Rachel E. Utley, BP International Ltd., Sunbury-on-Thames, United Kingdom