 Christopher J. M. Lawley1*
 Matthew G. E. Mitchell2
 Diana Stralberg3
 Richard Schuster4Eliot McIntire5Joseph R. Bennett6
- 1Geological Survey of Canada, Natural Resources Canada, Ottawa, ON, Canada
- 2Faculty of Land and Food Systems, University of British Columbia, Vancouver, BC, Canada
- 3Northern Forestry Centre, Canadian Forest Service, Natural Resources Canada, Edmonton, AB, Canada
- 4Nature Conservancy of Canada, Toronto, ON, Canada
- 5Pacific Forestry Centre, Canadian Forest Service, Natural Resources Canada, Victoria, BC, Canada
- 6Department of Biology, Institute of Environmental and Interdisciplinary Science, Carleton University, Ottawa, ON, Canada
Electrification of Canada’s energy and transport sectors is essential to achieve net-zero emissions by 2050 and will require a vast amount of raw materials. A large proportion of these critical raw materials are expected to be sourced from as yet undiscovered mineral deposits, which has the potential to accelerate environmental pressures on natural ecosystems. Herein we overlay new prospectivity model results for a major source of Canada’s battery minerals (i.e., magmatic Ni ± Cu ± Co ± PGE mineral systems) with five ecosystem services (i.e., freshwater resources, carbon, nature-based recreation, species at risk, climate-change refugia) and gaps in the current protected-area network to identify areas of high geological potential with lower ecological risk. New prospectivity models were trained on high-resolution geological and geophysical survey compilations using spatial cross-validation methods. The area under the curve for the receive operating characteristics (ROC) plot and the preferred gradient boosting machines model is 0.972, reducing the search space for more than 90% of deposits in the test set by 89%. Using the inflection point on the ROC plot as a threshold, we demonstrate that 16% of the most prospective model cells partially overlap with the current network of protected and other conserved areas, further reducing the search space for new critical mineral deposits. The vast majority of the remaining high prospectivity cells correspond to ecoregions with less than half of the protected areas required to meet national conservation targets. Poorly protected ecoregions with one or more of the five ecosystem services are interpreted as hotspots with the highest potential for conflicting land-use priorities in the future, including parts of southern Ontario and Québec, western Labrador, and northern Manitoba and Saskatchewan. Managing hotspots with multiple land-use priorities would necessarily involve partnerships with both Indigenous peoples whose traditional lands are affected, and other impacted communities. We suggest that prospectivity models and other machine learning methods can be used as part of natural resources management strategies to balance critical mineral development with conservation and biodiversity values.
Introduction
Demand for renewable energy technologies is expected to accelerate over the next few decades as governments adjust their national energy policies to meet global emission targets (Gielen et al., 2019; Spillias et al., 2020). However, the manufacturing process for renewable energy technologies tends to be material intensive (Valero et al., 2018; Calvo and Valero 2022) and the proliferation of electric vehicles, solar panels, wind turbines, and batteries is placing unprecedented pressure on the supply chains of critical raw materials (Sovacool et al., 2020). The list of minerals, chemical elements, chemical compounds, metals, and/or metalloids required for manufacturing renewable energy technologies are hereafter referred to as critical minerals for simplicity (Gadd and Lawley 2022). Improved processing and extraction methods of ore and waste from currently operating mines and/or new recycling technologies are unlikely to meet the expected growth in mineral demand (Ali and Giurco, 2017). Instead, new discoveries of critical mineral deposits are required, and the increased exploration and development has the potential to apply further pressure to natural ecosystems and contribute to the trend of declining biodiversity (Sonter et al., 2020; Luckeneder et al., 2021). Environmental, social, and governance (ESG) performance is an essential factor in deciding whether a discovered critical mineral deposit ultimately goes into production, as consumers are placing an increased priority on safe, environmentally responsible, and sustainable sourcing of minerals (Franks et al., 2014; Lèbre et al., 2019, 2020; Jowitt et al., 2020).
Recent research suggests that ESG performance in Canada is generally greater than the global average when considering waste, water, conservation, land uses, communities, social vulnerability, and governance risk factors (Lèbre et al., 2019, 2020). The intersection between one of these ESG criteria, i.e., conservation, and critical mineral extraction is particularly important as the International Resource Panel estimates that 90% of biodiversity loss globally is related to the extraction and processing of natural resources (IRP 2019). The World Economic Forum also ranks biodiversity loss as one of its most severe risks to society and the global economy (World Economic Forum 2022). Major producers of critical minerals like Canada thus have an important role to protect against further environmental degradation. To reverse the trend of declining biodiversity, increase resilience to climate change, and protect essential ecosystem services, Canada has set national conservation targets as part of its commitments under the Convention on Biodiversity and the post-2020 Global Biodiversity Framework (25% of land conserved by 2025 and 30% by 2030) and is contributing to other international conservation efforts (e.g., 50% of land by 2050) (Dinerstein and Olson, 2017). However, very few, if any, research studies have evaluated whether these area-based conservation targets can be balanced with increased exploration and development of critical minerals, due in part, to the difficulty of accurately predicting where new deposits are most likely to occur (Maus et al., 2020; Allan and Possingham,. 2022). Moreover, environmental and ecological risks tend to be monitored, reported, and managed at the project level and after a mineral deposit has already been discovered rather than as part of broader land-use planning at larger spatial scales (Figure 1).
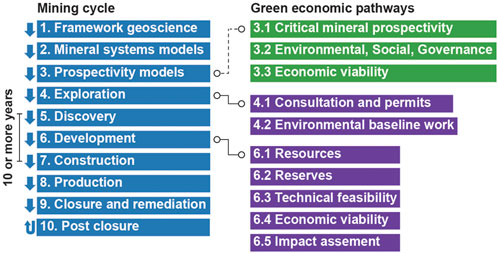
FIGURE 1. Mineral exploration and development workflow from public geoscience to exploration, discovery, development, production, and remediation. Combining environmental, social, and governance (ESG) data with prospectivity modelling can be used as input for land-use planning, partnership discussions with Indigenous peoples and other impacted communities, and to focus mineral exploration expenditures on areas that have lower ecological and environmental risk.
Herein we integrate artificial intelligence-based predictions of mineral potential (i.e., prospectivity modelling) with measures of ecological representation and ecosystem services to address both of those research gaps (Figures 1, 2). The focus is on Canada’s major source of battery minerals, i.e., magmatic Ni (± Cu ± Co ± Platinum Group Elements; PGE) mineral systems (Figure 3), that are particularly susceptible to future supply chain disruptions and for which Canada will likely be able to increase production in the future (Jowitt et al., 2020; Mudd and Jowitt 2022). The prospectivity modelling results and the public data underlying the new magmatic Ni (± Cu ± Co ± PGE) models can be used as input into land-use planning by Indigenous peoples and other impacted communities to assess economic opportunities, while examining the possibility of new or expanded conservation areas (Figure 4A). Indigenous-managed conservation areas, in particular, have been shown as an effective strategy for halting or reversing the trend of declining biodiversity in Canada, Brazil, and Australia (Schuster et al., 2019).
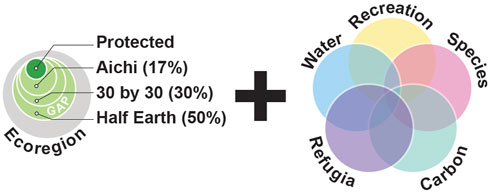
FIGURE 2. Area-based conservation targets are an important strategy for protecting species at risk, reversing the declining trend of biodiversity, and building resilience to climate change. Herein gaps in the current protected-area network were combined with ecosystem services (i.e., freshwater, carbon storage, nature-based recreation), species at risk and critical habitat, and climate-change refugia to highlight the parts of poorly protected ecoregions with high potential for providing benefits to people and the environment.
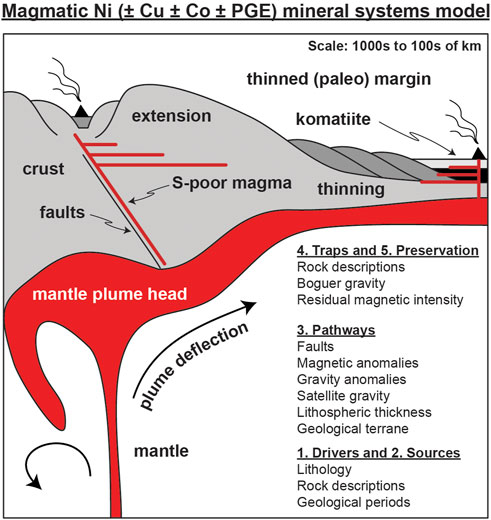
FIGURE 3. Conceptual model for magmatic Ni (± Cu ± Co ± PGE) mineral systems and their mappable criteria. Ultramafic to mafic melts are focused along thinned paleo-continental margins or other zones of pre-existing lithospheric weakness to depositional traps within the continental crust (Lawley and Tschirhart. 2021). Multiple seismic, magnetic, and gravity anomalies were used to map mineral system pathways and traps at shallower crustal levels (McCuaig et al., 2010).
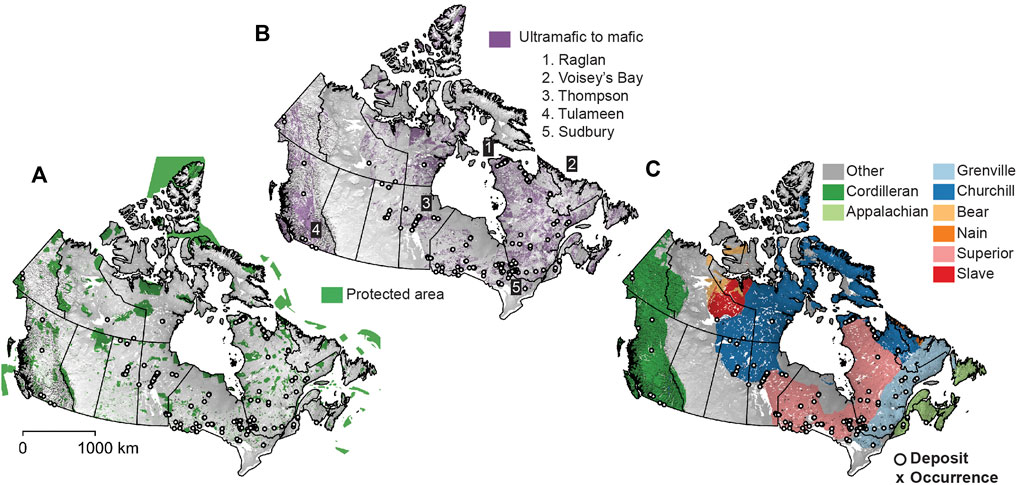
FIGURE 4. (A) Distribution of the current protected-area network based on the Canadian Protected and Conserved Areas Database (CPCAD); (B) the presence or absence of ultramafic and mafic rocks, representing the source of magmatic Ni (± Cu ± Co ± PGE) mineral systems; (C) Map showing the distribution of geological provinces (Wheeler et al., 1996). The locations of magmatic Ni (± Cu ± Co ± PGE) deposits and occurrences used for training the prospectivity models are shown for reference.
Canada’s Battery Mineral Sources
Battery manufacturing is an energy- and material-intensive process, requiring graphite, Ni, Co, Li, Zn, and other critical minerals. The focus of the present study is supporting exploration for new sources of Ni and Co because both metals are needed to increase the energy density and lower the cost of batteries for electric vehicles. Other battery minerals and other sources of Ni and Co are not considered due to the availability of national-scale data in Canada. Globally, the majority of Ni is sourced from laterite deposits (54% of Ni resources; 190 Mt at 1%–2.5% Ni) and magmatic Ni (± Cu ± Co ± PGE) mineral systems (35% of Ni resources; 124 Mt at 0.4%–2% Ni) (Mudd and Jowitt 2022). A significant amount of Cu, Co, and Platinum Group Elements (PGE) are produced as bi-products of these Ni mining activities. Canada is the fourth largest producer of Ni in the world, producing an estimated 130, 000 t per year (USGS 2022). The vast majority of Canadian Ni and Co production is sourced from: 1) Ni deposits from the Sudbury basin. The Ni- and Co-bearing pentlandite and pyrrhotite at these deposits segregated from a melt sheet that formed in response to a Paleoproterozoic meteorite impact (Keays and Lightfoot 2020). Although these impact-related Ni deposits are economically significant to Canada and globally, the probability of finding additional examples of this mineralization style outside of the Sudbury basin is low. The environmental and social impacts of the long mining history in the region are also well documented (Dirszowsky 2020) and its relatively small size (27 km × 60 km) are at odds with the national focus of the present study. For all three of these reasons, the prospectivity for impact-related deposits around Sudbury are not discussed further; and 2) Magmatic Ni (± Cu ± Co ± PGE) mineral systems (Naldrett 1981; Arndt et al., 2005; Mungall 2014; Barnes et al., 2016). Pentlandite is the primary host for Ni and Co and examples of this mineral system type occur across Canada (Figures 4B,C). Continued mineral exploration within known districts or in remote parts of northern Canada that have not seen significant exploration for this mineral system are highly likely to result in new discoveries. Improved exploration targeting for magmatic Ni (± Cu ± Co ± PGE) mineral systems is urgently needed to advance Canada’s position as a supplier of critical minerals for renewable energy technologies.
Magmatic Ni (± Cu ± Co ± PGE) Mineral Systems
Mineral systems represent the conceptual framework for combining all of the geological processes that must converge in space and time to form a mineral deposit (Wyborn et al., 1994; McCuaig et al., 2010; Barnes et al., 2016; Hagemann et al., 2016; Huston and Mernagh 2016). Regions with one or more pieces of evidence for each mineral system component (i.e., drivers, sources, pathways, traps, and preservation) are generally considered to be have higher mineral potential. As a result, translating conceptual mineral system models to mappable proxies is the first step in the prospectivity modelling process (Figure 3; Supplementary Table S1) (McCuaig et al., 2010).
Magmatic mineral systems can be further divided into sub-types based on some difference in their host rocks and tectonic settings (e.g., komatiite-hosted, flood basalt-hosted, anorthosite-hosted, ferropicrite-hosted, and Alaska-type) (Naldrett 1981). However, virtually all magmatic mineral system sub-types are associated with the same mappable criteria for sources, pathways, and traps at the national scale and were thus considered together for modelling purposes (McCuaig et al., 2010). For example, critical minerals for each magmatic mineral system sub-type are ultimately sourced from the mantle (Figure 3). Large ultramafic to mafic intrusive complexes mapped at surface represent some of the most obvious evidence for where mantle-derived melts were focused into the overlying crust by zones of pre-existing lithospheric weakness (Figure 3) (Begg et al., 2010; Barnes et al., 2016). The intrusions or parts of intrusions that actually host Ni deposits are considerably smaller (i.e., less than a few km) and tend to be missing from regional geological maps. In those cases, small or rare mafic dykes and intrusions described with the majority map unit represent the only available evidence for mantle-derived melts. Both forms of geological map data (i.e., majority and minority rock types and unstructured map unit descriptions) were used to map the mantle sources of magmatic mineral systems. Geological map databases were also used to map the distribution of Archean and Proterozoic rocks, which are particularly prospective time periods because of the hotter mantle temperatures that facilitated the transfer of Ni and Co to the crust (Barnes et al., 2016). The high prospectivity of ultramafic volcanic rocks that are unique to these eons reflects the importance of mantle temperature as a driver of some mineral system sub-types (i.e., komatiites; Figure 3) (Arndt et al., 2005). In contrast, Alaska-type deposits and other arc-related mineral system sub-types in the Grenville province formed during the Phanerozoic and Mesoproterozoic, respectively (Sappin et al., 2011; Milidragovic et al., 2021). The most favourable paleo-tectonic setting for magmatic mineral systems thus varies across time, with the largest and most economically significant deposits associated with the Archean and Proterozoic. Thinned continental lithosphere and other lithospheric-scale features that connect these fertile, mantle sources with depositional sites in the crust were mapped using a combination of satellite gravity and seismic survey compilations (Figure 3).
At shallower crustal depths, mineral system pathways were mapped using proximity to faults, terranes boundaries, and lithological contacts (Supplementary Table S1). National gravity and magnetic survey compilations, re-processed using multiple methods to highlight the edges of density and magnetic anomalies, were also essential for mapping mineral system pathways under surficial cover and at multiple depths within the crust (discussed below). Interaction between mantle-derived melts and the S-rich rocks, either during transport along these pathways or at the depositional trap, is interpreted as one of the possible processes for triggering the rapid deposition of immiscible sulphide liquid droplets within the magma to form a mineral deposit (Barnes and Lightfoot 2005; Keays and Lightfoot 2020). The presence of black shales or other carbonaceous rock types contained within geological map databases were used to assess the potential for this depositional trapping mechanism across Canada. Unfortunately, many of the other mechanisms that are known to segregate and accumulate sulphide liquid (e.g., mechanical accumulation, and gravity-driven processes) (Naldrett 1981; Arndt et al., 2005; Barnes et al., 2016) are impossible to recognize from the available datasets (Lawley and Tschirhart. 2021). Datasets that can be used as proxies for the physical and chemical trapping of magmatic sulphide will likely improve prospectivity model performance in the future. Instead, the focus of the present study is on mapping the most likely sources (e.g., ultramafic to mafic melts), drivers (e.g., mantle melting events), and pathways (e.g., zones of long-lived mantle and crustal weakness) of magmatic mineral systems (Barnes et al., 2016; Lawley and Tschirhart. 2021).
Mineral system preservation and the potential for finding buried deposits were assessed by including descriptions of metamorphic grade for the preferred prospectivity model and by generating a separate baseline prospectivity model that is the least impacted by the availability of surface information (discussed below). Overprinting metamorphism is known to remobilize magmatic sulphide from its ultramafic and mafic source rocks, a major problem for prospectivity models that are based on the spatial overlap of mineral system sources and traps (Lisitsin et al., 2013). Giant Ni deposits around Thompson represent significant example of these remobilized mineral system sub-types (Figure 4B). Baseline prospectivity models that are not based on geological datasets are the most appropriate for buried and remobilized deposits; whereas the preferred prospectivity model incorporates more conceptual mineral system components and is expected to perform better overall (McCuaig et al., 2010).
Prospectivity Data and Methods
Prospectivity Modelling Data
All prospectivity models for magmatic Ni (± Cu ± Co ± PGE) mineral systems are based on national-scale geological and geophysical compilations. The goal of this work is to improve the previous model published in Lawley and Tschirhart. (2021) by adding higher resolution datasets and more robust training methods. For example, the new prospectivity model is based on the H3 discrete global grid system (DGGS) developed by Uber (https://h3geo.org/) rather than an arbitrary grid. The H3 DGGS uses hexagon tiling for the globe at multiple spatial resolutions, with each H3 hexagon cell assigned to a unique and hierarchical address (Lawley and McCarfferty,. 2022). All datasets used for modelling were spatially indexed based on resolution 7 of the H3 DGGS, corresponding to ∼1.8 million unique H3 addresses for the Canadian land mass. This resolution (i.e., 1.22 km per side) is approximately twice the resolution of the arbitrary 5 km square grid reported in Lawley and Tschirhart. (2021). All spatial indexing operations to transform geological and geophysical datasets to the H3 DGGS were completed in R (R Core Team 2021) using the “tidyverse” (Wickham and Averick,. 2019), “sf” (Pebesma 2018), “raster” (https://github.com/rspatial/raster), “exactextractr” (Baston et al., 2021) and “h3jsr” (https://github.com/obrl-soil/h3jsr) packages.
The new prospectivity models are also based on the provincial, terrestrial, and other geological survey map datasets that are described in Lawley and McCarfferty. (2022) rather than the older and more generalized national geological map (Wheeler et al., 1996). The higher spatial resolution of the provincial and territorial geological datasets is important for mapping the small ultramafic to mafic intrusions that are the source and primary host rock for magmatic Ni (± Cu ± Co ± PGE) sulphide deposits (Barnes et al., 2016). Custom vocabularies were used to search through the unstructured rock descriptions associated with each geological map dataset to map the presence or absence of up to 17 geological properties as described in Lawley and McCarfferty. (2022) for sediment-hosted mineral systems. Using the available rock descriptions as input into prospectivity modelling is an important step for mapping the presence or absence of rare prospective rock types that are not represented by the map unit.
The preferred pathways of magmatic Ni (± Cu ± Co ± PGE) mineral systems are mapped using a combination of seismic, magnetic, and gravity data compilations and fault databases (McCuaig et al., 2010; Lawley and Tschirhart. 2021, 2022). Seismic data compilations were used to map abrupt changes in lithospheric (i.e., the depth to the lithosphere-asthenosphere boundary) and crustal thickness (i.e., depth to Moho), which represent an important first-order control on the location of magmatic Ni (± Cu ± Co ± PGE) mineral system sub-types (Begg et al., 2010). Paleo-tectonic settings were mapped using satellite gravity datasets and their derivative products, as described in Ebbing et al. (2018). Other higher resolution geophysical datasets are more appropriate for finding density (i.e., gravity) and/or magnetic contrasts that could represent major lithological boundaries at and below surface. National magnetic and gravity datasets were further processed to accentuate linear features (e.g., 1st vertical derivative; 1VD), highlight the edges of geophysical anomalies (e.g., the horizontal gradient magnitude; HGM; multi-scale edge detection or “worms”), and/or upward-continued and filtered to remove near-surface noise that has the potential to obscure the imaging of mineral system pathways in the mid- to upper-crust (Lawley and Tschirhart. 2021, 2022). All geophysical and geological datasets were then combined using the unique address of each hexagonal H3 cell prior to prospectivity modelling. The data sources used to model each component of the magmatic Ni (± Cu ± Co ± PGE) sulphide mineral system are reported with prospectivity model results in Supplementary Table S1.
Prospectivity Modelling Methods
All prospectivity modelling was completed in R (R Core Team 2021) using the H2O artificial intelligence platform (https://www.h2o.ai/). Missing values for the magnetic- and gravity-based datasets were imputed using the mean of each variable. The relatively few missing values are unlikely to have a major impact on our analyses. Categorical datasets such as rare rock types and geological periods were combined with their closest classification (e.g., Other_Unknown was combined with Other_Unconsolidated) to lower the dimensionality of the data prior to modelling. Other pre-processing steps were tested over the course of the study (e.g., outlier removal, outlier replacement, min max scaling, log transformation, and standardization) but did not significantly improve performance and were not considered further. Deposits and mineral occurrences were used as true positives; whereas all other H3 cells were assumed to be true negatives for the purposes of this study. Unfortunately, drill hole and associated assay data are not currently available across Canada to correctly classify H3 cells that are truly devoid of mineralization (Lawley and Tschirhart. 2021).
The training and test sets were generated using a spatial cross-validation method, as implemented in the “blockCV” package (Valavi et al., 2019). The size of each block (500 × 250 km) is based on semivariogram analysis (i.e., the sill) for a subset of the geophysical datasets (i.e., seismic, gravity, and magnetic datasets; Supplementary Figures S1, S2); whereas the number of folds (i.e., five cross-validation folds and one test set) was selected based on the limited amount of known deposits available for training (deposits and advanced stage exploration projects = 236; other mineral occurrences = 1,216). The selected block represents an intermediate value between datasets with a well-defined sill and more complex variograms with larger ranges of spatial autocorrelation (Supplementary Figure S1). Ultimately, the block size is a subjective choice that balances the need to address spatial autocorrelation, data limitations, and computation (Roberts and Bahn, 2017). The blockCV package was then used to randomly assign each block into a fold whilst making sure that each fold contains an approximately equal number of known deposits (Valavi et al., 2019). The more conventional approach of randomly splitting training and test datasets has the potential to overestimate model performance for strongly clustered training data (Roberts and Bahn, 2017; Valavi et al., 2019).
Model results were calculated using the Gradient Boosting Machine (GBM) function in H2O. The GBM method is included within the family of tree-based classification algorithms, with each tree representing a set of if-else conditions that explore the range of possible outcomes for any given decision. However, unlike random forest and other tree-based classifiers that aggregate the predictions of multiple independent trees, the GBM method adds each decision tree sequentially using the classification errors of the previous trees to improve the overall model performance. The process of successively improving the performance of each decision tree is referred to as “boosting” and is one of the reasons that GBM models tend to outperform other tree-based classifiers and other supervised learning methods (Lawley and Tschirhart. 2021, 2022). Several recent studies have applied different boosting methods to prospectivity modelling, including AdaBoost (Brandmeier et al., 2020) and XGBoost (Parsa 2021; Zhang et al., 2022). The GBM method was demonstrated to outperform these and all other supervised machine learning methods available in H2O (e.g., logistic regression, random forest, XGBoost, and neural networks) and the weights-of-evidence method during previous testing (Lawley and Tschirhart. 2021, 2022). As a result, the current study focused on optimizing the GBM method by performing random grid searches (n = 100) to find the best combination of hyperparameters (e.g., number of trees, tree depth, and learning rate) rather than testing different data-driven prospectivity modelling methods. The process of random grid searches was repeated using different weights (i.e., 1, 10, 100, 1,000, 10,000) to test for the sensitivity of these results to the highly imbalanced class distribution within the training data, with the best performance based on weighting true positives by 1,000.
The best GBM model after hyperparameter tuning and weighting was identified using the area under the curve (AUC) for the receiver operating characteristics (ROC) plot (Supplementary Figure S3). The top 30 different GBM models from the hyperparameter grid search (total = 100) were used to calculate the standard deviation (SD) and relative standard deviation (RSD) for the predicted prospectivity of each H3 cell (Supplementary Figures 4A,B). The RSD following this approach tests the sensitivity of the prospectivity results to the selected hyperparameters. Model uncertainty for the preferred model was further tested by adding 20% “noise” to the input datasets and then predicting mineral potential for each H3 cell (i.e., each numeric values was multiplied by a noise factor drawn from a uniform distribution for each H3 cell and this process was repeated 30 times). The calculated SD and RSD of the predicted prospectivity for each H3 cell following this re-sampling method provides some test of model sensitivity to the underlying training data (Supplementary Figures 4C,D). Other forms of data- and model-related uncertainties are not addressed as part of the current study (e.g., data interpolation, missing data, data quality limited training data) (Lisitsin et al., 2014; Parsa and Carranza 2021; Zuo et al., 2021). Variable importance for the GBM method is based on the error reduction for each input dataset observed during the training process and is present in Supplementary Figure S5. Finally, the baseline and preferred prospectivity models were further evaluated using success- and prediction-rate curves, to assess the reduction of the mineral exploration search space in areas not used during training (Supplementary Figure S6).
Ecological Representation Data and Methods
Protected Area Network
Protected areas and other effective area-based conservation measures were taken from the 2021 Canadian Protected and Conserved Areas database (CPCAD; managed by Environment and Climate Change Canada; Figure 4A). The data were filtered to include all terrestrial conservation areas (n = 11,291) with designated (n = 8,279), established, private, and/or interim (n = 2,822), and proposed status (n = 190). Indigenous protected and conserved areas (IPCAs) were also included (n = 3); however the vast majority of protected areas are managed by national and sub-national governments (n = 7,832), non-profit organizations (n = 2,749), other government-private sector collaborations (n = 419), individual land owners (n = 251), and others (n = 37). The CPCAD is known to be missing an undetermined number of privately owned protected areas, although these are expected to be relatively small. All protected areas were transformed to an equal-area projection and converted to a raster (pixel resolution 400 m) prior to calculating the percentage overlap with each ecoregion and ecodistrict (discussed below; Figure 5).
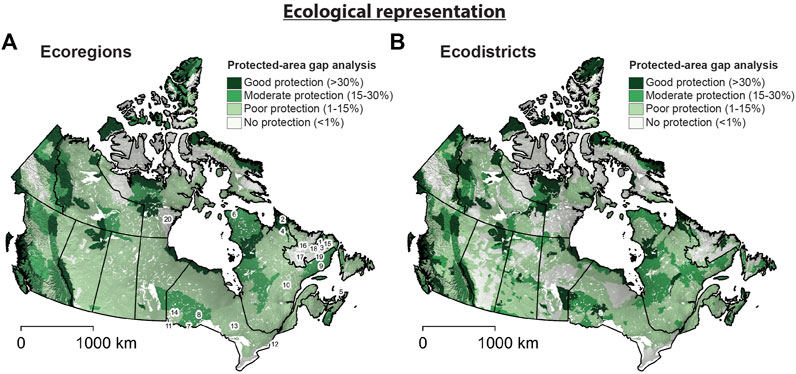
FIGURE 5. (A)Protected-area gap analysis based on ecoregions; (B) protected-area gap analysis based on ecodistricts. Colours are classified relative to the post-2020 Global Biodiversity Framework (i.e., conserving 30% of land by 2030) as no protection (<1%), poor protection (i.e., less than half the national conservation target; 1%–15%), moderate protection (i.e., more than half the national conservation target; 15%–30%), and good protection (i.e., more than the national conservation target; >30%). Labels: Kingurutuk-Fraser Rivers = 1; Torngat Mountains = 2, Eagle Plateau = 3, George Plateau = 4, Cape Breton Highlands = 5, Northern Ungava Peninsula = 6, Thunder Bay-Quetico = 7, Lake Nipigon = 8, Mecatina Plateau = 9, Central Laurentians = 10, Rainy River = 11, Frontenac Axis = 12, Lac Temiscamingue Lowland = 13, Lake of the Woods = 14, Paradise River = 15, Winokupu Lake North = 16, Smallwood Reservoir-Michikamau = 17, Goose River West = 18, Mecatina River = 19, Maguse River Upland = 20).
Ecological Representation
Ecoregions are relatively large areas of land and water with environmental and/or ecological characteristics that differ substantially from neighbouring areas (Omernik 1987). Ecodistricts are smaller subdivisions of ecoregions, recognizing that ecosystems are hierarchical and overlapping across multiple spatial and temporal scales (Sayre and Karagulle,. 2020). The precise boundaries between different ecoregions and ecodistricts are poorly defined but generally correspond to significant changes in topography, hydrology, geology, vegetation, wildlife, and/or climate. Ecoregions are the typical measurement “unit” to assess ecological representation for area-based conservation efforts, as recently demonstrated in Canada (Coristine and Jacob, 2018; Kraus and Hebb 2020) and globally (Dinerstein and Olson 2017). Herein we used the National Ecological Framework for Canada dataset published by Agriculture and Agri-Food Canada (Marshall et al., 1996), which contains 194 and 1,021 ecoregions (Figure 5A) and ecodistricts (Figure 5B), respectively. Both units of ecological representation were filtered to terrestrial areas and transformed to an equal-area projection prior to calculating the percentage overlap with the current protected area network contained within the CPCAD. Ecoregions were then classified as having no protection (<1% overlap), poor protection (%1–15%), moderate protection (15%–30%) or good protection (>30%; Figure 5A) in order to compare with the post-2020 Global Biodiversity Framework targets. The protection status for each ecoregion (i.e., area protected in %) was scaled by a logistic function to range from 0 to 1 prior to combining with ecosystem services (discussed below).
Conservation Data and Methods
Ecosystem Services
The benefits that people derive from ecosystems that contribute to human well-being are described as “ecosystem services” (Mitchell and Schuster, 2021). Examples of ecosystem services include provisioning services (e.g., food, energy, and/or raw materials), regulating services (e.g., climate regulation, flood prevention, and/or soil erosion control), and cultural services (e.g., places for recreation, spiritual, and/or therapeutic activities). Prioritizing high-capacity ecosystems that provide essential benefits to people represents an important component of conservation and land-use planning (Carpenter and Mooney, 2009; Mitchell and Schuster, 2021). Herein we integrated the ecosystem services previously described by Mitchell and Schuster, (2021) and Stralberg et al. (2020b) to evaluate the overlap between areas important for ecosystem services with areas with high prospectivity. These recent studies represent a few of the only national assessments of ecosystem services in Canada and focused on: 1) carbon storage (Figure 6A) (Mitchell and Schuster, 2021); 2) freshwater (Figure 6B) (Mitchell and Schuster, 2021); 3) nature-based recreation (Figure 6C) (Mitchell and Schuster, 2021); 4) species at risk (Figure 6D); and 5) climate-change refugia and climate corridors (Figure 6E) (Stralberg et al., 2020b).
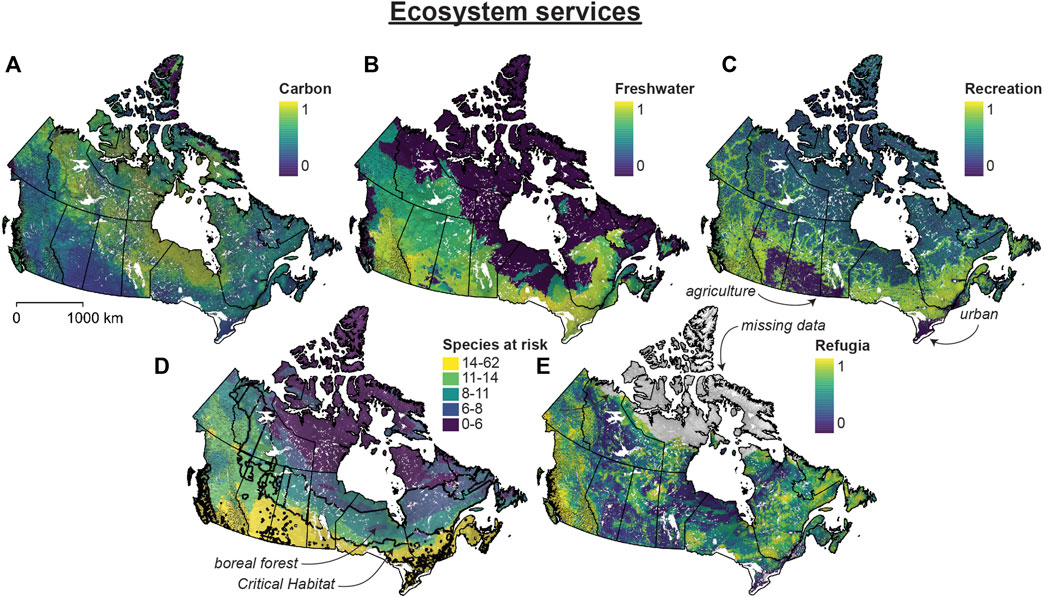
FIGURE 6. Ecosystem services maps for: (A) carbon storage (Mitchell and Schuster, 2021); (B) freshwater provision (Mitchell and Schuster, 2021); (C) nature-based recreation (Mitchell and Schuster, 2021); (D) species at risk ranges and critical habitat; and (E) climate-change refugia (Stralberg et al., 2020b).
Carbon Storage
Carbon-rich landscapes represent important conservation priorities for mitigating climate change through carbon storage (Mitchell and Schuster, 2021; Sothe et al., 2022). Mitchell and Schuster, (2021) calculated the total amount of carbon above- and below-ground using previously published estimates for forest biomass (Canadian National Forest Inventory; https://nfi.nfis.org) and soil organic carbon content (i.e., global SoilGrids dataset) (Hengl and Jesus, 2014), respectively. Estimates for above- and below-ground carbon concentrations were then summed and re-scaled to calculate relative carbon storage importance across Canada (i.e., provision scored 0–1) (Mitchell and Schuster, 2021). Boreal forests and especially peatlands are highlighted as important carbon storage areas (Figure 6A).
Freshwater
Freshwater provision services were calculated by identifying watersheds with high annual run-off that are connected to regions with high human demand for water (i.e., municipal consumption, hydropower generation, agriculture, and industrial activities) as described in Mitchell and Schuster (2021). High-capacity watersheds that provide freshwater to higher numbers of demand sources were considered a higher priority for conservation (i.e., provision scored 0–1) (Mitchell and Schuster, 2021). Watersheds with high provision scores mostly occur in southern Canada because demand is concentrated in urban, agriculture, and industrial areas (Figure 6B).
Nature-Based Recreation
Nature-based recreation improves human well-being and raises environmental awareness (Gray et al., 2003). Intact wilderness areas with forests, mountains, and freshwater with low human population and road densities are considered particularly important and were combined by Mitchell and Schuster, (2021) to calculate the capacity for ecosystems to provide nature-based recreation (Figure 6C). Agriculture and urban areas were manually assigned to have low capacity scores. Demand for nature-based recreation was based on estimates of nearby population density and accessibility. The final nature-based recreation map (i.e., provision scored 0–1) highlights areas with high “naturalness” that are accessible to large population centres in southern Ontario, Quebec, British Columbia, and some parts of Atlantic Canada (Figure 6C). Intact wilderness across most of Canada’s north yield low provision scores because of limited accessibility, with the notable exception of the current road network (Figure 6C).
Species at Risk
In Canada, species at risk (SAR) are legally protected against intentional harming or killing on federal lands, and in some cases, on additional public and private lands (Turcotte and Kermany, 2021). Protecting SAR through expansions of the protected area network represents an important component of plans for halting and reversing the trend of declining biodiversity in Canada (Coristine and Jacob 2018; Turcotte and Kermany, 2021). Herein we used the estimated range extents of 488 SAR published by Environment and Climate Change Canada (https://data.ec.gc.ca/data), which were originally sourced from data provided by NatureServe, Environment Canada, and Committee on the Status of Endangered Wildlife in Canada (COSEWIC) reports. Geometry errors were fixed and the ranges of sub-species units were combined prior to calculating the number of SAR with ranges overlapping each H3 cell (Figure 6D). The number of SAR for each H3 cell were then re-scaled (i.e., 0–1) and combined with designated Critical Habitat identified by Environment and Climate Change Canada to protect SAR (i.e., Critical Habitat was manually assigned a score of 1). Combining both datasets (i.e., SAR ranges and Critical Habitat) was required because most of the designated Critical Habitat occurs in the boreal forest and does not overlap with the large number of SAR that occur in southern Canada (e.g., prairies and southern Ontario; Figure 6D).
Climate-Change Refugia and Corridors
Climate-change refugia are areas that are “relatively buffered” against anthropogenic climate change (Morelli and Daly,. 2016), providing greater potential for species and ecosystems to persist into the future. As such they represent efficient conservation investments and are considered a high priority for protecting biodiversity in the future (Keppel et al., 2015; Morelli and Daly, 2016, 2020; Michalak et al., 2018; Stralberg and Arseneault, 2020a). At a broad scale, (macro)refugia are mostly associated with areas of high topographic heterogeneity, steep climate gradients, and/or a slower rate of warming due to factors like coastal temperature buffering. Stralberg et al. (2020b) recently reported a systematic assessment of climate-informed conservation priorities across North America, considering multiple conservation objectives that were integrated using the Zonation algorithm (Moilanen 2007): 1) a species-neutral index of climate-type macro-refugia, 2) songbird macro-refugia, 3) tree macro-refugia, 4) climate corridors (i.e., multi-species migration routes), and 5) environmental diversity as a surrogate for microrefugia. Urban and other areas disturbed by human activity (e.g., agriculture) were excluded from the analysis using a previously published human development dataset (Venter and Sanderson, 2016) as described in Stralberg et al. (2020b). The full scenario prioritization (i.e., all objectives combined without biome stratification) rescaled to range from 0 to 1 provides an assessment of the potential for multi-species climate-change refugia across most of North America (Figure 6E). Missing data from this analysis are due to some of the limitations of current range data in Canada’s arctic. To remedy this, climate-change refugia from the Michalak et al. (2018) climate-analog model were manually assigned a value of one and used to fill data gaps in the north. Although these two studies used different methods, they both represent metrics of climate-tracking potential based on end-of-century climate model projections under the assumption of continued high greenhouse gas emissions (i.e., RCP = 8.5; Representative Concentration Pathway). All other remaining missing values were imputed with the mean of Stralberg et al. (2020b).
Combined Conservation Data
Two different approaches were taken to combine the five ecosystem services (i.e., freshwater, carbon, nature-based recreation, SAR, climate-change refugia) and the protected-area gap-analysis. First, all six conservation datasets were summed together to give an overall score. This simple sum approach highlights poorly protected ecoregions with more ecosystem services (Supplementary Figure 7A). The second method uses a fuzzy gamma operator to combine conservation datasets (Moon and An 1991):
where µi is the value for the ith map of the standardized map inputs to be combined (n = 6) and γ is a value between 0 and 1.
The fuzzy gamma operator penalizes missing ecosystem services using a product function, which is distinct from the increasing tendency of the simple sum operator. Both methods represent simple approaches to visualize the spatial overlap between disparate datasets (Supplementary Figure S7). The final combined conservation dataset is based on a γ value of 0.85 to balance the increasing tendency of the simple sum operator and the decreasing tendency of the product function (Supplementary Figure S7B).
Results
Prospectivity Modelling Results
Two different prospectivity models for magmatic Ni (± Cu ± Co ± PGE) mineral systems are presented in Figure 7 and reported in Electronic Supplementary Tables S1–S5. The “preferred” prospectivity model is based on the best available datasets, including bedrock geological maps that are negatively impacted by unconsolidated surficial cover (Figure 7A); whereas the “baseline” prospectivity model was trained using only the geophysics data and is thus the least impacted by surface sampling bias (Figure 7B). Prospectivity scores for areas covered by unconsolidated sediments in the preferred model likely underestimate the true mineral potential. The preferred prospectivity model is also expected to perform poorly for remobilized mineral system subtypes that are spatially decoupled from their source rocks. Both models (i.e., baseline and preferred) were trained and tested using the same blocks as part of spatial cross-validation (Supplementary Figure S2). All prospectivity model results are reported in Supplementary Tables S2–S5.
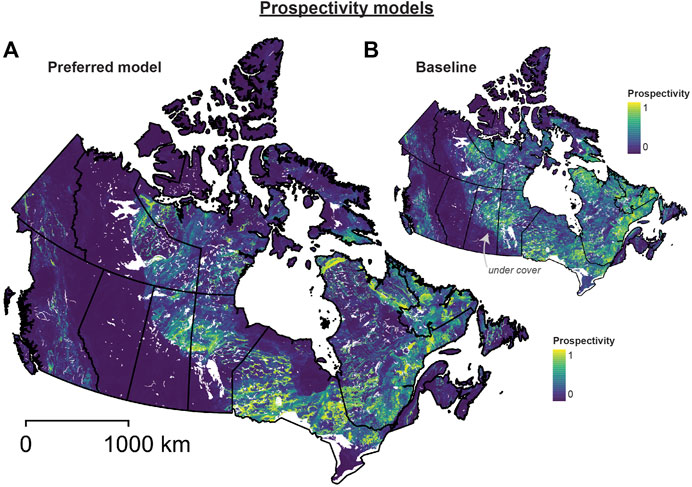
FIGURE 7. (A) Preferred prospectivity model for magmatic Ni (± Cu ± Co ± PGE) mineral system based on the GBM method and the best available datasets; (B) baseline prospectivity model using geophysics-only data. The baseline model is the least impacted by surface sampling bias. Both prospectivity models yield good to excellent classification performance; however the preferred model reduces the mineral exploration search for the training and test set by 94% and 89% respectively.
The best-performing baseline model comprises 68 trees, tree depth of three, and eight leaves (minimum and maximum). The AUC for the baseline model on the ROC plot is 0.967, reducing the search space for 90% of deposits within the training and test set by 85% and 80%, respectively (Supplementary Figure S6). In contrast, the preferred GBM model is based on 40 trees, tree depth of five, and 25–32 leaves. The AUC for the preferred model on the ROC plot is 0.972, reducing the search space for 90% of deposits in the training and test set by 94% and 89%, respectively (Supplementary Figure S6). Geological datasets included within the preferred prospectivity model reduce the mineral exploration search space by a further 9% relative to the baseline model. The preferred prospectivity model also reduces the search space for 90% of mineral occurrences by 86%, which is 17% better than the baseline model performance (i.e., the baseline model reduces the search space for 90% of mineral occurrences by 69%). Overall, the high AUC (0.955) for the test set, which was not used during training, suggests that the preferred GBM model can predict “unknown” areas with good classification performance (Supplementary Figure S6). Parts of the Yukon and southwest British Columbia yield the greatest variability for the preferred prospectivity model (Supplementary Figure S4), possibly because of the limited number of training data in western Canada.
Variable importance for the preferred prospectivity model provides some additional insight into the model quality and results (Supplementary Figure S5). For example, the presence or absence of mafic intrusions yields the highest variable importance for the preferred model (Supplementary Figure S5). These rare mafic to ultramafic rocks represent the sources of magmatic Ni (± Cu ± Co ± PGE) mineral systems and are based, in part, on map unit descriptions within provincial and territorial map databases as described in Lawley and McCafferty. (2022). The top five variables for the preferred GBM model ranked in order of importance are: 1) presence or absence of mafic rocks (mineral system source), 2) maximum geological period (mineral system driver), 3) lithology (mineral system source), 4) magnetic HGM (mineral system pathway), and satellite gravity (mineral system pathway).
Prospectivity of Protected Areas
Based on the Youden Index (Baddeley and Brown, 2021) threshold (Supplementary Figure S3), we demonstrate that approximately 16% of the most prospective H3 cells partially overlap with the existing protected network as defined by the CPAD. The vast majority of these protected and prospective H3 cells occur in smaller and mostly isolated conservation areas in southern Quebec (43%), southern Ontario (30%), Northwest Territories (6%) and parts of Labrador (6%). The true area overlap is likely less than these estimates because H3 cells that partially overlap with protected areas were included for the purposes of our analysis. Moreover, the CPCAD includes a range of protected area types (e.g., 4% of partially overlapping conservation areas are classified as other effective area based conservation measures rather than official protected areas recognized by the International Union for Conservation of Nature) and protective status (e.g., 1% and <1% of prospective H3 cells in conserved areas have an Interim or Proposed status, respectively; whereas 14% and 85% are Established or Designated, respectively). The amount of overlap with protected areas also depends on the selected prospectivity threshold, with higher thresholds leading to less overlap with the CPCAD but at the risk of excluding prospective H3 cells.
Protected-Area Gap Analysis
Most ecoregions in Canada are classified as poorly protected relative to the post-2020 Global Biodiversity Framework (i.e., conserving 30% of land by 2030) and several ecoregions remain unprotected (Figure 5A). These poorly protected and unprotected ecoregions and ecodistricts (Figure 5B) are considered to be higher priority for new or expansions of the protected area network (Coristine and Jacob, 2018) and occur in western Labrador, southern Ontario, Yukon, and Nunavut (Figure 5A). The few ecoregions that exceed the national conservation targets mostly occur in British Columbia and Northern Canada (Figure 5A), where protected areas tend to be larger and better connected (Figure 4A). The top 5 most prospective ecoregions for each protection classification are presented in Table 1.

TABLE 1. Top five most prospective ecoregions for each protected area classification.
Ecosystem Services
Previously published maps of ecosystem services highlight high-capacity ecosystems offering the most direct benefits to people (Mitchell and Schuster,. 2021), habitats for species at risk, or climate-change adaption potential (Stralberg et al., 2020b). The spatial overlap between these ecosystems services and the prospectivity modelling results are evaluated as individual hotspot maps (i.e., top 20% of ecosystem services, preferred prospectivity model results, or both; Figure 8); whereas the combined conservation values and prospectivity model results are evaluated using a bivariate choropleth map (i.e., combined ecosystem services values and preferred prospectivity model results discretized into quantiles; Figure 9) and a combined hotspot map (i.e., top 10% of combined ecosystem services values, preferred prospectivity model results, or both; Figure 10). Comparing these hotspots using multiple cut-off provides additional insight into the results (Figures 8–10), with the highest prospectivity values interpreted as the most likely places for future critical mineral development (Figure 10). Hotspots for individual ecosystem services occur across Canada but are concentrated in parts of southern Ontario and Quebec, western Labrador, northern Manitoba and Saskatchewan, and southeast British Columbia (Figure 8), where high capacity ecosystems provide direct benefits to people (Figure 6). Freshwater and SAR are the ecosystem services that yield the most spatial overlap with prospective H3 cells (Figures 8B,D). Both of these ecosystem services tend to be concentrated in southern Canada and, when combined with important climate-change refugia in forested regions (Figure 6E) and the decreasing protection status of ecoregions from north to south (Figure 5A), highlight the areas of Canada with the highest potential for conflicting land-use priorities in the future (Figure 9). The top five most prospective ecoregions are reported alongside their mean ecosystem services values in Table 1.
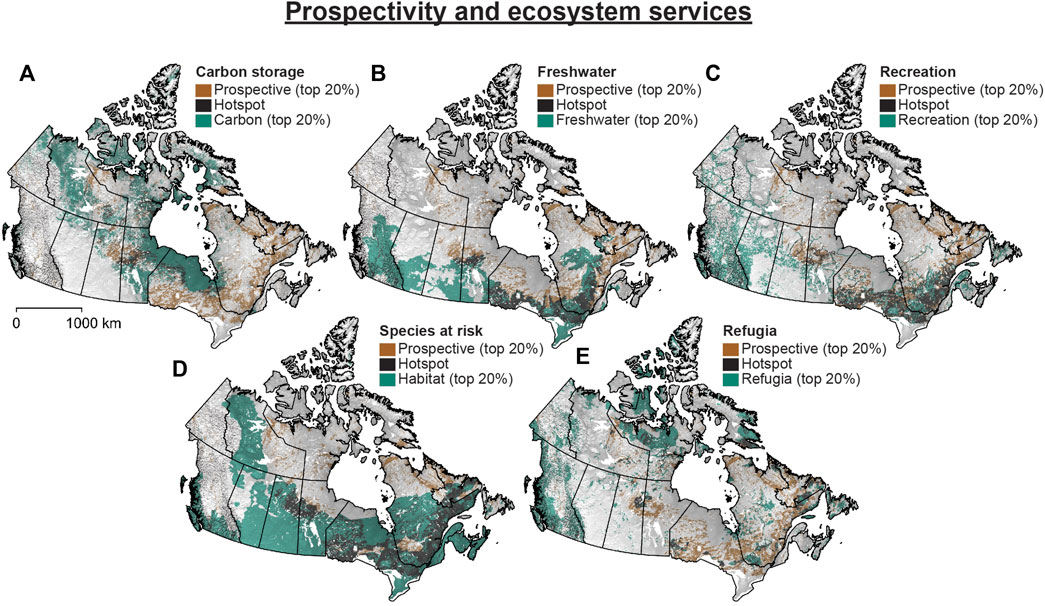
FIGURE 8. (A–E) Hotspots maps showing H3 cells with high prospectivity, ecosystem services, or both (i.e., hotspot). Colours are based on the cut-off for the top 20% of prospectivity values and ecosystem services. These quantile-based cut-offs were calculated after excluding missing or manually assigned values.
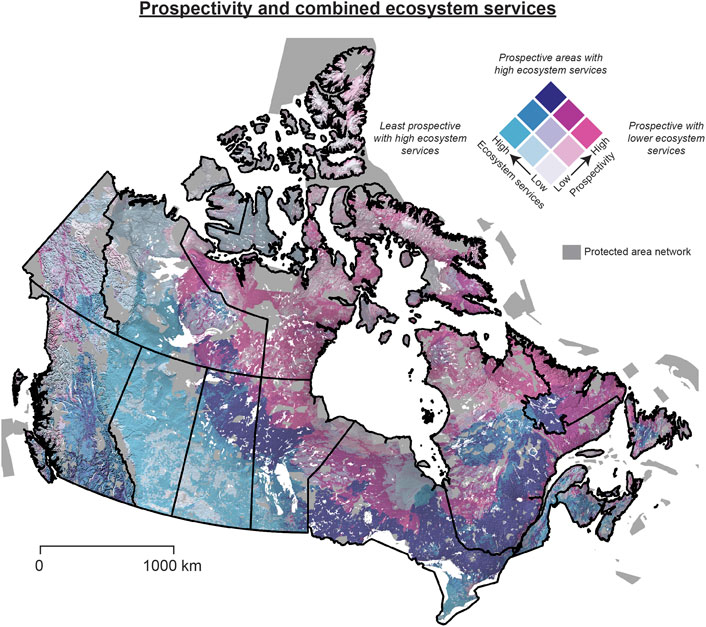
FIGURE 9. Bivariate choropleth map showing the preferred prospectivity model for magmatic Ni (± Cu ± Co ± PGE) mineral systems and all five ecosystem services combined using a fuzzy gamma operator. The colour legend is based on quantile scaling for both data axes, which overestimates the extent of the most prospective H3 cells. Area with the potential for conflicting land use priorities include parts of southern Ontario, southern Quebec, Labrador, and southern British Columbia.
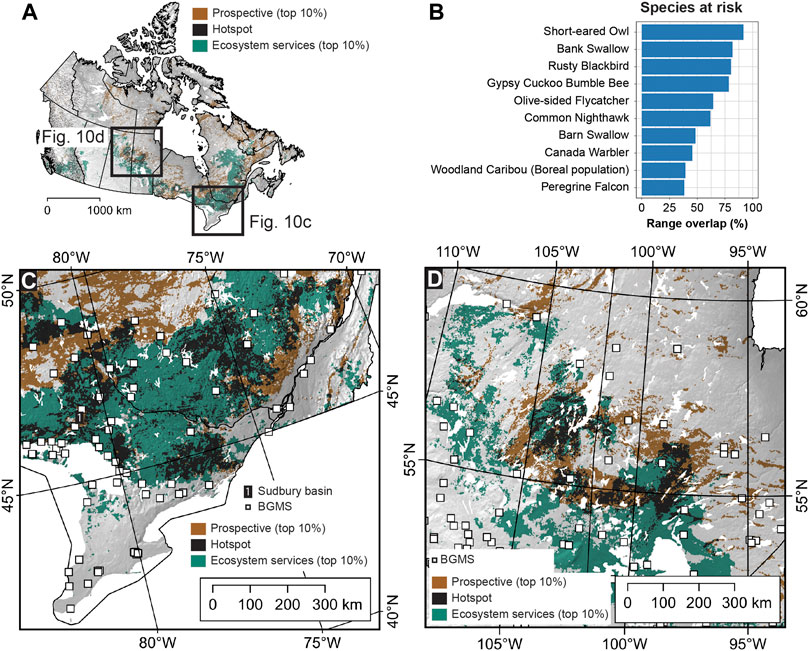
FIGURE 10. (A)National hotspot map showing H3 cells with high prospectivity, poorly protected ecosystem services, or both (i.e., hotspot). Colours are based on percentile scaling (top 10%) after excluding missing or manually assigned values; (B) bar plot showing the range overlap (%) between species at risk and the most prospective H3 cells. These species at risk are the most likely to be impacted by new battery mineral exploration and development based on their estimated ranges; (C) hotspot map for southern Ontario and Quebec; (D) hotspot map for northern Manitoba and Saskatchewan. First nation offices, as registered in the Indigenous Services Canada (ISC) Band Governance Management System (BGMS), show some of the traditional territories of Indigenous peoples.
Discussion
Evaluating Canada’s Geological Potential for Battery Minerals
Herein we demonstrate Canada’s geological potential for discovering new magmatic Ni (± Cu ± Co ± PGE) mineral systems using the locations of known mineral deposits and occurrences as training data. The resulting prospectivity modelling predictions are distinct from the maps that have been used in most previous conservation assessments which depict the surficial expression of known deposits (Maus and Gilijumm, 2020) or mineral claims (Coristine and Jacob, 2018). We focus on Canada’s main source of battery minerals, i.e., Ni and Co, even though these critical minerals can be sourced from multiple mineral systems (Gadd and Lawley, 2022). The prospectivity of Ni and Co are coupled because the concentrations of these elements are primarily controlled by the modal abundance of pentlandite and pyrrhotite within these magmatic mineral systems; whereas Cu and PGE are hosted by different mineral assemblages and may be spatially decoupled). As expected, we interpret areas with the highest Ni and Co potential (Figure 7) to be closely clustered with, or represent extensions of, established mining districts within the Superior and Churchill geological provinces (Figure 4C). For example, ultramafic to mafic intrusions in northern Ontario, Quebec, Manitoba, Saskatchewan, and Labrador are interpreted as highly prospective for komatiite-hosted deposits, a particular sub-type of magmatic Ni (± Cu ± Co ± PGE) minerals systems that are unique to periods of hot mantle temperatures and extensive partial melting during the Archean and Paleoproterozoic (Barnes et al., 2016). The impact of this mineral system driver on the prospectivity results is reflected by the high variable importance for geological time in the preferred model (Supplementary Figure S5). Paleoproterozoic komatiite-hosted deposits related to these major melting events in northern Quebec and Manitoba are host to some of Canada’s largest operating Ni mines (e.g., Raglan, Quebec; Thompson, Manitoba; Figure 4B). Areas between southern Quebec and Labrador are also interpreted as prospective due to several smaller deposits and mineral occurrences associated with Meso- to Neoproterozoic intrusions within the Grenville geological province or the giant troctolite-hosted Voisey’s Bay mine in Labrador (Figure 4B). Unlike the large Archean to Paleoproterozoic magmatic Ni (± Cu ± Co ± PGE) mineral systems that formed during continental breakup and rifting, deposits in the Grenville geological province are associated with arc-magmatism as the primary driver (Sappin et al., 2011). Smaller, arc-related mineral systems also likely occur in Nunavut (e.g., Ferguson Lake) (Acosta-Góngora et al., 2018). Overall, the preferred prospectivity model highlights the high mineral potential of the geological provinces comprising the Canadian shield (e.g., Superior, Churchill, Grenville) even though the drivers and host rocks vary for each mineral system sub-type. These areas with high prospectivity scores (Figure 7) and low model uncertainty (Supplementary Figure S4) can be used to support exploration for new sources of the critical minerals used to manufacture batteries for electric vehicles.
In contrast to the areas of high mineral potential discussed above, the western Canada sedimentary basin in Manitoba, Saskatchewan, Alberta, and British Columbia are interpreted to yield some of the lowest prospectivity scores overall (Figure 7). Areas with the lowest prospectivity scores correspond to thick sequences of Phanerozoic sedimentary rocks that are known for their oil and gas potential but are unprospective for Ni and Co. Parts of Saskatchewan and Alberta that yield low prospectivity scores and high model uncertainty are interpreted to reflect prospective mineral pathways buried by unprospective sedimentary rocks (Supplementary Figure S4). This interpretation could also explain the high model uncertainty along the Hudson Bay in northern Ontario and Manitoba and undifferentiated gneisses in mainland Nunavut. Similarly, large swaths of the western Cordillera geological province yield low prospectivity scores and variable model uncertainty, with the important exception of small mafic to ultramafic intrusions that host Alaska-type Ni ± Cu deposits (Nixon and Rublee 1987; Nixon et al., 1990; Milidragovic et al., 2021). Giant Mascot, Turnagain, and Polaris represent major Canadian examples of this mineral system sub-type that tend to be associated with arc-related intrusions (e.g., Tulameen; Figure 4B). The relatively small number of deposits and occurrences available for training for this mineral system sub-type is interpreted as the most likely cause for high model uncertainty in westernmost Canada (Supplementary Figure S4).
Balancing Critical Mineral Development With Conservation and Biodiversity Values
As a signatory to the international Convention on Biological Diversity (CBD), Canada has committed to protecting 30% of its land and sea by 2030, which builds on the previous Aichi Target 11 (i.e., protecting 17% of land and freshwater by 2020). At the end of 2021, Canada is estimated to have conserved just 13.5% of its terrestrial area and inland water through its network of Protected Areas or other effective area-based conservation measures. Rapid expansion of the current protected area network is thus required to meet terrestrial conservation targets (Coristine and Jacob 2018). Several recent studies have discussed some of the different objectives, or principles, that need to be considered for prioritizing future conservation areas (e.g., representative ecosystems, intact wilderness, connectivity, SAR, and climate-change refugia) (Coristine and Jacob 2018; Kraus and Hebb 2020; Stralberg and Arseneault, 2020a, b; Carroll and Ray 2021; Mitchell and Schuster, 2021; Dreiss et al., 2022; Hamilton and Smyth 2022). These and other studies further highlight the essential role of consultation, engagement, and partnerships with Indigenous peoples in the development and application of all land-use planning (Artelle et al., 2019; Schuster et al., 2019; Zurba et al., 2019). In Canada, the duty to consult Indigenous peoples is protected by law and the federal conservation strategy specifically mentions that new Indigenous Protected and Conserved Areas (IPCAs) are needed to meet national conservation targets.
The results of our overlay analysis demonstrate that the vast majority of the most prospective H3 cells are associated with poorly protected (66%) or unprotected (11%) ecoregions, suggesting that expansions of the protected area network will need to be balanced with new critical mineral development (Table 1). Areas with one or more essential ecosystem services represent the parts of those poorly protected to unprotected ecoregions where conflicting land-use priorities between conservation values and resource extraction are most likely to occur in the future (Table 1). For example, parts of the boreal forest containing critical habitat for SAR (Festa-Bianchet et al., 2011; Venier and Thompson 2014), essential ecosystem services (Mitchell and Schuster, 2021), and poor ecological representation by the current protected area network (Venier and Thompson 2014; Coristine and Jacob, 2018) are highlighted in Figure 9 as potential hotspots for new critical mineral development. Prospective areas in southern Ontario and Québec and northern Manitoba and Saskatchewan are identified as particularly important hotspots within the context of Canada’s battery minerals (Figures 10C,D). The combined data can further be used to develop environmental management strategies prior to critical mineral exploration and development. For example, the estimated ranges of SAR can be used to predict the individual species that are most likely to be impacted by battery mineral development in the future, including woodland caribou and multiple species of birds (Figure 10B). Risk management strategies can be customized to reduce the environmental and ecological pressures for these already threatened species.
The environmental threats associated with human activities, as well as gaps in the protected area network, led Kraus and Hebb (2020) to suggest that many of Canada’s southern ecoregions are in crisis. The combined data presented herein further suggest that several of these already threatened ecoregions are also potential hotspots for new battery mineral exploration and development. Prospective H3 cells that occur within poorly protected ecoregions are associated with relatively high ecological and environmental risks for new critical mineral exploration and development. New development in these ecoregions would need to be carefully managed, guided by ESG best practices, and would necessarily include Indigenous peoples whose traditional lands are affected. In contrast, the statutory obligations and other conservation measures within the most protected ecoregions have the potential to lower the ecological and environmental risk of new critical mineral exploration or development if supported by ESG best practices for individual projects. Some of the technology to mitigate environmental impacts of critical mineral production exist or are being actively developed (Aznar-Sánchez et al., 2019). Focusing mineral exploration expenditures within better protected ecoregions with lower ecological risk also has the potential to lower the financial cost of exploration and development when compared to areas that require more planning, management, and mediation. For example, ecoregions around the Raglan mine are well represented by the current protected area network, corresponding to more than half of the post-2020 Global Biodiversity Framework conservation target (Figures 4A, 5A). Prospective H3 cells around the northern boundary of the Superior geological province are thus interpreted to be associated with lower ecological risk relative to other parts of Canada. The Raglan mining district also represents one of the few prospective regions identified in the current study with a signed impact and benefits agreement between the mining corporation, Makivik Corporation, Salluit, and Kangiqsujuaq. This agreement describes how mining royalties are to be shared with Inuit communities, gives preference to Inuit business, creates other local economic and training opportunities, and puts measures in place to protect the environment (Rodon and Lévesque 2015).
Green Mining Starts With Green Exploration
The likelihood that a mineral exploration project ultimately goes into production depends on a large number of social, political, economic, technical, and environmental factors (Figure 1). However, most practical applications of prospectivity modelling have tended to focus on geological favourability, rather than including the economic and/or technical constraints that are known to have a dramatic impact on the overall assessment of mineral potential (Walsh et al., 2020, 2021). The BlueCap simulator, a recent pre-scoping analytical tool deployed in Australia (Walsh et al., 2020), addressed that knowledge gap by allowing proximity to infrastructure, access to energy and water, tax schemes, and cover thickness to be considered during the mineral exploration targeting stage, focusing mineral exploration expenditures to the most geological and economically favourable areas (Figure 1). Environmental, ecological, and/or conservation priorities have, so far, not been included in these pre-scoping analytical tools or most previous national mineral potential assessments (Figure 1) (Lisitsin et al., 2013; Bide et al., 2022) although the approach adopted herein could similarly be applied in Australia, the U.S., and elsewhere. As discussed above, low ESG performance now presents significant financial cost and risk to the supply chains of critical minerals globally (Franks et al., 2014; Jowitt et al., 2020; Lèbre and Stringer. 2020; UNECE 2021b).
Recent progress on incorporating environmental and other ESG factors into the definition of a mineral resource has the potential to change that trend, and potentially lead to a range of positive societal and environmental outcomes. For example, the United Nations Framework Classification for Resources (UNFC) considers ESG to assess the viability of any potential mining project through its life cycle (UNECE 2021a, b; Bide et al., 2022). Each ESG recommendation is linked to the United Nations sustainability goals, including the goal to protect, restore, and promote sustainable use of terrestrial ecosystems (SDG15). Improving the environmental impact of any new critical mineral development is essential because the extraction and processing of natural resources represents the major contributor to biodiversity loss and water stress globally (IRP 2019). Whilst the majority of these losses in biodiversity are occurring in countries other than Canada, integrated landscape planning is an essential tool for responsible natural resource management.
Some of the ecosystem services data needed to make these types of national assessments already exist in the environmental, ecological, and conservation research literature (Coristine and Jacob, 2018; Stralberg et al., 2020b; Jung and Arnell, 2021; Mitchell and Schuster, 2021). Several recent studies have also mapped multiple ESG dimensions using global datasets (Lèbre et al., 2019, 2020; Sonter et al., 2020). Continued progress on frameworks for modelling and predicting environmental and ecological risks with climate change require continued support (Lemieux and Scott 2005; Coristine and Kerr 2011; Dietze and Fox, 2018; McIntire and Chubaty, 2022) because many of the required datasets are either missing (e.g, quality of freshwater habitats and invertebrate biodiversity) or incomplete for large parts of Canada and globally (Brooks and Mittermeier, 2006; Coristine and Jacob, 2018). The United Nations Resource Management System has identified that these types of data gaps represent a major obstacle for managing and modelling the dynamic ESG that are essential for sustainable development (UNECE 2021b). We also emphasize that the current study excluded many of the ESG dimensions and data that would need to go into an integrated resource management strategy. In particular, identified areas of high battery mineral potential occur on the traditional territories of Indigenous nations and communities (Figures 10C,D). Respectful engagement and reciprocal relationships with Indigenous partners will be essential for conserving biodiversity and any critical mineral exploration and development (Artelle et al., 2019; Schuster et al., 2019). While there is precedent for exploration and extraction partnership agreements in Canada that can help to inform new initiatives, each new partnership will be strongly informed by relevant Indigenous rights holders’ social and environmental requirements.
Conclusion
New sources of critical minerals will be required to meet the projected demand of renewable energy technologies. However, the potential impact of increased critical mineral exploration and development on already threatened habits is difficult to evaluate without accurate predictions on where new mineral deposits are most likely to be discovered. Herein we have addressed that knowledge gap by using machine learning to predict the geological potential for magmatic Ni (± Cu ± Co ± PGE) mineral systems, which represent an important source for Ni and Co in Canada. New critical mineral development within poorly protected ecoregions with one or more essential ecosystem services (i.e., freshwater, carbon, nature-based recreation, SAR, and climate-change refugia) represent areas with the highest potential for conflicting land-use priorities in the future. In contrast, the legal protections and other conservation measures in place within well protected ecoregions have the potential to lower the ecological and environmental risk of new critical mineral exploration if individual projects are guided by ESG best practices. These public data and model results can be used by Indigenous peoples and other communities to assess economic opportunities and/or as input into broader land-use planning prior to critical mineral exploration and development. The application of artificial intelligence to lower the ecological and environmental risks of the natural resources sector could ultimately form part of the strategy towards the sustainable development of critical minerals. New actions to improve the ESG performance of mineral exploration and development are urgently needed to secure critical mineral supply chains and meet global climate goals.
Data Availability Statement
The original contributions presented in the study are included in the article/Supplementary Material, further inquiries can be directed to the corresponding author.
Author contributions
CL, MM, DS, and RS contributed to data and validation; CL conducted geospatial analysis and modelling. All authors conceived and contributed to the writing of the manuscript.
Funding
This project was completed as part of new critical mineral research at Natural Resources Canada. This work was represents NRCan contribution number 20220190.
Conflict of Interest
The authors declare that the research was conducted in the absence of any commercial or financial relationships that could be construed as a potential conflict of interest.
Publisher’s Note
All claims expressed in this article are solely those of the authors and do not necessarily represent those of their affiliated organizations, or those of the publisher, the editors and the reviewers. Any product that may be evaluated in this article, or claim that may be made by its manufacturer, is not guaranteed or endorsed by the publisher.
Acknowledgments
The authors would like to thank Hendrik Falck, Sara Ryan, Mike Ellerbeck, Steven Zhang, and Geneviève Marquis for comments that improved this manuscript. The authors would also like to thank two reviewers and associate editor Kathryn Goodenough for providing constructive feedback as part of the interactive review process.
Supplementary Material
The Supplementary Material for this article can be found online at: https://www.escubed.org/articles/10.3389/esss.2022.10064/full#supplementary-material
Supplementary Figure S1 | Semivariogram analysis of gravity, magnetic, and seismic datasets. The range of the fitted semivariogram was used to estimate the extent of spatial autocorrelation for data used as input for prospectivity models and for guiding the size of blocks for spatial cross-validation.
Supplementary Figure S2 | Map showing the training (1–5) and test blocks (6) used in the current study.
Supplementary Figure S3 | Receiver operating characteristics (ROC) plots for the preferred prospectivity model using either deposits and occurrences (A) or just deposits (B). The inflexion point on the ROC plot was used as threshold for defining prospective and non-prospective areas.
Supplementary Figure S4 | Standard deviation (SD; (a)) and relative standard deviation (RSD; (b)) of the preferred prospectivity model for 30 modified datasets. Each data point and dataset were modified by multiplying with a noise factor drawn from a uniform distribution (± 20%). The sensitivity of the preferred prospectivity model to hyperparameters was evaluated by calculating the SD (C) and RSD (D) for the top 30 models from the random grid search.
Supplementary Figure S5 | Variable importance for the baseline (A) and preferred (B) prospectivity models based on the classification error reduction observed for each dataset during training.
Supplementary Figure S6 | Success- and prediction-rate curves for the baseline (a) and preferred (b) prospectivity models.
Supplementary Figure S7 | Ecosystem services (n = 5) and the protected-area gap-analysis were combined using either an arithmetic sum (A) or a fuzzy gamma (B). The fuzzy gamma (γ = 0.85) operator penalizes missing ecosystem services and reduces the increasing tendency of the simple sum operator.
Supplementary Table S1 | Datasets and sources for baseline and preferred prospectivity.
Supplementary Table S2 | Prospectivity model results.
Supplementary Table S3 | Prospectivity model uncertainty.
Supplementary Table S4 | Prospectivity model training folds.
Supplementary Table S5 | Protected areas gap analysis.
References
Acosta-Góngora, P., Pehrsson, S. J., Sandeman, H., Martel, E., and Peterson, T. (2018). The Ferguson Lake Deposit: an Example of Ni–Cu–Co–PGE Mineralization Emplaced in a Back-Arc Basin Setting? Can. J. Earth Sci. 55, 958–979. doi:10.1139/cjes-2017-0185
Ali, S. H., Giurco, D., Arndt, N., Nickless, E., Brown, G., Demetriades, A., et al. (2017). Mineral Supply for Sustainable Development Requires Resource Governance. Nature 543, 367–372. doi:10.1038/nature21359
Allan, J. R., Possingham, H. P., Atkinson, S. C., Waldron, A., Di Marco, M., Butchart, S. H. M., et al. (2022). The Minimum Land Area Requiring Conservation Attention to Safeguard Biodiversity. Science 376, 1094–1101. doi:10.1126/science.abl9127
Arndt, N. T., Lesher, C. M., and Czamanske, G. K. (2005). Mantle-Derived Magmas and Magmatic Ni-Cu-(PGE) Deposits. Econ. Geol., 5. 24. doi:10.5382/AV100.02
Artelle, K. A., Zurba, M., Bhattacharyya, J., Chan, D. E., Brown, K., Housty, J., et al. (2019). Supporting Resurgent Indigenous-Led Governance: A Nascent Mechanism for Just and Effective Conservation. Biol. Conserv. 240, 108284. doi:10.1016/j.biocon.2019.108284
Aznar-Sánchez, J. A., Velasco-Muñoz, J. F., Belmonte-Ureña, L. J., and Manzano-Agugliaro, F. (2019). Innovation and Technology for Sustainable Mining Activity: A Worldwide Research Assessment. J. Clean. Prod. 221, 38–54. doi:10.1016/j.jclepro.2019.02.243
Baddeley, A., Brown, W., Milne, R. K., Nair, G., Rakshit, S., Lawrence, T., et al. (2021). Optimal Thresholding of Predictors in Mineral Prospectivity Analysis. Nat. Resour. Res. 30, 923–969. doi:10.1007/s11053-020-09769-2
Barnes, S.-J., and Lightfoot, P. C. (2005). Formation of Magmatic Nickel Sulfide Deposits and Processes Affecting Their Copper and Platinum Group Element Contents. Econ. Geol., 179. doi:10.5382/AV100.08
Barnes, S. J., Cruden, A. R., Arndt, N., and Saumur, B. M. (2016). The Mineral System Approach Applied to Magmatic Ni–Cu–PGE Sulphide Deposits. Ore Geol. Rev. 76, 296–316. doi:10.1016/j.oregeorev.2015.06.012
Baston, D., Isciences, L. L. C., and Baston, M. D. (2021). Package ‘exactextractr. Burlington, ISciences.
Begg, G. C., Hronsky, J. A. M., Arndt, N. T., Griffin, W. L., O’Reilly, S. Y., and Hayward, N. (2010). Lithospheric, Cratonic, and Geodynamic Setting of Ni-Cu-PGE Sulfide Deposits. Econ. Geol. 105, 1057–1070. doi:10.2113/econgeo.105.6.1057
Bide, T., Brown, T. J., Gunn, A. G., and Deady, E. (2022). Development of Decision-Making Tools to Create a Harmonised UK National Mineral Resource Inventory Using the United Nations Framework Classification. Resour. Policy 76, 102558. doi:10.1016/j.resourpol.2022.102558
Brandmeier, M., Cabrera Zamora, I. G., Nykänen, V., and Middleton, M. (2020). Boosting for Mineral Prospectivity Modeling: A New GIS Toolbox. Nat. Resour. Res. 29, 71–88. doi:10.1007/s11053-019-09483-8
Brooks, T. M., Mittermeier, R. A., da Fonseca, G. A. B., Gerlach, J., Hoffmann, M., Lamoreux, J. F., et al. (2006). Global Biodiversity Conservation Priorities. Science 313, 58–61. doi:10.1126/science.1127609
Calvo, G., and Valero, A. (2022). Strategic Mineral Resources: Availability and Future Estimations for the Renewable Energy Sector. Environ. Dev. 41, 100640. doi:10.1016/j.envdev.2021.100640
Carpenter, S. R., Mooney, H. A., Agard, J., Capistrano, D., DeFries, R. S., Diaz, S., et al. (2009). Science for Managing Ecosystem Services: Beyond the Millennium Ecosystem Assessment. Proc. Natl. Acad. Sci. U. S. A. 106, 1305–1312. doi:10.1073/pnas.0808772106
Carroll, C., and Ray, J. C. (2021). Maximizing the Effectiveness of National Commitments to Protected Area Expansion for Conserving Biodiversity and Ecosystem Carbon under Climate Change. Glob. Chang. Biol. 27, 3395–3414. doi:10.1111/gcb.15645
Coristine, L. E., Jacob, A. L., Schuster, R., Otto, S. P., Baron, N. E., Bennett, N. J., et al. (2018). Informing Canada’s Commitment to Biodiversity Conservation: A Science-Based Framework to Help Guide Protected Areas Designation through Target 1 and beyond. FACETS 3, 531–562. doi:10.1139/facets-2017-0102
Coristine, L. E., and Kerr, J. T. (2011). Habitat Loss, Climate Change, and Emerging Conservation Challenges in Canada1This Review Is Part of the Virtual Symposium “Flagship Species – Flagship Problems” that Deals with Ecology, Biodiversity and Management Issues, and Climate Impacts on Species at Risk and of Canadian Importance, Including the Polar Bear (Ursus maritimus), Atlantic Cod (Gadus morhua), Piping Plover (Charadrius Melodus), and Caribou (Rangifer tarandus). Can. J. Zool. 89, 435–451. doi:10.1139/z11-023
Dietze, M. C., Fox, A., Beck-Johnson, L. M., Betancourt, J. L., Hooten, M. B., Jarnevich, C. S., et al. (2018). Iterative Near-Term Ecological Forecasting: Needs, Opportunities, and Challenges. Proc. Natl. Acad. Sci. U. S. A. 115, 1424–1432. doi:10.1073/pnas.1710231115
Dinerstein, E., Olson, D., Joshi, A., Vynne, C., Burgess, N. D., Wikramanayake, E., et al. (2017). An Ecoregion-Based Approach to Protecting Half the Terrestrial Realm. BioScience 67, 534–545. doi:10.1093/biosci/bix014
Dirszowsky, R. W. (2020). “Natural and Human Impacted Landscapes of the Sudbury Mining Region,” in Landscapes and Landforms of Eastern Canada. Editors O. Slaymaker, and N. Catto (New York: Springer). doi:10.1007/978-3-030-35137-3_23
Dreiss, L. M., Lacey, L. M., Weber, T. C., Delach, A., Niederman, T. E., and Malcom, J. W. (2022). Targeting Current Species Ranges and Carbon Stocks Fails to Conserve Biodiversity in a Changing Climate: Opportunities to Support Climate Adaptation under 30 × 30. Environ. Res. Lett. 17, 024033. doi:10.1088/1748-9326/ac4f8c
Ebbing, J., Haas, P., Ferraccioli, F., Pappa, F., Szwillus, W., and Bouman, J. (2018). Earth Tectonics as Seen by GOCE-Enhanced Satellite Gravity Gradient Imaging. Sci. Rep. 8, 16356–16359. doi:10.1038/s41598-018-34733-9
Festa-Bianchet, M., Ray, J. C., Boutin, S., Côté, S. D., and Gunn, A. (2011). Conservation of Caribou (Rangifer tarandus) in Canada: an Uncertain future1This Review Is Part of the Virtual Symposium “Flagship Species – Flagship Problems” that Deals with Ecology, Biodiversity and Management Issues, and Climate Impacts on Species at Risk and of Canadian Importance, Including the Polar Bear (Ursus maritimus), Atlantic Cod (Gadus morhua), Piping Plover (Charadrius Melodus), and Caribou (Rangifer tarandus). Can. J. Zool. 89, 419–434. doi:10.1139/z11-025
Franks, D. M., Davis, R., Bebbington, A. J., Ali, S. H., Kemp, D., and Scurrah, M. (2014). Conflict Translates Environmental and Social Risk into Business Costs. Proc. Natl. Acad. Sci. U. S. A. 111, 7576–7581. doi:10.1073/pnas.1405135111
Gadd, M. G., Lawley, C. J. M., et al. (2022). Public Geoscience Solutions for Diversifying Canada’s Critical Mineral Production. London: Geological SocietySpecial Publications, 526.
Gielen, D., Boshell, F., Saygin, D., Bazilian, M. D., Wagner, N., and Gorini, R. (2019). The Role of Renewable Energy in the Global Energy Transformation. Energy Strategy Rev. 24, 38–50. doi:10.1016/j.esr.2019.01.006
Gray, P. A., Duwors, E., Villeneuve, M., Boyd, S., and Legg, D. (2003). The Socioeconomic Significance of Nature-Based Recreation in Canada. Environ. Monit. Assess. 86, 129–147. doi:10.1023/A:1024010819749
Hagemann, S. G., Lisitsin, V. A., and Huston, D. L. (2016). Mineral System Analysis: Quo Vadis. Ore Geol. Rev. 76, 504–522. doi:10.1016/j.oregeorev.2015.12.012
Hamilton, H., Smyth, R. L., Young, B. E., Howard, T. G., Tracey, C., Breyer, S., et al. (2022). Increasing Taxonomic Diversity and Spatial Resolution Clarifies Opportunities for Protecting US Imperiled Species. Ecol. Appl. 32, e2534. doi:10.1002/eap.2534
Hengl, T., Jesus, J. M. de, MacMillan, R. A., Batjes, N. H., Heuvelink, G. B. M., Ribeiro, E., et al. (2014). SoilGrids1km — Global Soil Information Based on Automated Mapping. PLOS ONE 9, e105992. doi:10.1371/journal.pone.0105992
Huston, D. L., Mernagh, T. P., Hagemann, S. G., Doublier, M. P., Fiorentini, M., Champion, D. C., et al. (2016). Tectono-metallogenic Systems — the Place of Mineral Systems within Tectonic Evolution, with an Emphasis on Australian Examples. Ore Geol. Rev. 76, 168–210. doi:10.1016/j.oregeorev.2015.09.005
IRP (2019). Global Resources Outlook 2019: Natural Resources for the Future We Want.” in A Report of the International Resource Panel.
Jowitt, S. M., Mudd, G. M., and Thompson, J. F. H. (2020). Future Availability of Non-renewable Metal Resources and the Influence of Environmental, Social, and Governance Conflicts on Metal Production. Commun. Earth Environ. 1, 13–18. doi:10.1038/s43247-020-0011-0
Jung, M., Arnell, A., de Lamo, X., Garcia-Rangel, S., Lewis, M., Mark, J., et al. (2021). Areas of Global Importance for Conserving Terrestrial Biodiversity, Carbon and Water. Nat. Ecol. Evol. 5, 1499–1509. doi:10.1038/s41559-021-01528-7
Keays, R. R., and Lightfoot, P. C. (2020). Mafic Intrusions in the Footwall of the Sudbury Igneous Complex: Origin of the Sudbury Impact Melt Sheet and its Associated Ore Deposits. Ore Geol. Rev. 120, 103435. doi:10.1016/j.oregeorev.2020.103435
Keppel, G., Mokany, K., Wardell-Johnson, G. W., Phillips, B. L., Welbergen, J. A., and Reside, A. E. (2015). The Capacity of Refugia for Conservation Planning under Climate Change. Front. Ecol. Environ. 13, 106–112. doi:10.1890/140055
Kraus, D., and Hebb, A. (2020). Southern Canada’s Crisis Ecoregions: Identifying the Most Significant and Threatened Places for Biodiversity Conservation. Biodivers. Conserv. 29, 3573–3590. doi:10.1007/s10531-020-02038-x
Lawley, C. J. M., McCafferty, A. E., Graham, G. E., Huston, D. L., Kelley, K. D., Czarnota, K., et al. (2022). Data–driven Prospectivity Modelling of Sediment–Hosted Zn–Pb Mineral Systems and Their Critical Raw Materials. Ore Geol. Rev. 141, 104635. doi:10.1016/j.oregeorev.2021.104635
Lawley, C. J. M., Tschirhart, V., Smith, J., Schetselaar, E. M., Schaeffer, A. J., Eglington, B. M., et al. (2021a). Datasets in support of prospectivity modelling for magmatic Ni (± Cu ± Co ± PGE) mineral systems. Geol. Surv. Can. 8754, 11. doi:10.4095/327573
Lawley, C. J. M., McCafferty, A. E., Graham, G. E., Gadd, M. G., Huston, D. L., Kelley, K. D., et al. (2021b). Datasets to support prospectivity modelling for sediment-hosted Zn-Pb mineral systems. Geol. Surv. Can. 8836, 11. doi:10.4095/329203
Lawley, C. J. M., Tschirhart, V., Smith, J. W., Pehrsson, S. J., Schetselaar, E. M., Schaeffer, A. J., et al. (2021). Prospectivity Modelling of Canadian Magmatic Ni (±Cu ± Co ± PGE) Sulphide Mineral Systems. Ore Geol. Rev. 132, 103985. doi:10.1016/j.oregeorev.2021.103985
Lèbre, É., Owen, J. R., Corder, G. D., Kemp, D., Stringer, M., and Valenta, R. K. (2019). Source Risks as Constraints to Future Metal Supply. Environ. Sci. Technol. 53, 10571–10579. doi:10.1021/acs.est.9b02808
Lèbre, É., Stringer, M., Svobodova, K., Owen, J. R., Kemp, D., Cote, C., et al. (2020). The Social and Environmental Complexities of Extracting Energy Transition Metals. Nat. Commun. 11, 4823. doi:10.1038/s41467-020-18661-9
Lemieux, C. J., and Scott, D. J. (2005). Climate Change, Biodiversity Conservation and Protected Area Planning in Canada. Can. Geogr. Ogr. Can. 49, 384–397. doi:10.1111/j.0008-3658.2005.00103.x
Lisitsin, V. A., González-Álvarez, I., and Porwal, A. (2013). Regional Prospectivity Analysis for Hydrothermal-Remobilised Nickel Mineral Systems in Western Victoria, Australia. Ore Geol. Rev. 52, 100–112. doi:10.1016/j.oregeorev.2012.04.001
Lisitsin, V. A., Porwal, A., and McCuaig, T. C. (2014). Probabilistic Fuzzy Logic Modeling: Quantifying Uncertainty of Mineral Prospectivity Models Using Monte Carlo Simulations. Math. Geosci. 46, 747–769. doi:10.1007/s11004-014-9534-1
Luckeneder, S., Giljum, S., Schaffartzik, A., Maus, V., and Tost, M. (2021). Surge in Global Metal Mining Threatens Vulnerable Ecosystems. Glob. Environ. Change 69, 102303. doi:10.1016/j.gloenvcha.2021.102303
Marshall, I. B., Smith, C. A. S., and Selby, C. J. (1996). “A National Framework for Monitoring and Reporting on Environmental Sustainability in Canada,” in Global to Local: Ecological Land Classification: Thunderbay, Ontario, Canada. Editors R. A. Sims, I. G. W. Corns, and K. Klinka. doi:10.1007/978-94-009-1653-1_4
Maus, V., Giljum, S., Gutschlhofer, J., da Silva, D. M., Probst, M., Gass, S. L. B., et al. (2020). A Global-Scale Data Set of Mining Areas. Sci. Data 7, 289. doi:10.1038/s41597-020-00624-w
McCuaig, T. C., Beresford, S., and Hronsky, J. (2010). Translating the Mineral Systems Approach into an Effective Exploration Targeting System. Ore Geol. Rev. 38, 128–138. doi:10.1016/j.oregeorev.2010.05.008
McIntire, E. J. B., Chubaty, A. M., Cumming, S. G., Andison, D., Barros, C., Boisvenue, C., et al. (2022). PERFICT: A Re-imagined Foundation for Predictive Ecology. Ecol. Lett. 25, 1345–1351. doi:10.1111/ele.13994
Michalak, J. L., Lawler, J. J., Roberts, D. R., and Carroll, C. (2018). Distribution and Protection of Climatic Refugia in North America: Climatic Refugia. Conserv. Biol. 32, 1414–1425. doi:10.1111/cobi.13130
Milidragovic, D., Nixon, G. T., Scoates, J. S., Nott, J. A., and Spence, D. W. (2021). Redox-controlled Chalcophile Element Geochemistry of the Polaris Alaskan-type Mafic-Ultramafic Complex, British Columbia, Canada. Can. Mineralogist 59, 1627–1660. doi:10.3749/canmin.2100006
Mitchell, M. G. E., Schuster, R., Jacob, A. L., Hanna, D. E. L., Dallaire, C. O., Raudsepp-Hearne, C., et al. (2021). Identifying Key Ecosystem Service Providing Areas to Inform National-Scale Conservation Planning. Environ. Res. Lett. 16, 014038. doi:10.1088/1748-9326/abc121
Moilanen, A. (2007). Landscape Zonation, Benefit Functions and Target-Based Planning: Unifying Reserve Selection Strategies. Biol. Conserv. 134, 571–579. doi:10.1016/j.biocon.2006.09.008
Moon, W. M., and An, P. (1991). Integration of Geophysical, Geological and Remote Sensing Data Using Fuzzy Set Theory. Geoinformatics 2, 171–176. doi:10.6010/geoinformatics1990.2.2_171
Morelli, T. L., Barrows, C. W., Ramirez, A. R., Cartwright, J. M., Ackerly, D. D., Eaves, T. D., et al. (2020). Climate-change Refugia: Biodiversity in the Slow Lane. Front. Ecol. Environ. 18, 228–234. doi:10.1002/fee.2189
Morelli, T. L., Daly, C., Dobrowski, S. Z., Dulen, D. M., Ebersole, J. L., Jackson, S. T., et al. (2016). Managing Climate Change Refugia for Climate Adaptation. PLOS ONE 11, e0159909. doi:10.1371/journal.pone.0159909
Mudd, G. M., and Jowitt, S. M. (2022). The New Century for Nickel Resources, Reserves, and Mining: Reassessing the Sustainability of the Devil’s Metal. Econ. Geol. 117, 1961–1983. doi:10.5382/econgeo.4950
Mungall, J. E. (2014). “Geochemistry of Magmatic Ore Deposits,” in Treatise on Geochemistry. Editors H. D. Holland, and K. K. Turekian. 2nd ed., 195–218. doi:10.1016/B978-0-08-095975-7.01108-6
Naldrett, A. J. (1981). Nickel Sulfide Deposits: Classification, Composition, and Genesis. Econ. Geol. 75th Anniv., 628–685. doi:10.5382/AV75.16
Nixon, G. T., Cabri, L. J., and Laflamme, J. H. G. (1990). Platinum-group-element Mineralization in Lode and Placer Deposits Associated with the Tulameen Alaskan-type Complex, British Columbia. Can. Mineralogist 28, 503.
Nixon, G. T., and Rublee, V. J. (1987). Alaskan-type Ultramafic Rocks in British Columbia: New Concepts of the Structure of the Tulameen Complex. Geol. Fieldwork.
Omernik, J. M. (1987). Ecoregions of the Conterminous United States. Ann. Assoc. Am. Geogr. 77, 118–125. doi:10.1111/j.1467-8306.1987.tb00149.x
Parsa, M. (2021). A Data Augmentation Approach to XGboost-Based Mineral Potential Mapping: an Example of Carbonate-Hosted ZnPb Mineral Systems of Western Iran. J. Geochem. Explor. 228, 106811. doi:10.1016/j.gexplo.2021.106811
Parsa, M., and Carranza, E. J. M. (2021). Modulating the Impacts of Stochastic Uncertainties Linked to Deposit Locations in Data-Driven Predictive Mapping of Mineral Prospectivity. Nat. Resour. Res. 30, 3081–3097. doi:10.1007/s11053-021-09891-9
Pebesma, E. (2018). Simple Features for R: Standardized Support for Spatial Vector Data. R J. 10, 439–446. doi:10.32614/rj-2018-009
R Core Team (2021). R: A Language and Environment for Statistical Computing. Vienna: R Foundation for Statistical Computing.
Roberts, D. R., Bahn, V., Ciuti, S., Boyce, M. S., Elith, J., Guillera-Arroita, G., et al. (2017). Cross-validation Strategies for Data with Temporal, Spatial, Hierarchical, or Phylogenetic Structure. Ecography 40, 913–929. doi:10.1111/ecog.02881
Rodon, T., and Lévesque, F. (2015). Understanding the Social and Economic Impacts of Mining Development in Inuit Communities: Experiences with Past and Present Mines in Inuit Nunangat. North. Rev. 41, 13–39. doi:10.22584/nr41.2015.002
Sappin, A.-A., Constantin, M., and Clark, T. (2011). Origin of Magmatic Sulfides in a Proterozoic Island Arc—An Example from the Portneuf–Mauricie Domain, Grenville Province, Canada. Min. Depos. 46, 211–237. doi:10.1007/s00126-010-0321-8
Sayre, R., Karagulle, D., Frye, C., Boucher, T., Wolff, N. H., Breyer, S., et al. (2020). An Assessment of the Representation of Ecosystems in Global Protected Areas Using New Maps of World Climate Regions and World Ecosystems. Glob. Ecol. Conservation 21, e00860. doi:10.1016/j.gecco.2019.e00860
Schuster, R., Germain, R. R., Bennett, J. R., Reo, N. J., and Arcese, P. (2019). Vertebrate Biodiversity on Indigenous-Managed Lands in Australia, Brazil, and Canada Equals that in Protected Areas. Environ. Sci. Policy 101, 1–6. doi:10.1016/j.envsci.2019.07.002
Sonter, L. J., Dade, M. C., Watson, J. E. M., and Valenta, R. K. (2020). Renewable Energy Production Will Exacerbate Mining Threats to Biodiversity. Nat. Commun. 11, 4174. doi:10.1038/s41467-020-17928-5
Sothe, C., Gonsamo, A., Arabian, J., Kurz, W. A., Finkelstein, S. A., and Snider, J. (2022). Large Soil Carbon Storage in Terrestrial Ecosystems of Canada. Glob. Biogeochem. Cycles 36, e2021GB007213. doi:10.1029/2021GB007213
Sovacool, B. K., Ali, S. H., Bazilian, M., Radley, B., Nemery, B., Okatz, J., et al. (2020). Sustainable Minerals and Metals for a Low-Carbon Future. Science 367, 30–33. doi:10.1126/science.aaz6003
Spillias, S., Kareiva, P., Ruckelshaus, M., and McDonald-Madden, E. (2020). Renewable Energy Targets May Undermine Their Sustainability. Nat. Clim. Chang. 10, 974–976. doi:10.1038/s41558-020-00939-x
Stralberg, D., Arseneault, D., Baltzer, J. L., Barber, Q. E., Bayne, E. M., Boulanger, Y., et al. (2020a). Climate-change Refugia in Boreal North America: what, where, and for How Long? Front. Ecol. Environ. 18, 261–270. doi:10.1002/fee.2188
Stralberg, D., Carroll, C., and Nielsen, S. E. (2020b). Toward a Climate-Informed North American Protected Areas Network: Incorporating Climate-Change Refugia and Corridors in Conservation Planning. Conserv. Lett. 13, e12712. doi:10.1111/conl.12712
Turcotte, A., Kermany, N., Foster, S., Proctor, C. A., Gilmour, S. M., Doria, M., et al. (2021). Fixing the Canadian Species at Risk Act: Identifying Major Issues and Recommendations for Increasing Accountability and Efficiency. FACETS 6, 1474–1494. doi:10.1139/facets-2020-0064
UNECE (2021a). Supplementary Specifications for the Application of the United Nations Framework Classification for Resources to Minerals. Geneva: United Nations Economic Commission for Europe.
UNECE (2021b). United Nations Resource Management System: An Overview of Concepts, Objectives and Requirements. Geneva: United Nations Economic Commission for Europe, 68.
USGS (2022). Mineral Commod.ity Summaries. Reston: United States Geological Survey, 20222022. doi:10.3133/mcs2022
Valavi, R., Elith, J., Lahoz-Monfort, J. J., and Guillera-Arroita, G. (2019). blockCV: An R Package for Generating Spatially or Environmentally Separated Folds for K-fold Cross-Validation of Species Distribution Models. Methods Ecol. Evol. 10, 225–232. doi:10.1111/2041-210X.13107
Valero, A., Valero, A., Calvo, G., and Ortego, A. (2018). Material Bottlenecks in the Future Development of Green Technologies. Renew. Sustain. Energy Rev. 93, 178–200. doi:10.1016/j.rser.2018.05.041
Venier, L. A., Thompson, I. D., Fleming, R., Malcolm, J., Aubin, I., Trofymow, J., et al. (2014). Effects of Natural Resource Development on the Terrestrial Biodiversity of Canadian Boreal Forests. Environ. Rev. 22, 457–490. doi:10.1139/er-2013-0075
Venter, O., Sanderson, E. W., Magrach, A., Allan, J. R., Beher, J., Jones, K. R., et al. (2016). Global Terrestrial Human Footprint Maps for 1993 and 2009. Sci. Data 3, 160067. doi:10.1038/sdata.2016.67
Walsh, S. D. C., Easton, L., Weng, Z., Wang, C., Moloney, J., and Feitz, A. (2021). Evaluating the Economic Fairways for Hydrogen Production in Australia. Int. J. Hydrogen Energy 46, 35985–35996. doi:10.1016/j.ijhydene.2021.08.142
Walsh, S. D. C., Northey, S. A., Huston, D., Yellishetty, M., and Czarnota, K. (2020). Bluecap: A Geospatial Model to Assess Regional Economic-Viability for Mineral Resource Development. Resour. Policy 66, 101598. doi:10.1016/j.resourpol.2020.101598
Wheeler, J., Hoffman, P., Card, K., Davidson, A., Sanford, B., Okulitch, A., et al. (1996). Geological map of Canada/Carte géologique du Canada. Geological Survey of Canada, ‘A’ Series Map 1860A. doi:10.4095/208175
Wickham, H., Averick, M., Bryan, J., Chang, W., McGowan, L., Francois, R., et al. (2019). Welcome to the Tidyverse. J. Open Source Softw. 4, 1686. doi:10.21105/joss.01686
World Economic Forum (2022). The Global Risks Report 2022. The Global Risks Report. 17th ed. Geneva: World Economic Forum
Wyborn, L. A. I., Heinrich, C. A., and Jaques, A. L. (1994). “Australian Proterozoic Mineral Systems: Essential Ingredients and Mappable Criteria,” in The AusIMM Annual Conference.
Zhang, Q., Chen, J., Xu, H., Jia, Y., Chen, X., Jia, Z., et al. (2022). Three-Dimensional Mineral Prospectivity Mapping by XGBoost Modeling: A Case Study of the Lannigou Gold Deposit, China. Nat. Resour. Res. 31, 1135–1156. doi:10.1007/s11053-022-10054-7
Zuo, R., Kreuzer, O. P., Wang, J., Xiong, Y., Zhang, Z., and Wang, Z. (2021). Uncertainties in GIS-Based Mineral Prospectivity Mapping: Key Types, Potential Impacts and Possible Solutions. Nat. Resour. Res. 30, 3059–3079. doi:10.1007/s11053-021-09871-z
Keywords: machine learning, critical minerals, sustainable development, conservation priorities, ecosystem services, mineral potential, battery
Citation: Lawley CJM, Mitchell MGE, Stralberg D, Schuster R, McIntire E and Bennett JR (2022) Mapping Canada’s Green Economic Pathways for Battery Minerals: Balancing Prospectivity Modelling With Conservation and Biodiversity Values. Earth Sci. Syst. Soc. 2:10064. doi: 10.3389/esss.2022.10064
Received: 11 July 2022; Accepted: 14 November 2022;
Published: 06 December 2022.
Edited by:
Kathryn Goodenough, British Geological Survey-The Lyell Centre, United KingdomReviewed by:
Simon Willcock, Bangor University, United KingdomIgnacio Gonzalez-Alvarez, Commonwealth Scientific and Industrial Research Organisation (CSIRO), Australia
Copyright © 2022 Lawley, Mitchell, Stralberg, Schuster, McIntire and Bennett. This is an open-access article distributed under the terms of the Creative Commons Attribution License (CC BY). The use, distribution or reproduction in other forums is permitted, provided the original author(s) and the copyright owner(s) are credited and that the original publication in this journal is cited, in accordance with accepted academic practice. No use, distribution or reproduction is permitted which does not comply with these terms.
*Correspondence: Christopher J. M. Lawley, christopher.lawley@nrcan-rncan.gc.ca